Download to read offline
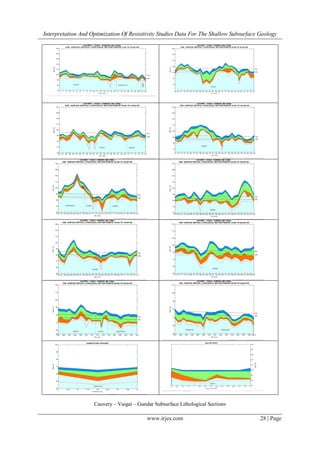
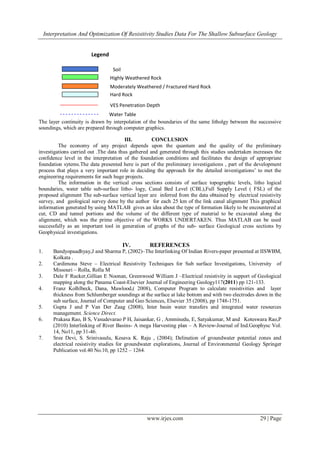

The document discusses the feasibility of the Cauvery-Vaigai-Gundar link canal as part of India's National Perspective Plan for inter-basin water transfer aimed at addressing regional water imbalances. It presents geophysical investigations and resistivity studies that outline subsurface geology and groundwater aquifers along the project alignment, indicating issues such as water table depth and overexploitation of bore wells. The interpretation of this data using MATLAB aids in designing appropriate foundation systems for the project's construction.


![Getting Started with Apache Spark: Big Data Made Simple [Free Meetup]](https://cdn.slidesharecdn.com/ss_thumbnails/apachesparkgettingstarted-260203175547-8361bcc3-thumbnail.jpg?width=640&height=640&fit=bounds)


