
Recommended
Recommended
More Related Content
What's hot
What's hot (20)
Similar to Cystathione -synthase regulates HIF-1 stability through persulfidation of PHD2
Similar to Cystathione -synthase regulates HIF-1 stability through persulfidation of PHD2 (20)
Recently uploaded
Recently uploaded (20)
Cystathione -synthase regulates HIF-1 stability through persulfidation of PHD2
- 1. Dey et al., Sci. Adv. 2020; 6 : eaaz8534 3 July 2020 SCI ENCE ADVANCES | RESEARCH ARTICLE 1 of 14 CELL BIOLOGY Cystathione -synthase regulates HIF-1 stability through persulfidation of PHD2 Anindya Dey1 , Shubhangi Prabhudesai2 , Yushan Zhang3 , Geeta Rao3 , Karthikeyan Thirugnanam2 , Md. Nazir Hossen3 , Shailendra Kumar Dhar Dwivedi1 , Ramani Ramchandran2 , Priyabrata Mukherjee3 *, Resham Bhattacharya1 * The stringent expression of the hypoxia inducible factor-1 (HIF-1) is critical to a variety of pathophysiological conditions. We reveal that, in normoxia, enzymatic action of cystathionine -synthase (CBS) produces H2S, which persulfidates prolyl hydroxylase 2 (PHD2) at residues Cys21 and Cys33 (zinc finger motif), augmenting prolyl hydro xylase activity. Depleting endogenous H2S either by hypoxia or by inhibiting CBS via chemical or genetic means reduces persulfidation of PHD2 and inhibits activity, preventing hydroxylation of HIF-1, resulting in stabilization. Our in vitro findings are further supported by the depletion of CBS in the zebrafish model that exhibits axis defects and abnormal intersegmental vessels. Exogenous H2S supplementation rescues both in vitro and in vivo pheno- types. We have identified the persulfidated residues and defined their functional significance in regulating the activity of PHD2 via point mutations. Thus, the CBS/H2S/PHD2 axis may provide therapeutic opportunities for pathol- ogies associated with HIF-1 dysregulation in chronic diseases. INTRODUCTION Hydrogen sulfide (H2S) is a gasotransmitter synthesized endoge- nously in mammals primarily through depersulfidation of cysteine by the pyridodoxyl 5′-phosphate–dependent enzymes: cystathionine -synthase(CBS),cystathionine-lyase(CSE),and3-mercaptopyruvate sulfurtransferase (3MST) (1). We and others have previously reported that H2S promotes angiogenesis through CBS-mediated persulfida- tion (2, 3) and activation of proximal signal transduction components. To date, more than 150 different mutations of CBS have been iden- tified in humans; CBS deficiency impairs the conversion of homo- cysteine to cystathionine and leads to hyperhomocysteinemia (4). Patients with CBS deficiency show a wide spectrum of disease sever- ity, including dislocation of the optic lenses, homocystinuria, osteo- porosis, marfanoid habitus, mental retardation, and a predisposition to cardiovascular diseases including thromboembolism and stroke. Most of these CBS deficiency–related conditions are also associated with notable endothelial dysfunction and impaired angiogenesis (5). Endothelial cells (ECs) line the vasculature and play a major role in maintaining oxygen and nutrient exchange in all tissues. During tissue damage, quiescent ECs activate and form angiogenic sprouts in a highly coordinated process (6). Because of their anatomical lo- cation, ECs are exposed to frequent changes in oxygen concentra- tion that potentially turn on hypoxia-inducible factor (HIF), a master regulator (7). The stabilization and transactivation of the subunit of HIF (HIF-1) are dependent on oxygen tension. In abundant ox- ygen, HIF-1 is constitutively hydroxylated on specific prolyl resi- dues by prolyl hydroxylase (PHD) enzymes. The hydroxylated prolyl residues on HIF-1 constitute the binding platform for the von Hippel-Lindau (VHL) tumor suppressor protein. The VHL protein has two major functional domains: The domain is required for the nucleation of the Elongins BC/Cul 2/VHL complex, and the domain is required for prolyl-hydroxylated HIF recognition (8). VHL is also a substrate recognition component of an E3 ubiquitin ligase complex that selectively recognizes hydroxylated HIF-1 (HIF-1– OH) and targets it for rapid degradation by the ubiquitin-proteasome pathway (9). Three mammalian PHD isoforms have been identified: PHD1, PHD2, and PHD3 (10). Although, all three PHD isoforms have a conserved PHD domain, PHD2 is the most abundant isoform in most cell types (11) and is therefore regarded as the central medi- ator of HIF-1 turnover. During hypoxia, the activity of the oxygen- dependent PHD2 is inhibited, and HIF-1 protein is stabilized. Stable HIF-1 associates with the subunit (HIF-1) and induces transcrip- tion of downstream targets that promote adaptation to a hypoxic environment (12). HIF-1 controls more than 2% of genes in vas- cular ECs, thereby regulating multiple aspects of EC biology, includ- ing cell survival, cell growth, cell invasion, and glucose metabolism, all of which are important to the induction of angiogenesis (6). The basal level of HIF-1 in normoxic tissues varies widely based on tissue and/or cell type (13). Many growth factors and cytokines stabilizeHIF-1undernormoxicconditions,includinginsulin,insulin- likegrowthfactors,transforminggrowthfactor,platelet-derivedgrowth factor, epidermal growth factor, and interleukin-1 (14–17). HIF-1 is stabilized under normoxic conditions in various pathophysiologies, including inflammation, ischemia, anemia, and several malignancies (13, 18), as well as during development. Hence, oxygen-dependent or -independent, HIF-1–reliant disruption of angiogenesis has long been considered of critical therapeutic importance in an extensive array of diseases, including acute ischemic stroke, chronic kidney disease (19), and in cancer (20). Here, we show that CBS via H2S production augments PHD2 activity, thereby modulating levels of HIF-1. Under normoxic conditions in vitro, inhibition of CBS depletes endogenous H2S, which inhibits PHD2 activity and, in turn, stabilizes HIF-1. In ad- dition, inhibition of CBS stabilizes HIF-1 in zebrafish embryos, leading to both axis defects and abnormal development of inter segmental vessels (ISVs). Exogenous H2S rescues these phenotypes, 1 Department of Obstetrics and Gynecology, Peggy and Charles Stephenson Cancer Center, University of Oklahoma Health Science Center, Oklahoma City, OK 73104, USA.2 DepartmentofPediatrics,DepartmentofObstetricsandGynecology,Children’s Research Institute, Medical College of Wisconsin, Milwaukee, WI 53226, USA. 3 Department of Pathology, Peggy and Charles Stephenson Cancer Center, University of Oklahoma Health Science Center, Oklahoma City, OK 73104, USA. *Corresponding author. Email: resham-bhattacharya@ouhsc.edu (R.B.); priyabrata- mukherjee@ouhsc.edu (P.M.) Copyright © 2020 The Authors, some rights reserved; exclusive licensee American Association for the Advancement of Science. No claim to originalU.S. Government Works. Distributed under a Creative Commons Attribution NonCommercial License 4.0 (CC BY-NC). onOctober1,2020http://advances.sciencemag.org/Downloadedfrom
- 2. Dey et al., Sci. Adv. 2020; 6 : eaaz8534 3 July 2020 SCI ENCE ADVANCES | RESEARCH ARTICLE 2 of 14 both in vitro and in vivo. Mechanistically, PHD2 is persulfidated by CBS; this maintains PHD2 activity and PHD2-mediated modulation of HIF-1 function. We demonstrate a previously unknown nexus of PHD2, HIF-1, and CBS that coordinately regulates PHD2 activity and hence HIF-1 stability in response to environmental cues. RESULTS Hypoxia attenuated EC proliferation, CBS expression, and H2S production Hypoxia plays a critical role in the early development of ECs within the vasculature of both the umbilical cord and the embryo. However, the influence of hypoxia on ECs is unclear. To investigate the role of hypoxia in EC proliferation, human umbilical vein ECs (HUVECs) and human aortic ECs (HAOEC) were incubated for 48 hours either under normoxic conditions, in 1% O2 (hypoxia), or with dimethyloxalylglycine (DMOG), a cell-permeable analog of 2-oxoglutarate that induces HIF-1. EC proliferation was significantly inhibited after 24 hours of hypoxia; however, DMOG significantly inhibited EC proliferation starting 12 hours after treatment (Fig. 1A and fig. S1A). These results demonstrate that both physical hypoxia and DMOG attenuate EC proliferation. To validate this observa- tion, we treated ECs with cobalt chloride (CoCl2), another modula- tor of PHD activity that, similar to DMOG, induces HIF-1. In a dose-dependent manner, CoCl2 significantly decreased both HUVEC and HAOEC proliferation (Fig. 1B). Together, these results confirm that either direct hypoxia or chemical modulation of PHD2 activity significantly inhibits EC proliferation. We previ- ously reported that CBS is the predominant H2S-producing enzyme in ECs and that silencing CBS inhibits EC proliferation (2). Because both hypoxia and CBS inhibition result in reduced EC proliferation, we hypothesized that these events are linked. To address this, we exposed both HUVEC and HAOEC to 1% O2 for 48 hours and de- termined the expression levels of all the H2S-producing enzymes. In both HUVEC and HAOEC, CBS expression was significantly re- duced, while expression of both CSE and 3MST remained unaffected (Fig. 1C). To confirm this finding, we treated ECs with increasing concentrations of CoCl2 for 48 hours. Similar to physical hypoxia, treatment with CoCl2 also significantly reduced CBS expression levels without altering CSE or 3MST (Fig. 1D). In total, these data confirm a nexus between hypoxia, depletion of CBS, and EC prolif- eration. We then determined H2S levels in hypoxic ECs and in ECs exposed to CoCl2 or DMOG using a modified methylene blue assay (2). Compared to cells grown in normoxic conditions, there was a significant decrease in cellular H2S levels under hypoxia (∼64% in HUVEC and ∼62% in HAOEC; Fig. 1E) and when treated with DMOG (∼53% in HUVEC and ∼52% in HAOEC; fig. S1B) or CoCl2 (∼46% in HUVEC and ∼59% in HAOEC; fig. S1B). These results confirm that hypoxic stress inhibits EC proliferation and reduces CBS expression, thereby suppressing H2S production. To determine whether observed changes in proliferation were due to HIF-1, we expressed the hemagglutinin (HA)–tagged HIF-1 with a deleted oxygen-dependent degradation (ODD) domain in HUVEC that cannot be degraded in normoxic conditions. Expres- sion of HIF-1 was confirmed by immunoblotting for HA and for HIF-1, respectively (fig. S1C). We observed a dose-dependent decrease in HUVEC proliferation compared to the empty vector control (fig. S1D). These results support that inhibition in EC pro- liferation is modulated via HIF-1. H2S donors or forced CBS expression rescues the hypoxia-associated phenotype To address a direct role for H2S in hypoxia, both HUVEC and HAOEC were incubated in 1% O2 for 48 hours; for the final 2 hours, the H2S donor sodium hydrosulfide (NaHS) was added at various concentrations. The hypoxia-induced increase in HIF-1 levels was partially reversed by NaHS treatment (Fig. 2A). To corroborate these observations, we treated ECs with GYY4137 (GYY), another small molecule that slowly releases H2S. ECs were treated with GYY under both normoxic and hypoxic conditions. Similar to NaHS, treatment with GYY reduced hypoxia-associated HIF-1 levels, while the expression of CBS remained unchanged (Fig. 2B). To fur- ther investigate why H2S supplementation alters HIF-1 levels in hypoxia, we determined HIF-1–OH with an antibody specific to hydroxyproline-564 by immunoblotting in HUVEC (fig. S2). With prolonged exposure and sensitive chemiluminescence reagents, we detected HIF-1–OH bands in normoxic cells treated with or with- out GYY. In hypoxic cells, HIF-1–OH was undetectable; however, a faint but detectable band was observed with GYY treatment (fig. S2). Together, these results suggest that H2S supplementation can regulate HIF-1 levels by modulating its hydroxylation. To deter- mine the impact of H2S on EC proliferation, we used the 5-bromo- 2′-deoxyuridine (BrdU) assay. Both ECs in 1% oxygen showed ~50% inhibition in proliferation that was significantly restored (by ~30 and ~ 35%, respectively, in HUVEC and HAOEC) after treat- ment with GYY (Fig. 2C). We also measured the intracellular H2S levels in this context. Corroborating previous results (Fig. 1E), 1% O2 significantly decreased cellular H2S levels, and GYY treatment partially restored but did not reach levels observed in normoxic cells (Fig. 2D). Overall, these results show that the depletion of H2S by hypoxia inhibits EC proliferation and that this phenotype is par- tially rescued by H2S supplementation. To substantiate a role for CBS in this H2S effect, we transfected HUVECs with empty vector or the vector carrying CBS (FLAG-CBS) and then exposed cells to 1% O2 for 48 hours. Forced expression of CBS partially reduced hypoxia-induced HIF-1 levels (Fig. 2E). In addition, PHD2 levels were up-regulated by hypoxia irrespective of CBS status (Fig. 2E). To determine whether GYY effects on proliferation were through the PHD2/ HIF-1 axis, we silenced VHL in HUVEC using small interfering RNA (siRNA) followed by treatment with or without GYY. Because HIF-1 stabilization in VHL-silenced cells is downstream of PHD2, we expected no effect of GYY. As expected, silencing of VHL led to increased HIF-1 that was not altered by GYY treat- ment (Fig. 2F). Furthermore, significant inhibition in proliferation was observed in VHL-silenced cells that remained unchanged with GYY supplementation (Fig. 2G). These results suggest that H2S modulates HIF-1 levels, which affect EC proliferation. Inhibition of CBS stabilizes HIF-1 in normoxia by impairing PHD2 activity We next sought to determine a connection between CBS and HIF-1 in normoxic conditions. To this end, we either transfected ECs with CBSsiRNA(si-CBS)ortreatedECswithaminooxyacteicacid(AOAA), a chemical inhibitor of CBS for 48 hours. Both pharmacologic and genetic inhibition of CBS triggered an increase in HIF-1 levels in both tested cell lines (Fig. 3A). The genetic knockdown of CBS also caused a significant decrease in H2S levels, ∼61% in HUVEC and ∼56% in HAOEC (fig. S3A). To interrogate further, we treated CBS- silenced cells with GYY. While GYY did not affect HIF levels in onOctober1,2020http://advances.sciencemag.org/Downloadedfrom
- 3. Dey et al., Sci. Adv. 2020; 6 : eaaz8534 3 July 2020 SCI ENCE ADVANCES | RESEARCH ARTICLE 3 of 14 Fig. 1. Hypoxia-attenuated EC proliferation, CBS expression, and H2S production. (A) HUVECs and HAOECs were exposed to normoxia (Con) or hypoxia (1% O2) or treated with 1 mM DMOG for 48 hours. Using the CyQUANT Assay, EC proliferation was evaluated at different time intervals. Normoxic untreated control cells were set to 100%. Data are the means ± SD of three independent experiments performed in triplicate. *P < 0.05 when comparing with respective normoxic controls by a one-way analysis of variance (ANOVA). (B) HUVEC and HAOEC were treated with cobalt chloride (CoCl2) at the indicated concentrations for 48 hours and cellular proliferation was assessed using the 5-bromo-2′-deoxyuridine (BrdU) assay. Data are the means ± SD of three independent experiments performed in triplicate. *P < 0.05 when comparing with respective nontreated controls by a one-way ANOVA. (C) HUVEC and HAOEC were exposed to either normoxia or 1% O2 for 48 hours. Expression of HIF-1, PHD2, CBS, CSE, and 3MST was determined by immunoblot. -Actin was used as a loading control. (D) HUVEC and HAOEC were treated with increasing concentrations of CoCl2 for 48 hours, and the expression of HIF-1, PHD2, CBS, CSE, 3MST, and -actin was determined by immunoblotting. (E) HUVEC and HAOEC were exposed to either nor- moxia (Con) or hypoxia (1% O2) for 48 hours, and H2S levels were determined by methylene blue assay. Data are the means ± SD of three independent experiments per- formed in triplicate. *P < 0.05 when comparing with the respective controls by Student’s t test. onOctober1,2020http://advances.sciencemag.org/Downloadedfrom
- 4. Dey et al., Sci. Adv. 2020; 6 : eaaz8534 3 July 2020 SCI ENCE ADVANCES | RESEARCH ARTICLE 4 of 14 control ECs, there was a notable decrease in HIF-1 (Fig. 3B) and HIF-2 (fig. S3B) when CBS-silenced cells were treated with GYY. These data indicate that exogenous H2S can reverse the CBS depletion- mediated HIF increase observed in normoxia. A hallmark of ECs is their ability to undergo morphogenic changes to form a network of tubular structures, which is a representative of EC differentiation (21). To determine the functional relevance of the above findings, weusedthegold-standardECtubeformationassay.SilencingofCBS by two different siRNAs disrupted the tubular network observed in con- trol ECs, and this disruption was partially rescued by GYY treatment (Fig. 3C, quantitated in fig. S3, C and D and fig. S3F, quantified in fig. S3, G and H). HUVEC tube length (fig. S3, C and F) and the num- ber of meshes formed (fig. S3, D and G) were down-regulated by both the CBS siRNA, which was significantly restored by GYY treatment. In normoxic conditions, PHD2 hydroxylates specific proline residues in the ODD domain of HIF-1. This hydroxylation allows HIF-1 to associate with VHL, and HIF-1 is then targeted for deg- radation (9). We therefore assessed the relationship between PHD2 activity and CBS using four separate experiments. First, by immuno- blotting, we determined levels of HIF-1–OH from HUVEC harboring Fig. 2. Exogenous hydrogen sulfide supplementation either by chemical donors or CBS overexpression rescued hypoxic stress. (A) HUVEC and HAOEC were exposed to normoxia or hypoxia (1% O2) for 48 hours; for the final 2 hours, ECs were exposed to various concentrations (0.1, 0.5, and 1 mM) of an H2S donor, NaHS. Expression of HIF-1 and -actin was determined by immunoblotting. (B) HUVEC and HAOEC were exposed to normoxia or 1% O2 in the presence or absence of 0.5 mM of another small-molecule slow-release H2S generator, GYY4137 (GYY) for 48 hours, and immunoblotting were performed with the respective indicated antibodies. (C) HUVEC and HAOEC were exposed to normoxia or 1% O2 in the presence or absence of 0.5 mM GYY for 48 hours, and cellular proliferation was assessed using the BrdU assay. Data are the means ± SD of three independent experiments performed in triplicate. *P < 0.05 when comparing the specified groups. (D) HUVEC was exposed to normoxia or 1% O2 in the presence or absence of 0.5 mM GYY for 48 hours, and H2S levels were determined by the methylene blue assay. Data are the means ± SD of three independent ex- periments performed in triplicate. *P < 0.05 when comparing with respective untreated normoxic controls by one-way ANOVA. (E) HUVECs were first transfected with either empty vector or the FLAG-CBS construct and then further exposed to normoxia or 1% O2 for 48 hours before determining the expression of HIF-1, CBS, PHD2, and -actin by immunoblotting. (F) HUVEC was transfected with either scrambled or VHL siRNA (si-VHL) and was supplemented with or without 0.5 mM GYY for 48 hours, and immunoblotting was performed with the indicated antibodies. SE and LE represent as shorter exposure and longer exposure, respectively, of VHL blots during develop- ment. (G) Both si-Con– and si-VHL–transfected HUVEC were supplemented with 0.5 mM GYY for 48 hours, and proliferation was evaluated using the CyQUANT Assay. Data are the means ± SD of three independent experiments performed in triplicate. *P < 0.05 when compared with the si-Control by a one-way ANOVA. ns, not significant. onOctober1,2020http://advances.sciencemag.org/Downloadedfrom
- 5. Dey et al., Sci. Adv. 2020; 6 : eaaz8534 3 July 2020 SCI ENCE ADVANCES | RESEARCH ARTICLE 5 of 14 Fig. 3. Inhibition of CBS stabilized HIF-1 in normoxia by impairing PHD2 activity. (A) HUVEC and HAOEC were transfected with either scrambled (si-Con) or si-CBS for 48 hours. Similarly, HUVEC and HAOEC were incubated with or without AOAA, a chemical inhibitor of CBS, for 48 hours. NT, vehicle treated control. Expression of HIF-1, CBS, and PHD2 was determined by immunoblotting. -Actin was used as a loading control. (B) Both si-Control and si-CBS–transfected (for 48 hours) HUVEC and HAOEC were supplemented with 0.5 mM GYY, and immunoblotting was performed with the indicated antibodies. (C) Tube formation assay was performed in si-Control and si-CBS–transfected (48 hours) HUVECs supplemented with or without 0.5 mM GYY on growth-factor reduced Matrigel (2 mg/ml). The images were acquired 4 hours after plating HUVECs on Matrigel in complete endothelial basal medium. Each scale bar represents 200 micron. (D) Both HUVEC and HAOEC cells were transfected with si-Control or si-CBS and incubated with or without 0.5 mM GYY for 48 hours. Cell lysates from each treatment condition were incubated with recombinant biotinylated HIF-1 peptide, and the peptide was then captured using streptavidin-conjugated magnetic beads. Next, these peptide-coated beads were incubated with in vitro translated [35 S] pVHL and finally quantified by SDS-PAGE and autoradiography as a measurement PHD2 activity. (E) In vitro prolyl hydroxylation of the purified HIF-1–ODD protein at 0 and 15 min using lysates from HUVEC cells harboring either si-Control or si-CBS and incubated for 48 hours with or without GYY. Hydroxylation of HIF-1ODD was determined using the hydroxyprolyl-specific antibody at proline-564 (HIF-1–OHODD ), and total HIF-1 was detected (HIF-1ODD ). DMOG-treated lysates were used as a negative control, and -tubulin was used as a loading control. (F) HUVEC cells were treated with either si-Control or si-CBS for 48 hours and both hydroxylated and total HIF-1 were detected from 0 to 120 min after proteasomal blockade with 1 M MG132. Pico refers to regular chemiluminescence reagents that work in the picomolar range, we detected weak hydroxylated HIF-1 bands, and however, with the highest sensitive femtomolar reagents (Femto) and prolonged exposure more prominent bands could be detected. (G) mRNA expression levels of various HIF-1 target genes in si-Con and si-CBS-transfected (48 hours) HUVECs were determined by quantitative polymerase chain reaction analysis. 18S ribosomal RNA (rRNA) was used as an internal control. si-Con mRNA levels were set to 1 and data represent mean ± SD of three independent experiments performed in triplicate. *P < .05 when comparisons were made by Student’s t test. onOctober1,2020http://advances.sciencemag.org/Downloadedfrom
- 6. Dey et al., Sci. Adv. 2020; 6 : eaaz8534 3 July 2020 SCI ENCE ADVANCES | RESEARCH ARTICLE 6 of 14 either si-Control or si-CBS. In the absence of GYY, compared to the control, total HIF-1 was up-regulated in CBS-silenced cells but was less hydroxylated (fig. S3H). When comparing CBS- silenced cells treated with or without GYY, we observed decrease in total HIF-1 levels and a weak band for HIF-1–OH was de- tected (fig. S3H), suggesting that depleting CBS inhibits hydroxyl- ation of HIF-1 that GYY may restore. To further address this observation, we took a second approach using the VHL capture assay (22). The VHL assay relies on the tight interaction between VHL and HIF-1–OH at position Pro564 that is mediated by PHD2 (10). HUVEC and HAOEC cells harboring either si-Control or si-CBS were incubated for 48 hours with or without GYY, and cel- lular lysates were prepared to act as a source of PHD2. The lysates were incubated with recombinant biotinylated HIF-1 peptide; following incubation, the peptide was captured using streptavidin- conjugated magnetic beads. These peptide-coated beads were in- cubated with in vitro–translated [35 S]pVHL and quantified by SDS–polyacrylamide gel electrophoresis (PAGE) and autoradio graphy. A 60 to 70% loss of the [35 S]pVHL signal indicated that HIF-1 was significantly less hydroxylated by PHD2 from CBS- silenced cells (Fig. 3D). These results have been quantified and compared to CBS-silenced cells, cotreatment with GYY restored the signal by 2.3-fold in HUVECs and by 1.8-fold in HAOECs (fig. S4A). In a third approach, we performed an in vitro prolyl hydro xylation assay as reported by Burr et al. (23) to directly determine PHD activity toward HIF-1 in CBS-silenced cells and to deter- mine whether exogenous supplementation with H2S could restore activity. Briefly, HUVEC cells harboring either si-Control or si- CBS were incubated for 48 hours with or without GYY. These cel- lular lysates served as a source of PHD2, which were incubated with a purified HIF-1–ODD protein and hydroxylation deter- mined using the hydroxyprolyl-specific antibody at 0 and 15 min, respectively (Fig. 3E). While lysates from the control cells hydro xylated the HIF-1–ODD protein, lysates from the CBS-silenced cells demonstrated reduced hydroxylation (Fig. 3E). Hydroxyl- ation was partially restored upon H2S supplementation by GYY in the CBS-silenced cells. DMOG served as a negative control in this assay (Fig. 3E). These results indicate that CBS/H2S maintains PHD2 persulfidation, which regulates HIF-1 prolyl hydroxyl- ation. Last, to establish the link between CBS and PHD2 activity that is reflected by HIF-1 hydroxylation, we treated HUVEC with the proteasome inhibitor MG132, which blocks HIF-1 degra- dation and performed the chase assay at various time points (24). Briefly, we treated HUVEC cells with either si-Control or si-CBS for 48 hours and determined both hydroxylated and total HIF-1 from 0 to 120 min after proteasomal blockade. We observed an accumulation of HIF-1 and concomitant accumulation of the hy- droxylated species with time in control cells (Fig. 3F). This was most prominent at 30 to 120 min in control cells, where the ratio of hydroxylated/total HIF increases continually (fig. S4B). However, in CBS-silenced cells, the ratio remains consistently low, indicat- ing that, despite accumulation of total HIF over time, the hydro xylated species did not increase appreciably (Fig. 3F), leading us to conclude that HIF-1 is less hydroxylated by PHD2 in CBS- silenced cells. In support of these observations, mRNA expression of several bona fide HIF-1 target genes was up-regulated in CBS- silenced HUVECs (Fig. 3G). Together, these results (fig. S3E and Fig. 3, D to F) indicate that CBS regulates PHD2 activity and con- sequently HIF-1 levels in normoxia. In vivo inhibition of CBS stabilized HIF-1 and caused abnormal development of ISVs in zebrafish embryos To translate our in vitro findings to a relevant in vivo model, we evaluated the effect of CBS depletion on HIF-1 stabilization in zebrafish embryos. We previously reported that, of the two CBS or- thologs in zebrafish, cbsb is responsible for anterior-posterior axis development and that cbsa function is redundant (25). In that study, we used splice morpholinos (MOs) and CRISPR-Cas9–based ge- nomic engineering to inhibit cbsb. Here, we used the same approach of cbsb knockdown to corroborate our in vitro findings. We exam- ined the protein expression of CBS and HIF-1 in the embryo lysates. A consistent down-regulation of CBS protein at both 24 and 48 hpf (hours post fertilization) in cbsb MO–injected fish embryos or in 48-hpf cbsb CRISPR–injected fish embryos (Fig. 4A) confirmed in- hibition of CBS. In all CBS depleted embryos, the HIF-1 level was elevated, suggesting inhibition of CBS-induced hypoxia in zebrafish embryos(Fig. 4A).TofurtherconfirmthatH2SproductionandHIF-1 stabilization are associated, both cbsb MO– and cbsb CRISPR–injected fish embryos were treated with GYY starting at 6 hpf. Exogenous H2S supplementation in both cbsb MO (Fig. 4B) and in cbsb CRISPR (Fig. 4C) embryos reversed the HIF-1 elevation. We additionally assessed the morphologic changes in cbsb CRISPR embryos both with and without GYY. Consistent with our previously published report (25), embryos with loss of cbsb exhibited a shortened and bent axis; exogenous H2S rescued this phenotype, restoring the axis to a mor- phology similar to that of the control (Fig. 4, D to G). We also observed abnormal development of ISVs in cbsb CRISPR embryos, a pheno- type that was also rescued by GYY treatment (Fig. 4, E, F, and H). Together, these results suggest that inhibition of CBS stabilizes HIF- 1 in zebrafish embryos in normoxic conditions and that the asso- ciated elevated HIF-1 leads to abnormal development of ISV formation. To further investigate whether the phenotypes observed in the cbsb knockdown embryo was due to increased HIF-1, we de- cided to knockdown hif-1 in a cbsb MO background. There are two hif-1 genes in the zebrafish genome, hif-1aa and hif-1ab, and both are reported to be required for macrophage-mediated blood vessel patterning in zebrafish (26). We performed the suggested hif-1aa, hif-1ab double MO injections but found this to be toxic to embryos as hif-1ab MO was predicted to have very low affinity for the zebrafish RNA target (manufacturer’s recommendation); hence, we injected hif-1aa MO singly. This was well tolerated by the embryos, and im- munoblotting confirmed significant decrease in HIF-1 levels (fig. S5, A and B). We found that Hif-1aa knockdown embryos lacked dorsal longitudinal anastomotic vascular (DLAV) (fig. S5, C′ and D′), a phenotype previously reported by Gerri et al. (26). This DLAV phenotype was observed in ~80% of the embryos (fig. S5D′, yellow arrow; fig. S5E). We also treated hif-1aa MO fish with 0.5 mM GYY4137 but did not observe any rescue of (fig. S5, E and F) these vascular defects. Upon incubation with GYY, the hif-1aa knockdown embryos showed similar number (~80%) of DLAV phenotype (fig. S5E) and showed no change in Hif-1 protein level (fig. S5, A and B). In addition to the DLAV phenotype, we also observed additional pheno types (small eyes and no head) [fig. S5, D (black arrow) and F], which further increased upon GYY treatment (fig. S5F). These pheno types were not reported elsewhere, and further experimentation is needed to conclusively determine that these are related to the loss of Hif-1aa protein. We next performed the combined cbsb and hif-1aa knockdown experiment, but due to high rates of death, the embryo numbers recovered are too low for interpretation. When GYY4137 onOctober1,2020http://advances.sciencemag.org/Downloadedfrom
- 7. Dey et al., Sci. Adv. 2020; 6 : eaaz8534 3 July 2020 SCI ENCE ADVANCES | RESEARCH ARTICLE 7 of 14 Fig. 4. Inhibition of CBS-stabilized HIF-1 in zebrafish embryos caused abnormal development of ISVs. (A) Zebrafish embryos were injected with either control MO (ConMO) or cbsb MO (cbsb MO), and embryos assessed at 24 or 48 hpf or zebrafish embryos were injected with control and cbsb CRISPR and assessed at 48 hpf. The protein expression of HIF-1 and CBS in the embryo lysates was evaluated by immunoblotting. Glyceraldehyde-3-phosphate dehydrogenase (GAPDH) was used as a loading control. (B) ConMO or cbsMO-injected zebrafish embryos were treated with or without 0.5 mM GYY4137 (GYY) at 6 hpf, and at 48 hpf, immunoblotting was performed with the indicated antibodies. (C) Control and cbsb CRISPR fish embryos were treated with or without 0.5 mM GYY4137 (GYY) at 6 hpf, and at 48 hpf, immunoblotting was performed with the indicated antibodies. (D to F) Bright-field whole mount images (D to F) and fluorescent images of the vasculature (D′ to F′) are shown at 52 hpf for embryos from either Tg[flk:EGFP (enhanced green fluorescent protein); CASPER] line (control) or the Tg(flk:EGFP; cbsb CRISPR, CASPER) line (cbsb CRISPR) were treated or not with GYY4137 (0.5 mM) or dimethyl sulfoxide at 6 hpf and were imaged. The box in (D″) indicates the region of enhancement in images (D″) to (F″). The bent axis is marked by the yellow arrow in (E), and disrupted ISVs are marked by the white asterisk in (E″). Each scale bar represents 0.25mm. (G and H) Quantification for axis and ISVs, respectively. Data are the means ± SD of three independent experiments. *P < 0.05 when comparing normal axis/normal ISVs of cbsb CRISPR with all other groups and #P < 0.05 when comparing abnormal axis/abnormal ISVs of cbsb CRISPR versus other groups. The embryo orientation in all the figure panels, left is anterior (A) and right is posterior (P), while top is dorsal (D) and bottom is ventral (V). n = 99 embryos for the control group, n = 52 embryos for the cbsb CRISPR group, and n = 52 embryos for the cbsb CRISPR + GYY group, which are total number of embryos from three independent experiments. onOctober1,2020http://advances.sciencemag.org/Downloadedfrom
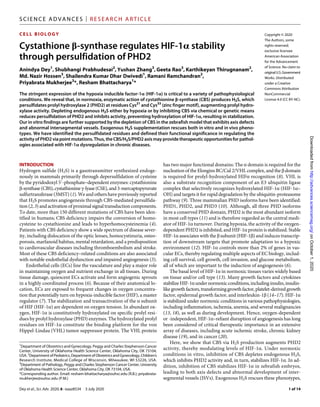
- 8. Dey et al., Sci. Adv. 2020; 6 : eaaz8534 3 July 2020 SCI ENCE ADVANCES | RESEARCH ARTICLE 8 of 14 was added to cbsb CRISPR fish, it partially rescues the head edema, axis, and intersomitic vessel defects (Fig. 4). Thus, there are distinct differences between cbsb and hif-1aa loss-of-function phenotypes. Together, these results indicate that if the cbsb loss of function asso- ciated increase in Hif-1 levels is connected with the phenotype rescue by H2S, then knocking down Hif-1 protein should not res- cue under hydrogen sulfide supplementation (GYY), which is what was observed in our experiments. The GYY data combined with the different vascular phenotypes in the two distinct loss of function alleles (hif-1aa and cbsb) suggest that there are possibilities of some HIF independent function of CBS. PHD2 is persulfidated by CBS and persulfidation of PHD2 at the zinc finger domain maintains its activation We next sought to determine the relationship between CBS, H2S, and PHD2 activity. H2S can modify proteins via persulfidation, a posttranslational modification that occurs at reactive Cys residues of target proteins. To address this possible mechanism, we assessed whether H2S could directly modify PHD2. Both HUVEC and HAOEC were incubated for 2 hours either with or without NaHS and were then subjected to the modified biotin-switch assay. PHD2 was endogenously persulfidated (Fig. 5A) and in a dose-dependent manner by NaHS (fig. S6A). The specificity of this assay was con- firmed by addition of dithiothreitol (DTT), which reduces disulfide bonds and prevents streptavidin capture (Fig. 5A). Either hypoxic treatment or silencing CBS in normoxic conditions significantly de- creased endogenously persulfidated PHD2 (Fig. 5B and fig. S6, B and C,), confirming that the persulfidation of PHD2 is regulated by CBS. We additionally performed liquid chromatography–tandem mass spectrometry (LC-MS/MS) on the full-length PHD2 protein to identify the cysteine residue(s) that were persufidated. LC-MS/MS analysis revealed five cysteine residues (C21, C33, C127, C201, and C208) as putative persulfidation sites in PHD2 (fig. S7). Clustal analysis of the PHD1, PHD2, and PHD3 proteins also indicated that four of the five putative cysteine persulfidation residues in PHD2 (C33, C127, C201, and C208) are also conserved in PHD1, but only one cysteine (C201) is conserved in PHD3. We observed that, simi- lar to PHD2, endogenous PHD1 was also persulfidated by NaHS (fig. S6D), but we could not detect persulfidation for PHD3. Al- though PHD1, PHD2, and PHD3 all could be functional, several reports including EC-specific knockouts of PHD1 or PHD2 support a prominent role for PHD2 in regulating EC function (27). To silence PHD2, we assessed two different siRNAs (Si-PHD2_08 and Si-PHD2_09) in ECs; efficient silencing occurred with both siRNAs (Fig. 5C). We generated five PHD2 constructs; in each construct, a different one of the five candidate cysteine residues was mutated to serine. Because Si-PHD2_08 targets the untranslated region (UTR), the PHD2 constructs are resistant to it (Fig. 5D), while the endogenous protein is depleted. In PHD2-silenced HUVECs, we reexpressed either the wild-type (WT) or the mutated PHD2 con- structs and performed the pVHL capture assay. PHD2 activity was significantly inhibited by mutating C21 (M1) or C33 (M2) but not by mutating any of the other three sites (Fig. 5E and fig. S6E). PHD2 contains a highly conserved myeloid nervy deformed epi- dermal autoregulatory factor 1 homolog (MYND)–type zinc finger (28, 29) with two conserved CXXC (two cysteines separated by two other residues) domains C21/24 and C33/36; the two mutations that affect PHD2 activity fall within one or the other of these con- served domains. To determine whether the identified cysteine resi- dues within PHD2 were important for association with HIF-1a, we assessed the interaction of mutant or WT PHD2 with full-length glutathione S-transferase (GST)–HIF-1. Briefly, HUVEC cells were transfected with either si-Control, si-PHD2, or si-PHD2 along with reexpressionofWTormutantPHD2constructs. Cellular lysates served as a source of PHD2 and were incubated with GST or GST–HIF-1 prebound to GSH-agarose for 2 hours at 4°C. Respective agarose pull- down was then subjected to immunoblotting for PHD2 and HIF-1, while cellular lysates served as input control for PHD2 (Fig. 5F). The association of PHD2 with HIF-1 was significantly reduced by M1 and M2 but not the other mutants corroborating results from the VHL capture assay (Fig. 5E). This result suggests that persulfi- dation at the zinc finger motif of PHD2 facilitates association with HIF-1, likely aiding prolyl hydroxylation. Overall, these results indicate that CBS and H2S support persulfidation of PHD2 at cyste- ine residues within the zinc finger, which is important for hydrox- ylation of HIF-1 and subsequent recognition by VHL, ultimately resulting in proteasomal degradation. Despite its induction at the protein level, PHD2 has reduced activity in hypoxic conditions. We speculate that this reduced activity results, at least in part, from low H2S levels caused by down-regulation of CBS in hypoxia (Fig. 6). DISCUSSION The transcription factor HIF-1 is critical to the hypoxic response and cellular metabolism, both of which directly affect angiogenesis, tumor progression, and cardiovascular disease (30). HIF-1 is reg- ulated by both oxygen-dependent and -independent mechanisms (31, 32). Here, we report an important connection between the meta bolic pyridoxine-dependent enzyme CBS, PHD2, HIF-1, and VHL. In ECs, H2S, generated via the action of CBS, persulfidates PHD2, which augments hydroxylation of HIF1a, rendering it sensitive to VHL-mediated proteasomal degradation. In mammals, methionine is an essential sulfur-containing amino acid that can only be obtained from the diet. The transsulfuration pathway is the major route for metabolism of sulfur-containing amino acids and generates S-adenosylmethione (SAM), a major methyl donor for a variety of biologically important reactions. In a two-step reaction, SAM is further metabolized to homocysteine, and the latter is the substrate from which CBS generates H2S (33). Therefore, en- vironmental cues or oncogenes that affect cellular nutrient and meta bolic status impinge on both CBS activity and H2S production, which, our results suggest, affect HIF levels. Corroborating previous reports, we found that hypoxia increased the expression of PHD2 (34, 35) in ECs. However, PHD2 shows reduced activity during hypoxia (34, 35). This is likely an adaptive response, which allows a rapid response to subtle drops in oxygen levels and subsequent reoxygenation. Such a scenario can be readily envisioned in the poorly vascularized tumor milieu or in cardiovas- cular diseases where cardiac perfusion is compromised (30). In addition to its C-terminal PHD domain, PHD2 also has an N-terminal, evolutionary-conserved, MYND-type zinc finger, a feature that is absent in both PHD1 and PHD3 (28, 29). The zinc finger of PHD2 is essential for efficient hydroxylation of HIF-1 (11, 28, 29). Supporting the essentiality of the zinc finger, we found that H2S persulfidates PHD2 at five different cysteine residues, two of which are within the zinc finger motif. Mutation of the zinc fin- ger cysteines, but not mutation of the other three, decreased the ability of PHD2 to associate with and to hydroxylate HIF-1. In this onOctober1,2020http://advances.sciencemag.org/Downloadedfrom
- 9. Dey et al., Sci. Adv. 2020; 6 : eaaz8534 3 July 2020 SCI ENCE ADVANCES | RESEARCH ARTICLE 9 of 14 Fig. 5. PHD2 is persulfidated by CBS and persulfidation of PHD2 at zinc finger domain maintains its activation. (A) Modified biotin switch assay for detecting per- sulfidation of PHD2 in untreated and NaHS-treated (1 mM) HUVEC and HAOECs. Dithiothreitol (DTT) treatment (1 mM) for 30 min reversed PHD2 persulfidation. (B) Modified biotin switch assay to determine the persulfidation status of PHD2 in si-Control and si-CBS–treated HUVEC and HAOECs after 48 hours transfections. (C) HUVEC and HAOEC were transfected with either scrambled (si-Control) or two PHD2 siRNA (si-PHD2_08 and si-PHD2_09) for 48 hours. Expression of PHD2 was determined by immunoblotting. -Actin was used as a loading control. (D) HUVECs were first transfected with either si-Control or si-PHD2 for 24 hours and further transfected with HA–empty vector (EV) or cDNAs encoding HA-PHD2 [wild type (WT), C21S (M1), C33S (M2), C127S (M3), C201S (M4), or C208S (M5)] for another 36 hours, and mRNA expression levels of PHD2 gene was determined. 18S rRNA was used as an internal control. si-Control–pretreated and EV-transfected mRNA levels were set to 1, and data are the means ± SD of three independent experiments performed in triplicate. *P < 0.05 when comparing between EV-treated groups in both si-Control or si-PHD2–pretreated group. (E) HUVECs were first transfected with si-PHD2 for 24 hours and further transfected with HA–empty vector (EV) or cDNAs encoding HA-PHD2 [WT, C21S (M1), C33S (M2), C127S (M3), C201S (M4), or C208S (M5)] for another 36 hours, and lysates from each treatment conditions were incubated with recombinant biotinylated HIF-1 peptide and further captured using streptavidin-conjugated magnetic beads. Next, these peptide-coated beads were incubated with in vitro–translated [35 S] pVHL and finally quantified by SDS-PAGE and autoradiography as a measurement PHD2 activity. (F) HUVEC cells were transfected with either si-Control, si-PHD2, or si-PHD2 along with reexpression of WT or mutant PHD2 constructs. Cellular lysates served as a source of PHD2 and were incubated with GST or GST–HIF-1 prebound to GSH-agarose for 2 hours at 4°C. Respective agarose pull-down were then subjected to immunoblotting for PHD2 and HIF-1, while cellular lysates served as input control for PHD2 and -actin. onOctober1,2020http://advances.sciencemag.org/Downloadedfrom
- 10. Dey et al., Sci. Adv. 2020; 6 : eaaz8534 3 July 2020 SCI ENCE ADVANCES | RESEARCH ARTICLE 10 of 14 context, two studies reported (11, 36) on the interaction of PHD2 with the ODD domain of HIF-1, and the latter suggested the in- volvement of HSP90 cochaperones. We find that full-length HIF-1 associates with PHD2 and our results do not exclude the possibility of cochaperone involvement. Another report (37) suggested that the monomeric form of PHD2 more efficiently hydroxylates HIF-1 compared to the disulfide bond–mediated homodimer that is formed in response to oxidative stress. In addition, several reports support that persulfide formation can result in increased nucleophilicity and reducing capability (38). Hence, persulfides likely participate in redox events and electrophilic signaling, possibly to a greater extent than the corresponding thiol (38). Together, increased PHD activity of PHD2 toward HIF-1, in the presence of CBS and/or H2S, could be due to a combination of increased association with HIF-1 faci litated by a more reduced and active state of PHD2. Inhibition of CBS in normoxic conditions elicits a pseudohypoxic response in ECs that is marked by stabilization of HIF-1/2. On the one hand, vascular endothelial growth factor (VEGF) and glycolytic enzymes are up-regulated, while on the other, VEGF receptor 2 (VEGFR2) and neuropilin 1, primary mediators of EC health, are down-regulated (2). HIF-1 and HIF-2 have unique transcriptional targets, for example, HIF-1 regulates glycolytic enzymes, and HIF-2 activates the stem cell factor oct4 among others (39); however, their common targets include the VEGF and adipose differentiation- related protein. Our results support that the regulation of HIF1- by PHD2 persulfidation plays a critical role in the vascular pheno- types observed in vitro and in vivo. However, similar regulation of HIF-2 by PHD2 persulfidation, and its possible contribution to vascular phenotypes is part of our future studies. CBS deficiency in humans causes cardiovascular disease, thromboembolism, and stroke, all of which are associated with endothelial dysfunction. Up-regulation of HIF-1 in ECs is also associated with venous thromboembolism, aneurysm, vascular malformations, atherosclerosis, and hypertension. Many of these pathophysiologies, including endothelial dysfunction and hypertension, are recapitulated in the CBS knockout mice (40). Together, these observations suggest that at least some of the CBS deficiency–associated phenotypes may result from the inhibition of PHD2 that stabilizes HIF in normoxic conditions. The pseudohypoxic response caused by HIF-1 stabilization in normoxic CBS-silenced ECs is reversed by H2S supplementation, either by chemical donors or by reexpression of CBS. Hypoxic stress manifested by decreased EC proliferation was also rescued by H2S supplementation, all of which support a cytoprotective role for CBS and H2S (41). Supporting our in vitro findings, CBS-silenced zebrafish embryos exhibited the same phenotypes observed during hypoxic signaling, including bent axis and abnormal ISVs (25); as expected, these phenotypes were reversed by supplementation with H2S. In conclusion, we describe a unique regulation of the PHD2- HIF-VHL axis by a metabolic enzyme CBS. Our work suggests that CBS-deficient pathologies may obviate HIF-1 stabilization, which can be ameliorated by H2S supplementation. MATERIALS AND METHODS Cell culture and reagents HUVECs (CC-2517) were purchased from Lonza (Basel, Switzerland) and cultured in complete endothelial basal medium (EBM) contain- ing an endothelial cell growth medium kit (CC-3125 from Lonza). Trypsin-EDTA (0.25%) and trypsin neutralizing solution were used for HUVEC subculture. HAOECs (PCS-100-011) were purchased from American Type Culture Collection (ATCC) (Manassas, VA, USA) and cultured in vascular cell basal medium (PCS-100-030 from ATCC) containing an endothelial cell growth kit BBE (PCS-100-040 from ATCC). Trypsin-EDTA for primary cells (PCS-999-003 from ATCC) and trypsin neutralizing solution (PCS-999-004 from ATCC) were used for HAOEC subculture. All experiments were performed Fig. 6. Schema of cystathione -synthase–mediated activation of HIF and PHD2 through persulfidation. PHD2 is targeted by H2S under normoxia to maintain its prolyl hydroxylation activity to degrade HIF-1 by VHL-mediated ubiquitin-proteasome pathway. Inhibition of CBS depletes endogenous H2S level and stabilizes HIF-1 by inhibiting PHD2 activity in normoxia. Mechanistically, PHD2 is persulfidated by CBS and persulfidation of PHD2 at zinc finger domain augments activation in normoxia. onOctober1,2020http://advances.sciencemag.org/Downloadedfrom
- 11. Dey et al., Sci. Adv. 2020; 6 : eaaz8534 3 July 2020 SCI ENCE ADVANCES | RESEARCH ARTICLE 11 of 14 only between passages 3 and 5. All the cells were cultured in a hu- midified atmosphere of 5% CO2 and 21% O2 for normoxia. For hy- poxic treatment, the cells were incubated in an InvivO2 400 Hypoxia Workstation chamber (RUSKINN, Bridgend, UK) at 37°C in a hu- midified atmosphere of 5% CO2 and 1% O2. DMOG, CoCl2, NaHS, P-(4-methoxyphenyl)-P-4-morpholinyl-phosphinodithioic acid (GYY4137), AOAA, DTT, and MG132 were obtained from Sigma- Aldrich (St. Louis, MO, USA). Biotinylated- HIF-1 19-mer peptide (HIF-1, 556 to 574) and FLAG-CBS-pcDNA3 (OHu26151) plasmid obtained from GenScript (Piscataway, NJ, USA). HA-PHD2-pcDNA3 was obtained from Addgene plasmid no. 18963. siRNA and plasmid transfection siRNA transfection in ECs was performed in 100-mm dishes with si-Control (scrambled control siRNA (no. 1027280), Qiagen, CA, USA),si-CBS(CBSsiRNAfromSigma-Aldrich;SASI_Hs01_00214623) or from Qiagen (SI02777159) mentioned as si-CBS(2nd) , si–HIF-1 (HIF-1 siRNA from Sigma-Aldrich; SASI_Hs02_00332063), si-VHL (VHLsiRNAfromSigma-Aldrich;SASI_Hs02_00302782),si-PHD2_08 (PHD2 siRNA from Sigma-Aldrich; SASI_Hs02_00355408), or si-PHD2_09 (PHD2 siRNA from Sigma-Aldrich; SASI_Hs02_ 00355409) using Oligofectamine (Invitrogen, Carlsbad, CA, USA). Briefly, ECs at 40 to 50% confluency were plated in collagen- coated 100-mm dishes and grown overnight in complete EBM me- dium. Before transfection, cells were washed once with OPTI-MEM I (Gibco, Waltham, MA, USA), and 3 ml of OPTI-MEM I was added and kept in CO2 incubator until addition of transfection mixture. Transfection mixture of Oligofectamine (25 l) and siRNA (25 l of 10 M) in 600 l of OPTI-MEM I was prepared as per the supplier’s protocol and added to cells, and after 6 to 7 hours, 6.5 ml of com- plete EBM was added to the plates. Subsequent analyses were car- ried out with si-PHD2_08 referred to as PHD2 siRNA. For plasmid transfection, ECs at 40 to 50% confluency were plated in collagen- coated 100-mm dishes and grown overnight in complete EBM me- dium. On the day of transfection, the cells were washed once with OPTI-MEM I, and 3 ml of OPTI-MEM I was added and kept in CO2 incubator until addition of transfection mixture. Transfection mixture was prepared with 40 l of Lipofectin (Invitrogen), 3 to 5 g of plasmid in 500 l of OPTI-MEM I following the manufacturer’s protocol. After addition of transfection mixture, HUVECs were kept for 4 to 5 hours in a CO2 incubator before adding 6.5 ml per plate of serum-supplemented EBM. Proliferation assays ECs were collected by trypsinization, counted and (5 × 10³ cells per well) seeded in collagen-coated 96-well plates, and treated them with either normoxia or hypoxia or DMOG or CoCl2. Similarly, si-Control or si-CBS–transfected ECs were collected 24 hours after transfec- tionm, (5 × 10³ cells per well) seeded in collagen-coated 96-well plates, and cultured for another 24 hours. Cell proliferation was de- termined using the CyQUANT Direct Cell Proliferation Assay Kit (Invitrogen, C35011) according to the manufacturer’s protocol, and fluorescence intensity was measured at excitation at 508 nm and emission detection at 527 nm using CLARIOstar (BMG Labtech, Ortenberg, Germany). In addition, BrdU incorporation assay was performed using the Cell Proliferation Enzyme-Linked Immuno- sorbent Assay BrdU Kit (Roche, Mannheim, Germany). ECs were collected by trypsinization, counted, and seeded in 96-well plates (5 × 10³ cells per well). Posttreatment cells were incubated with BrdU for 12 hours, fixed, and probed with antibody supplied in kit, and colorimetric signals were measured at 450 nm. All experiments were repeated at least three times in triplicate. Cell lysis, SDS-PAGE, and immunoblotting Cellular lysate was prepared in radioimmunoprecipitation assay (Boston BioProducts, Ashland, MA, USA), and protein concentra- tion was measured using the BCA (Bicinchoninic Acid) Assay Kit (Pierce, 23225). A standard protocol was used for immunoblotting. The cell lysates were separated on 10 or 12% glycine SDS-PAGE gel and transferred to polyvinylidene difluoride membrane (Bio-Rad). Membranes were blocked in 5% bovine serum albumin (BSA) in tris-buffered saline (TBS) with 0.1% Tween 20 (TBST from Boston Bioproducts) for 1 hour at room temperature. Primary antibodies were prepared in TBST with 5% BSA, and membranes were incubated in primary antibody at 4°C for overnight. Antibodies were purchased fromthefollowingvenders;HIF-1 fromBDBiosciences,SanJose,CA, USA(610959)andNovusBiologicals,Centennial,CO,USA(NB100-134); PHD2 (NB100-137), PHD1 (AF6394), and VHL (NB100-485) from Novus Biologicals; glyceraldehyde-3-phosphate dehydrogenase (GAPDH) (G9545) and 3MST (MABS1171) from Sigma-Aldrich; CSE from Proteintech, Chicago, IL, USA (12217-1-AP); hydroxy- HIF-1 (3434), CBS (14782), -actin (4970), and -tubulin (3873) from Cell Signaling Technology; and secondary antibodies conju- gated with horseradish peroxidase immunoglobulin G rabbit (A6154) and mouse (A4416) from Sigma-Aldrich. Primary antibodies were used in dilutions recommended by the manufacturer. Secondary antibodies were used at a concentration of 1:10,000. Tube formation assay Reduced growth factor Matrigel (BD Biosciences, San Jose, CA, USA) was thawed at 4°C overnight. Thereafter, Matrigel was diluted in 1:1 ratio with cold complete EBM medium, and 50 l of the diluted Matrigel was added per well of a 96-well plate and incubated at 37°C for 30 min. Forty-eight hours after transfection, HUVECs were trypsinized and counted, and 2 × 10⁴ cells in 100-l medium were plated onto Matrigel. Tube formation was captured after 6 hours from plating of cells. Images were acquired using Zeiss Apotome micro- scope (Carl Zeiss GmbH, Jena, Germany) in phase contrast mode. Endogenous H2S measurement H2S concentrations in ECs were measured using methylene blue assay as previously reported (2). Briefly, normoxia or hypoxia-treated or scrambled or si-CBS–treated ECs were collected in a total volume of 200 l of phosphate-buffered saline (PBS) (pH 7.4), and 100 l was then transferred directly into a tube containing zinc ace- tate [1% (w/v), 187.5 l] and NaOH (12%, 12.5 l) to trap the H2S for 20 min at room temperature. The rest of the cell suspension was used to estimate protein concentration by BCA Assay. The reaction was terminated by adding 1 ml of H2O (pH 12.8), 200 l of N,N- dimethyl-p-phenylenediamine sulfate (20 mM in 7.2 M HCl), and 200 l of FeCl3 (30 mM in 1.2 M HCl). The mixture was incubated in dark at room temperature for 15 min, and last, 600 l of the mixture was added to a tube with 150 l of trichloroacetic acid [10% (w/v)] to precipitate protein. The precipitated protein was re- moved by centrifugation at 10,000g for 5 min, and the absorbance at 670 nm of the resulting supernatant (200 l) was determined. The H2S concentration of each sample was calculated against a calibra- tion curve of NaHS. onOctober1,2020http://advances.sciencemag.org/Downloadedfrom
- 12. Dey et al., Sci. Adv. 2020; 6 : eaaz8534 3 July 2020 SCI ENCE ADVANCES | RESEARCH ARTICLE 12 of 14 RNA isolation and analysis of gene expression by quantitative reverse transcription polymerase chain reaction RNA extraction was performed using an RNeasy Plus Mini kit, Qiagen (CA, USA) following the manufacturer’s protocol. Reverse transcription (RT) reaction mix (20 l) was prepared with RT Kit [iScript complementary DNA (cDNA) Synthesis kit, Bio-Rad] using equal volume of random primers and oligo dT, and 2 g of isolated RNA. Real-time quantitative RT–polymerase chain reaction (qRT- PCR) analysis was carried out in a 10 l of reaction volume including 1 l of cDNA template (diluted 20 times). qRT-PCR was performed using iTaq SYBR Green (Bio-Rad) following suppliers’ protocols. The primers for human CBS (PPH13484B-200) were obtained from Qiagen. All other primers were purchased from IDT (Integrated DNA Technologies) (Coralville, IA, USA) as listed below. The comparative Ct method was used to calculate the relative abundance of the mRNA andcomparedwiththatof18SribosomalRNA(rRNA).VEGF(forward, 5′-AGGAGGAGGGCAGAATCATCA-3′; reverse, 5′-CTCGATTG- GATGGCAGTAGCT-3′),eNOS(forward,5′-GAAGGCTTTTGATC- CCCGGGTCCTG-3′; reverse, 5′-CAGTTCCTCCAGCCGTGTGTC- CAC-3), GLUT1 (forward, 5′-TTCACTGTCGTGTCGCTGTTT-3′; reverse, 5′ -AGCGCGATGGTCATGAGTAT-3′), HK1 (forward, 5′-CACCTGTGAGGTTGGACTCA-3′; reverse, 5′-CCACCATCTCCACGTTCTTC-3′), HK2 (forward, 5′-AAGCCCTTTCTCCATCTCCT-3′; reverse, 5′-CTTCTTCACGGAGCTCAACC-3′); PDK1 (forward, 5′-CTGTGATACGGATCAGAAACCG-3′; reverse, 5′-TCCACCAAACAATAAAGAGTGCT-3′), and 18S rRNA (forward, 5′-CTACCACATCCAAGGAAGCA-3′; reverse, 5′-TTTTTCGTCACTACCTCCCCG-3′). In vivo zebrafish study All zebrafish studies performed under the Institutional Animal Care and Use Committee (IACUC) protocol 320, which is approved by the Medical College of Wisconsin (MCW) Institutional Animal Care and Use Committee. Zebrafish maintenance and embryo stages were performed as per the protocols published before (25). The generation and characterization of the cbsb MO studies and cbsb CRISPR fish have already been described before by us (25). Zebrafish embryos dechorionated and protein lysates were prepared as described previ- ously (25). In this study, we used the cbsb CRISPR mutantline,which was generated in the Tg[flk:EGFP (enhanced green fluorescent pro- tein); CASPER] background line. Embryos from the Tg(flk:EGFP; cbsb CRISPR, CASPER) line were treated with GYY4137 (0.5 mM) or dimethyl sulfoxide at 6 hpf and were imaged (bright-field and fluo- rescence microscopy) at 52 hpf. Embryos from the background Tg(flk:EGFP; CASPER line) were used as additional controls. Scale barcalibrationwasperformedwithaLeicaMZFLIIImicroscopeusing a stage micrometer and Q-Capture Pro 7 software. Axis quantification was described in our previous publication (25). Embryos with abnormal ISV were identified as those which showed ISV (intersegmental vessel) patterns that did not follow the typical chevron-like somite structure and were irregularly spaced. A representative image is shown in Fig. 4. Three independent experimental clutches were evaluated, and n for each experimental sample/experiment trial ranged from 32 to 80. hif-1aa (5′-TTTTCCCAGGTGCGACTGCCTCCAT-3′) and hif-1ab (5′-ACCCTACAAAAGAAAGAAGGAGAGC-3′) MO se- quences (Gene Tools, Inc.), which were designed based on Gerri et al. (1). The sequence of the standard control MO used in this study is 5′-CCTCTTACCTCAGTTACAATTTATA-3′. As per Gene Tools, hif- 1aa MO is an ATG targeting MO that targets 5′ UTR, and hif-1ab MO targets the intron1/exon2 splice junction. Both MOs were referredto in Gerri et al. (1) as ATG-MOs. All injections were performed at 0.5 ng. Modified biotin switch assay This assay was carried out as described previously (42, 43). Briefly, cellswerehomogenizedinHEN(Hepes-EDTA-NaOH)buffer[250mM Hepes-NaOH (pH 7.7), 1 mM EDTA, and 0.1 mM neocuproine] supplemented with 100 M deferoxamine and centrifuged at 14,000 rpm for 30 min at 4°C to remove cell debris. Cell lysates (500 g) were added to blocking buffer [HEN buffer supplemented with 2.5% SDS and 20 mM methyl methanethiosulfonate (MMTS)] and incubated at 50°C for 20 min with frequent vortexing. MMTS was then removed after acetone precipitation of the proteins at −20°C for 20 min. After acetone removal, the precipitated proteins were washed twice with chilled acetone, and precipitated proteins were resuspended in HEN buffer supplemented with 1% SDS. To this suspension, 4 mM N-[6-(biotinamido)hexyl]-3′-(2′-pyridyldithio) propionamide in dimethylsulfoxide was added (final concentration of 0.8 mM) and incubated for 3 hours at 25°C. Last, biotinylated proteins were precipitated by streptavidin-agarose beads, which were then washed three times with HEN buffer supplemented with 1% SDS. As a negative control, biotinylated proteins bound to streptavidin-agarose beads were treated with 1 mM DTT for 30 min at room temperature and washed three times with HEN buffer sup- plemented with 1% SDS to remove unbound proteins. The biotinylated proteins and negative controls were eluted by 2× SDS-PAGE sam- ple buffer and subjected to immunoblotting. pVHL capture assay The pVHL assay was performed as described previously (22, 36). Briefly, after treatment, ECs were harvested in PBS, and the cell pellet was lysed in 20 mM tris (pH 7.6), 150 mM NaCl, 25 mM -glycerophosphate, 2 mM sodium pyrophosphate, 10% glycerol, 1% Triton X-100, and 1.4 mM -mercaptoethanol supplemented with 1 mM sodium orthovanadate, 1 mM phenylmethylsulfonyl fluoride, andleupeptin(10g/ml).Followingcentrifugationat13,000gfor 10 min at 4°C, the whole cell extracts were incubated with biotinylated syn- thetic HIF-1 peptides, at 37°C, in a reaction mix containing 50 mM tris (pH 7.5), BSA (2 mg/ml), 1 mM -ketoglutarate, 1 mM ascor- bate, 50 M FeCl2, and catalase (0.3 mg/ml). The reaction was stopped by dilution in ice-cold “stop buffer” [150 mM NaCl, 20 mM tris (pH 7.5), 0.5% Igepal, and 300 M desferrioxamine mesylate (DFO)]. The biotinylated peptide was captured using streptavidin-conjugated magnetic beads in “capture buffer” [150 mM NaCl, 20 mM tris (pH 7.5), 0.5% Igepal, and 100 M DFO] followed by washing. The peptide-coated beads were then incubated at 4°C with excess in vitro transcribed/translated[35 S]pVHL(TNTQuickCoupledTranscription/ Translation System from Promega) diluted in “capture buffer.” Fol- lowing two further washes, captured [35 S]pVHL was quantified by SDS-PAGE. The gels were exposed to an x-ray film, and bound [35 S] pVHL was detected by autoradiography. In vitro hydroxylation assay Purified HIF-1–ODD protein, (530 to 826 residues) was purchased from Abcam (ab48734). The HUVEC cells harboring either si-Control or si-CBS were incubated for 48 hours with or without GYY. These cellular extract was prepared from in 1 ml of reaction buffer (RB) [20 mM Hepes (pH 7.5), 5 mM KCl, and 1.5 mM MgCl2] followed onOctober1,2020http://advances.sciencemag.org/Downloadedfrom
- 13. Dey et al., Sci. Adv. 2020; 6 : eaaz8534 3 July 2020 SCI ENCE ADVANCES | RESEARCH ARTICLE 13 of 14 by two cycles of freeze/thaw in anethanol/dry ice bath. The lysates were passed eight times through a 21-gauge needle, followed by two passes through a 26-gauge needle before centrifugation (17,000g at 4°C for 30 min). The supernatants were aliquoted and stored at −80°C. The hydroxylation assay was performed by incubating 10 mM HIF-1–ODD with 25 l of HUVEC cell extract in RB for 15 min at 37°C. The reaction was stopped by addition of SDS loading buffer, and the proteins were separated by SDS-PAGE. Hydroxylation was measured using the HIF prolyl hydroxylation–specific antibody. DMOG, which inhibits the activity of PHD2, served as a negative control in this assay. Measurements of DMOG of HIF-1 hydroxylation were performed similarly, except that the lysate was preincubated with the compounds for 10 min at 37°C before the addition of the HIF-1–ODD protein. GST pulldown assay GST–HIF-1 (1 to 735 residues) was purchased from Novus Bio- logicals (H00003091-P01). GST or GST–HIF-1 is immobilized on glutathione-agarose beads by the Pierce GST Protein Interaction Pull-Down Kit. Next, GST or GST–HIF-1 prebound to GSH-agarose was incubated in buffer C [50 mM tris, (pH 7.5), 100 mM NaCl, and 0.5% Triton X-100] with rocking with HUVEC extracts for 2 hours at 4°C. The resins were washed three times, and eluates were sub- jected to SDS-PAGE and immunoblotting. Site-directed mutagenesis PHD2 mutant constructs were generated using the Q5 Site- Directed Mutagenesis Kit [no. E0554S, New England Biolabs (NEB), Ipswich, MA] following the manufacturer’s protocol. Briefly, the primers were designed with NEB online software NEBaseChanger. Primer sequences were as follows: C21S (forward, 5′-CCGG- CAGTACAGCGAGCTGTGCG-3′; reverse, 5′-TCTCGCTC- GCTCGGGCTC-3′), C33S (forward, 5′-CCTGCTGCGCAG- CAGCCGCTGCC-3′; reverse, 5′-TTCTCCATCTTCCCGCA CAGCTCGC-3′), C127S (forward, 5′- CGCGTCGCCGAGC- CGTGCGGCCG-3′; reverse, 5′-GCCGCCGCTGGGTCGG- CC-3′), C201S (forward: 5′-CATCGTGCCGAGCATGAA- CAAG-3′; reverse, 5′-TACTCGAGCGCCAGCTTC-3′), and C208S (forward, 5′-GCACGGCATCAGCGTGGTGGACG-3′; reverse, 5′- TTGTTCATGCACGGCACG-3′). Mutation was introduced to plasmid HA-PHD2-pcDNA3 by a 25-l 25-cycle PCR using the primers and a master mix formulation of Q5 Hot Start High-Fidelity DNA Polymerase. The circularization of PCR product and removal of the template DNA were done by 10 l of reaction with KLD (kinase, ligase and DpnI) enzyme mix provided in the kit. Half of the reaction was then used to transform NEB 5-alpha Competent Escherichia coli cells. Single bacterial colonies were picked and grown in 5 ml of LB (Luria-Bertani) medium (SKU 113002011-CF, MP Biomedicals, Santa Ana, CA). Plasmids were then isolated with ZR Plasmid Miniprep (D4015, Zymo Research, Tustin, CA) and sequenced to confirm the correct mutation. Data analysis and statistics All the experiments unless otherwise stated were repeated inde- pendently three times. Data are expressed as means ± SD. Analysis of variance (ANOVA) was performed to compare the mean among three or more groups and Student’s t test was performed to com- pare the mean between two groups. Statistical significance was set at P < 0.05 using GraphPad Prism 6 software. SUPPLEMENTARY MATERIALS Supplementary material for this article is available at http://advances.sciencemag.org/cgi/ content/full/6/27/eaaz8534/DC1 View/request a protocol for this paper from Bio-protocol. REFERENCES AND NOTES 1. B. D. Paul, S. H. Snyder, H2S: A novel gasotransmitter that signals by sulfhydration. Trends Biochem. Sci. 40, 687–700 (2015). 2. S. Saha, P. K. Chakraborty, X. Xiong, S. K. D. Dwivedi, S. B. Mustafi, N. R. Leigh, R. Ramchandran, P. Mukherjee, R. Bhattacharya, Cystathionine ‐synthase regulates endothelial function via protein S‐sulfhydration. FASEB J. 30, 441–456 (2016). 3. C. Szabo, C. Coletta, C. Chao, K. Módis, B. Szczesny, A. Papapetropoulos, M. R. Hellmich, Tumor-derived hydrogen sulfide, produced by cystathionine--synthase, stimulates bioenergetics, cell proliferation, and angiogenesis in colon cancer. Proc. Natl. Acad. Sci. U.S.A. 110, 12474–12479 (2013). 4. J. P. Kraus, M. Janošík, V. Kožich, R. Mandell, V. Shih, M. P. Sperandeo, G. Sebastio, R. de Franchis, G. Andria, L. A. J. Kluijtmans, H. Blom, G. H. J. Boers, R. B. Gordon, P. Kamoun, M. Y. Tsai, W. D. Kruger, H. G. Koch, T. Ohura, M. Gaustadnes, Cystathionine -synthase mutations in homocystinuria. Hum. Mutat. 13, 362–375 (1999). 5. A. A. Morris, V. Kožich, S. Santra, G. Andria, T. I. M. Ben-Omran, A. B. Chakrapani, E. Crushell, M. J. Henderson, M. Hochuli, M. Huemer, M. C. H. Janssen, F. Maillot, P. D. Mayne, J. M. Nulty, T. M. Morrison, H. Ogier, S. O’Sullivan, M. Pavlíková, I. T. de Almeida, A. Terry, S. Yap, H. J. Blom, K. A. Chapman, Guidelines for the diagnosis and management of cystathionine beta-synthase deficiency. J. Inherit. Metab. Dis. 40, 49–74 (2017). 6. P. Carmeliet, R. K. Jain, Molecular mechanisms and clinical applications of angiogenesis. Nature 473, 298–307 (2011). 7. G. L. Semenza, HIF-1 and human disease: One highly involved factor. Genes Dev. 14, 1983–1991 (2000). 8. A. Shilatifard, W. S. Lane, K. W. Jackson, R. C. Conaway, J. W. Conaway, An RNA polymerase II elongation factor encoded by the human ELL gene. Science 271, 1873–1876 (1996). 9. P. H. Maxwell, M. S. Wiesener, G.-W. Chang, S. C. Clifford, E. C. Vaux, M. E. Cockman, C. C. Wykoff, C. W. Pugh, E. R. Maher, P. J. Ratcliffe, The tumour suppressor protein VHL targets hypoxia-inducible factors for oxygen-dependent proteolysis. Nature 399, 271–275 (1999). 10. A. C. Epstein, J. M. Gleadle, L. A. McNeill, K. S. Hewitson, J. O’Rourke, D. R. Mole, M. Mukherji, E. Metzen, M. I. Wilson, A. Dhanda, Y. M. Tian, N. Masson, D. L. Hamilton, P. Jaakkola, R. Barstead, J. Hodgkin, P. H. Maxwell, C. W. Pugh, C. J. Schofield, P. J. Ratcliffe, C. elegans EGL-9 and mammalian homologs define a family of dioxygenases that regulate HIF by prolyl hydroxylation. Cell 107, 43–54 (2001). 11. D. Song, L.-S. Li, K. J. Heaton-Johnson, P. R. Arsenault, S. R. Master, F. S. Lee, Prolyl hydroxylase domain protein 2 (PHD2) binds a Pro-Xaa-Leu-Glu motif, linking it to the heat shock protein 90 pathway. J. Biol. Chem. 288, 9662–9674 (2013). 12. D. R. Mole, C. Blancher, R. R. Copley, P. J. Pollard, J. M. Gleadle, J. Ragoussis, P. J. Ratcliffe, Genome-wide association of hypoxia-inducible factor (HIF)-1 and HIF-2 DNA binding with expression profiling of hypoxia-inducible transcripts. J. Biol. Chem. 284, 16767–16775 (2009). 13. D. M. Stroka, T. Burkhardt, I. Desbaillets, R. H. Wenger, D. A. Neil, C. Bauer, M. Gassmann, D. Candinas, HIF-1 is expressed in normoxic tissue and displays an organ-specific regulation under systemic hypoxia. FASEB J. 15, 2445–2453 (2001). 14. A. Görlach, I. Diebold, V. B. Schini-Kerth, U. Berchner-Pfannschmidt, U. Roth, R. P. Brandes, T. Kietzmann, R. Busse, Thrombin activates the hypoxia-inducible factor-1 signaling pathway in vascular smooth muscle cells: Role of the p22phox -containing NADPH oxidase. Circ. Res. 89, 47–54 (2001). 15. T. Hellwig-Bürgel, K. Rutkowski, E. Metzen, J. Fandrey, W. Jelkmann, Interleukin-1 and tumor necrosis factor- stimulate DNA binding of hypoxia-inducible factor-1. Blood 94, 1561–1567 (1999). 16. D. E. Richard, E. Berra, J. Pouysségur, Nonhypoxic pathway mediates the induction of hypoxia-inducible factor 1alpha (HIF-1) in vascular smooth muscle cells. J. Biol. Chem. 275, 26765–26771 (2000). 17. D. P. Stiehl, W. Jelkmann, R. H. Wenger, T. Hellwig-Bürgel, Normoxic induction of the hypoxia-inducible factor 1 by insulin and interleukin-1 involves the phosphatidylinositol 3-kinase pathway. FEBS Lett. 512, 157–162 (2002). 18. H. J. Marti, M. Bernaudin, A. Bellail, H. Schoch, M. Euler, E. Petit, W. Risau, Hypoxia-induced vascular endothelial growth factor expression precedes neovascularization after cerebral ischemia. Am. J. Pathol. 156, 965–976 (2000). 19. K. Shoji, T. Tanaka, M. Nangaku, Role of hypoxia in progressive chronic kidney disease and implications for therapy. Curr. Opin. Nephrol. Hypertens. 23, 161–168 (2014). 20. D. A. Chan, T. L. A. Kawahara, P. D. Sutphin, H. Y. Chang, J.-T. Chi, A. J. Giaccia, Tumor vasculature is regulated by PHD2-mediated angiogenesis and bone marrow-derived cell recruitment. Cancer Cell 15, 527–538 (2009). onOctober1,2020http://advances.sciencemag.org/Downloadedfrom
- 14. Dey et al., Sci. Adv. 2020; 6 : eaaz8534 3 July 2020 SCI ENCE ADVANCES | RESEARCH ARTICLE 14 of 14 21. J. Folkman, C. Haudenschild, Angiogenesis in vitro. Nature 288, 551–556 (1980). 22. J. R. Tuckerman, Y. Zhao, K. S. Hewitson, Y.-M. Tian, C. W. Pugh, P. J. Ratcliffe, D. R. Mole, Determination and comparison of specific activity of the HIF-prolyl hydroxylases. FEBS Lett. 576, 145–150 (2004). 23. S. P. Burr, A. S. H. Costa, G. L. Grice, R. T. Timms, I. T. Lobb, P. Freisinger, R. B. Dodd, G. Dougan, P. J. Lehner, C. Frezza, J. A. Nathan, Mitochondrial protein lipoylation and the 2-oxoglutarate dehydrogenase complex controls HIF1 stability in aerobic conditions. Cell Metab. 24, 740–752 (2016). 24. K. J. Briggs, P. Koivunen, S. Cao, K. M. Backus, B. A. Olenchock, H. Patel, Q. Zhang, S. Signoretti, G. J. Gerfen, A. L. Richardson, A. K. Witkiewicz, B. F. Cravatt, J. Clardy, W. G. Kaelin Jr., Paracrine induction of HIF by glutamate in breast cancer: EglN1 senses cysteine. Cell 166, 126–139 (2016). 25. S. Prabhudesai, C. Koceja, A. Dey, S. Eisa-Beygi, N. R. Leigh, R. Bhattacharya, P. Mukherjee, R. Ramchandran, Cystathionine -synthase is necessary for axis development in vivo. Front. Cell Dev. Biol. 6, 14 (2018). 26. C. Gerri, R. Marín-Juez, M. Marass, A. Marks, H.-M. Maischein, D. Y. R. Stainier, Hif-1 regulates macrophage-endothelial interactions during blood vessel development in zebrafish. Nat. Commun. 8, 15492 (2017). 27. S. Wang, H. Zeng, S. T. Chen, L. Zhou, X.-J. Xie, X. He, Y.-K. Tao, Q.-H. Tuo, C. Deng, D.-F. Liao, J.-X. Chen, Ablation of endothelial prolyl hydroxylase domain protein-2 promotes renal vascular remodelling and fibrosis in mice. J. Cell. Mol. Med. 21, 1967–1978 (2017). 28. P. R. Arsenault, D. Song, M. Bergkamp, A. M. Ravaschiere, B. E. Navalsky, P. M. Lieberman, F. S. Lee, Identification of small-molecule PHD2 zinc finger inhibitors that activate hypoxia inducible factor. Chembiochem 17, 2316–2323 (2016). 29. M. Sinnema, D. Song, W. Guan, J. W. H. Janssen, R. van Wijk, B. E. Navalsky, K. Peng, A. E. Donker, A. P. A. Stegmann, F. S. Lee, Loss-of-function zinc finger mutation in the EGLN1 gene associated with erythrocytosis. Blood 132, 1455–1458 (2018). 30. G. L. Semenza, Hypoxia-inducible factor 1 and cardiovascular disease. Annu. Rev. Physiol. 76, 39–56 (2014). 31. W. G. Kaelin Jr., P. J. Ratcliffe, Oxygen sensing by metazoans: The central role of the HIF hydroxylase pathway. Mol. Cell 30, 393–402 (2008). 32. G. L. Semenza, HIF-1 mediates metabolic responses to intratumoral hypoxia and oncogenic mutations. J. Clin. Invest. 123, 3664–3671 (2013). 33. J. I. Sbodio, S. H. Snyder, B. D. Paul, Regulators of the transsulfuration pathway. Br. J. Pharmacol. 176, 583–593 (2019). 34. R. J. Appelhoff, Y.-M. Tian, R. R. Raval, H. Turley, A. L. Harris, C. W. Pugh, P. J. Ratcliffe, J. M. Gleadle, Differential function of the prolyl hydroxylases PHD1, PHD2, and PHD3 in the regulation of hypoxia-inducible factor. J. Biol. Chem. 279, 38458–38465 (2004). 35. E. Berra, E. Benizri, A. Ginouvès, V. Volmat, D. Roux, J. Pouysségur, HIF prolyl-hydroxylase 2 is the key oxygen sensor setting low steady-state levels of HIF-1 in normoxia. EMBO J. 22, 4082–4090 (2003). 36. J. Huang, Q. Zhao, S. M. Mooney, F. S. Lee, Sequence determinants in hypoxia-inducible factor-1 for hydroxylation by the prolyl hydroxylases PHD1, PHD2, and PHD3. J. Biol. Chem. 277, 39792–39800 (2002). 37. G. Lee, H.-S. Won, Y.-M. Lee, J.-W. Choi, T.-I. Oh, J.-H. Jang, D.-K. Choi, B.-O. Lim, Y. J. Kim, J.-W. Park, P. Puigserver, J.-H. Lim, Oxidative dimerization of PHD2 is responsible for its inactivation and contributes to metabolic reprogramming via HIF-1 activation. Sci. Rep. 6, 18928 (2016). 38. R. Millikin, C. L. Bianco, C. White, S. S. Saund, S. Henriquez, V. Sosa, T. Akaike, Y. Kumagai, S. Soeda, J. P. Toscano, J. Lin, J. M. Fukuto, The chemical biology of protein hydropersulfides: Studies of a possible protective function of biological hydropersulfide generation. Free Radic. Biol. Med. 97, 136–147 (2016). 39. K. L. Covello, J. Kehler, H. Yu, J. D. Gordan, A. M. Arsham, C.-J. Hu, P. A. Labosky, M. C. Simon, B. Keith, HIF-2 regulates Oct-4: Effects of hypoxia on stem cell function, embryonic development, and tumor growth. Genes Dev. 20, 557–570 (2006). 40. H. Wang, X. Jiang, F. Yang, J. W. Gaubatz, L. Ma, M. J. Magera, X. F. Yang, P. B. Berger, W. Durante, H. J. Pownall, A. I. Schafer, Hyperhomocysteinemia accelerates atherosclerosis in cystathionine beta-synthase and apolipoprotein E double knock-out mice with and without dietary perturbation. Blood 101, 3901–3907 (2003). 41. B. Wu, H. Teng, G. Yang, L. Wu, R. Wang, Hydrogen sulfide inhibits the translational expression of hypoxia-inducible factor-1. Br. J. Pharmacol. 167, 1492–1505 (2012). 42. A. K. Mustafa, M. M. Gadalla, N. Sen, S. Kim, W. Mu, S. K. Gazi, R. K. Barrow, G. Yang, R. Wang, S. H. Snyder, H2S signals through protein S-sulfhydration. Sci. Signal. 2, ra72 (2009). 43. B. D. Paul, S. H. Snyder, Protein sulfhydration. Methods Enzymol. 555, 79–90 (2015). Acknowledgments: We thank the Laboratory for Molecular Biology and Cytometry Research at OUHSC for the use of the core facility, which provided mass spectrometry facility. Funding: This work was supported by NIH grants 1R01 CA220237-01A1, 2CA136494, CA213278 (to P.M.), CA157481 (to R.B.), and 1R01HL120585 (to both P.M. and R.B.). Author contributions: Conception and design: A.D., P.M., and R.B. Development of methodology: A.D., S.P., Y.Z., K.T., G.R., S.K.D.D., and R.R. Acquisition of data: A.D., S.P., Y.Z., K.T., and G.R. Analysis and interpretation of data: A.D., S.P., Y.Z., R.R., P.M., and R.B. Writing, review, and/or revision of the manuscript: A.D., P.M., and R.B. Administrative, technical, or material support: A.D., M.N.H., R.R., P.M., and R.B. Study supervision: P.M. and R.B. Competing interests: The authors declare that they have no competing interests. Data and materials availability: All data needed to evaluate the conclusions in the paper are present in the paper and/or the Supplementary Materials. Additional data related to this paper may be requested from the authors. Submitted 16 October 2019 Accepted 20 May 2020 Published 3 July 2020 10.1126/sciadv.aaz8534 Citation: A. Dey, S. Prabhudesai, Y. Zhang, G. Rao, K. Thirugnanam, M. N. Hossen, S. K. D. Dwivedi, R. Ramchandran, P. Mukherjee, R. Bhattacharya, Cystathione -synthase regulates HIF-1 stability through persulfidation of PHD2. Sci. Adv. 6, eaaz8534 (2020). onOctober1,2020http://advances.sciencemag.org/Downloadedfrom
- 15. stability through persulfidation of PHD2α-synthase regulates HIF-1βCystathione Kumar Dhar Dwivedi, Ramani Ramchandran, Priyabrata Mukherjee and Resham Bhattacharya Anindya Dey, Shubhangi Prabhudesai, Yushan Zhang, Geeta Rao, Karthikeyan Thirugnanam, Md. Nazir Hossen, Shailendra DOI: 10.1126/sciadv.aaz8534 (27), eaaz8534.6Sci Adv ARTICLE TOOLS http://advances.sciencemag.org/content/6/27/eaaz8534 MATERIALS SUPPLEMENTARY http://advances.sciencemag.org/content/suppl/2020/06/29/6.27.eaaz8534.DC1 REFERENCES http://advances.sciencemag.org/content/6/27/eaaz8534#BIBL This article cites 43 articles, 15 of which you can access for free PERMISSIONS http://www.sciencemag.org/help/reprints-and-permissions Terms of ServiceUse of this article is subject to the is a registered trademark of AAAS.Science AdvancesYork Avenue NW, Washington, DC 20005. The title (ISSN 2375-2548) is published by the American Association for the Advancement of Science, 1200 NewScience Advances License 4.0 (CC BY-NC). Science. No claim to original U.S. Government Works. Distributed under a Creative Commons Attribution NonCommercial Copyright © 2020 The Authors, some rights reserved; exclusive licensee American Association for the Advancement of onOctober1,2020http://advances.sciencemag.org/Downloadedfrom