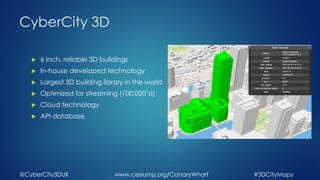
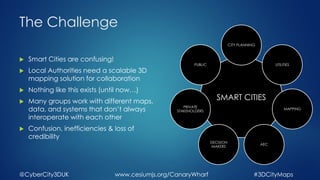
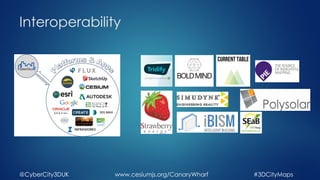
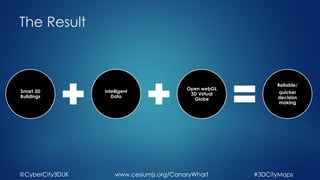
Esri CityEngine & Minecraft: Engaging Citizens in 3D City PlanningErin Lemky
Researchers at VU, Amsterdam are leveraging Esri CityEngine and Minecraft to increase citizen engagement in neighborhood design & planning. Inspired by UN-Habitat’s Block by Block, the project combines 2D & 3D datasets to create a 3D model in CityEngine. This GIS output becomes a canvas of the city in Minecraft, offering a gaming-style geodesign tool that citizens and their children can interact with. This presentation will explore how 2D data can be leveraged in 3D with Esri CityEngine.
Presentation 'about the (very nearby) future of GIS' for GeoScience students, Universiteit Utrecht. I had a few recommended skill and recommendations as well, will blog about that later.
Painel SBRC 2018 - Smart Cities: Tendências e DesafiosKiev Gama
Slides de minha participação no painel do Simpósio Brasileiro de Redes de Computadores - 2018.
Smart Cities: Tendências e Desafios
Moderadora: Thais Vasconcelos Batista (UFRN)
Participantes:
Vinícius Garcia (CPqD)
Alexandre Nogueira (Ericsson)
Daniel Batista (USP)
Kiev Gama (UFPE)
Understanding cities using ViziCities and 3D data visualisationRobin Hawkes
ViziCities is an open-source 3D city visualisation platform powered by OpenStreetMap, WebGL and many other cutting-edge Web technologies. ViziCities not only allows you to explore any city in the world in 3D in your browser, it also lets you overlay data like live transport, crime, pollution, live social data, and weather. Think SimCity meets the real world!
In this talk, Robin Hawkes, ViziCities' co-creator and Lead Developer will introduce you to the project and demonstrate its powerful methods for visualising the complex data locked within our cities.
Create Minecraft Worlds with ArcGIS and the Data Interoperability ExtensionSafe Software
GIS professionals are experiencing excellent results combining GIS and gaming worlds such as Minecraft to engage wider and younger audiences to solve real problems. City planning, crisis management (floods, fires, etc.) and other tasks become fun and accessible to the public. Attendees will discover how to move IFC, Revit, CityEngine, and all kinds of other data through ArcGIS and into Minecraft using the ArcGIS Data Interoperability Extension. Implemented customer examples will be presented alongside strategies and tips, equipping attendees to implement these skills themselves.
The Future of Maps for Mobility / Geography2050Janine Yoong
While high-resolution satellite imagery is the foundation of digital mapping, the demands of urban mobility require highly accurate, frequently updated data from a different vantage point – the ground. Recent advances in street-level imagery collection and data extraction are lifting up new trends in location-based services, smart cities, and autonomous vehicles. As map technologists push the boundaries of machine intelligence for extracting data from images, human collaboration will drive the creation of maps for mobility for all.
This presentation was condcuted at the Land Information Council of Jamaica (LICJ) annual GIS Business Executive Forum. It aspired to demonstrate in five (5) minutes how Geospatial technologies can play a pivotal role in designing and delivering smarter cities
By Michael Thatcher, Keystone Accountability. Presented at Crowdsourcing Week Global 2015. Learn more and join us at our next event: www.crowdsourcingweek.com
A Startup Pitch from the Main Stage at AWE Tel Aviv 2018 - the World's #1 XR Conference & Expo in Tel Aviv, Israel, November 5, 2018.
http://AugmentedWorldExpo.com
Reviewing examples of planned Smart Cities in the US. Explaining the four levels /types of Smart Cities. Offering some key realizations pertaining to Smart Cities.
Smallworld and Google: the best of both worldsPeter Batty
My presentation at the Smallworld User Conference in Baltimore, talking about the benefits of combining the strengths of Smallworld and Google Maps (the work we are doing with Ubisense myWorld).
This presentation looks at what 'The Age of the Platform' means for smart city policy challenges and opportunities. Presented as a Keynote Address a the Media Architecture Biennale held as part of Sydney's Vivid Festival in June 2016.
cf. city flows - A comparative visualization of bike sharing systemsTill Nagel
cf. city flows is a comparative visualization environment of urban bike mobility designed to help citizens casually analyze three bike-sharing systems in the context of a public exhibition space.
By Till Nagel and Christopher Pietsch.
Urban Complexity Lab, FH Potsdam
<a>http://uclab.fh-potsdam.de/</a>
This talk introduces the project and some of its goals and visualizations, and shows our design process in analyzing the data and designing the visualizations.
cf. city flows was exhibited at the Streams and Traces in November 2015 in Berlin. Find more information at http://streamsandtraces.com/
More information coming soon.
Ecological Analysis & Visualisation using GIS to Inform Planning for Large In...Comit Projects Ltd
Presentation by Katie McCausland (Costain & Reading University) at COMIT 2016: Digitally Building Britain, September 2016
More information: http://www.comit.org.uk/liveblog
Visualisation for the AEC Sector: Past, Present and Tomorrow… #COMIT2016Comit Projects Ltd
Presentation by Dr Max Mallia-Parfitt (COINS:FULCRO & Crossrail) at COMIT 2016: Digitally Building Britain, September 2016
More information: http://www.comit.org.uk/liveblog
Do fun activities with Adobe Photoshop.
Refer this link for making posters in Photoshop:
http://www.slideshare.net/HarshalGunwant/creating-a-poster-in-adobe-photoshop
Visualisation of Complex 3D City Models on Mobile Webbrowsers Using Cloud-bas...Martin Christen
Talk at Geospatial Week 2015 in La Grande Motte (near Montpellier), France. The paper is available at: http://www.isprs-ann-photogramm-remote-sens-spatial-inf-sci.net/II-3-W5/517/2015/isprsannals-II-3-W5-517-2015.pdf
8 Big Mistakes digital marketers should avoid in 2017Smart Insights
A presentation from the Smart Insights Digital Marketing Priorities 2017 Summit webinar by Ray Coppinger, Senior Digital Marketing Team, EMEA at Marketo.
Drones and their Increasing Number of ApplicationsJeffrey Funk
These slides use concepts from my (Jeff Funk) course entitled analyzing hi-tech opportunities to analyze how drones are becoming economic feasible for an increasing number of applications as their costs fall. The costs of drones are falling as the costs of various ICs (controllers, GPS) and MEMS sensors rapidly fall, their performance rises (e.g., accuracy of GPS) and as the cost of carbon fibers fall at a somewhat slower pace than do ICs and MEMS. These falling costs are making drones economically feasible for a number of applications such as producing movies, TV reporting, surveillance, and delivery.
Zinnov Management Consulting takes a look at the potential for evolution of smart cities in the Indian geography trough the lens of critical parameters.
The Great State of Design with CSS Grid Layout and FriendsStacy Kvernmo
For far too long we've been forced to reuse layout patterns that have worked in the past, creating a web full of sites that all look the same. Narrow timelines, browser support restrictions and lack of a true grid system have led us to create work that is "good enough".
I've spent years exploring how we can make the web a more unique space. With some of the newer CSS techniques available, we can start to make more creative designs. CSS Grid Layout is on the horizon and will play a major role in the design of our sites. Finally having a true, 2 dimensional grid will give our layouts much more flexibility and it is on us to explore the possibilities.
This talk was presented at CSS Day 2016.
As a leader, you spend a lot of your time making sure that your team is working well together. Here are the secrets that every manager should know to make your team successful.
Subscribe to our free 11-day email course on HOW TO BE A BETTER LEADER:
http://officevi.be/29Sx4bK
Read more on employee engagement on Officevibe blog:
https://www.officevibe.com/blog
When cities begin to think - What happens when buildings talk back?Bruce Duyshart
Presentation for UDIA National Congress 2014.
Imagine a world where the emerging 'Internet of Things' intersects with smart buildings and cities. Today, developers are faced with the rising expectations of people to be better connected and more efficient in their use of technology, yet buildings still remain one of the last bastions for technological change in our modern society. This insightful presentation will shine a torch on a world of possibilities in the use of technology in property and will highlight what lies ahead for those that are prepared to innovate and make a change.
How disruptive technologies are reshaping the future of citiesSaeed Al Dhaheri
This keynote presentation was delivered at the Arab ICT Forum 2018 in Bhrain. The presentation highlights the role of disruptive technologies in reshaping the future of our cities. main focus is on Arab cities. Examples of how new technologies are changing our cities are highlighted.
Show&Tell Fast Forward Talk: Bill WilkinsSandbox ATL
Show&Tell is Tech Square's quarterly science fair-style demo day, which focuses on a different emerging technology each time. October's theme was BuiltTech, which includes technologies shaping the built environment. This $217 trillion sector is what shapes the future of planning, design, construction, and management of buildings, infrastructure, and cities.
Understanding cities using ViziCities and 3D data visualisationRobin Hawkes
ViziCities is an open-source 3D city visualisation platform powered by open data, WebGL and many other cutting-edge Web technologies. ViziCities not only allows you to explore any city in the world in 3D in your browser, it also lets you overlay data like live transport, crime, pollution, live social data, and weather. Think SimCity meets the real world!
In this talk, Robin Hawkes, ViziCities’ founder will introduce you to the project and demonstrate its powerful methods for visualising the complex data locked within our cities.
Smart cities or smart citizens : which is the future?Naba Barkakati
A brief talk on smart cities or smart citizens, which is the future?
For more see http://nbtmv.blogspot.com/2016/03/smart-cities-or-smart-citizens-which-is.html
GDG Cloud Southlake #33: Boule & Rebala: Effective AppSec in SDLC using Deplo...James Anderson
Effective Application Security in Software Delivery lifecycle using Deployment Firewall and DBOM
The modern software delivery process (or the CI/CD process) includes many tools, distributed teams, open-source code, and cloud platforms. Constant focus on speed to release software to market, along with the traditional slow and manual security checks has caused gaps in continuous security as an important piece in the software supply chain. Today organizations feel more susceptible to external and internal cyber threats due to the vast attack surface in their applications supply chain and the lack of end-to-end governance and risk management.
The software team must secure its software delivery process to avoid vulnerability and security breaches. This needs to be achieved with existing tool chains and without extensive rework of the delivery processes. This talk will present strategies and techniques for providing visibility into the true risk of the existing vulnerabilities, preventing the introduction of security issues in the software, resolving vulnerabilities in production environments quickly, and capturing the deployment bill of materials (DBOM).
Speakers:
Bob Boule
Robert Boule is a technology enthusiast with PASSION for technology and making things work along with a knack for helping others understand how things work. He comes with around 20 years of solution engineering experience in application security, software continuous delivery, and SaaS platforms. He is known for his dynamic presentations in CI/CD and application security integrated in software delivery lifecycle.
Gopinath Rebala
Gopinath Rebala is the CTO of OpsMx, where he has overall responsibility for the machine learning and data processing architectures for Secure Software Delivery. Gopi also has a strong connection with our customers, leading design and architecture for strategic implementations. Gopi is a frequent speaker and well-known leader in continuous delivery and integrating security into software delivery.
Epistemic Interaction - tuning interfaces to provide information for AI supportAlan Dix
Paper presented at SYNERGY workshop at AVI 2024, Genoa, Italy. 3rd June 2024
https://alandix.com/academic/papers/synergy2024-epistemic/
As machine learning integrates deeper into human-computer interactions, the concept of epistemic interaction emerges, aiming to refine these interactions to enhance system adaptability. This approach encourages minor, intentional adjustments in user behaviour to enrich the data available for system learning. This paper introduces epistemic interaction within the context of human-system communication, illustrating how deliberate interaction design can improve system understanding and adaptation. Through concrete examples, we demonstrate the potential of epistemic interaction to significantly advance human-computer interaction by leveraging intuitive human communication strategies to inform system design and functionality, offering a novel pathway for enriching user-system engagements.
Software Delivery At the Speed of AI: Inflectra Invests In AI-Powered QualityInflectra
In this insightful webinar, Inflectra explores how artificial intelligence (AI) is transforming software development and testing. Discover how AI-powered tools are revolutionizing every stage of the software development lifecycle (SDLC), from design and prototyping to testing, deployment, and monitoring.
Learn about:
• The Future of Testing: How AI is shifting testing towards verification, analysis, and higher-level skills, while reducing repetitive tasks.
• Test Automation: How AI-powered test case generation, optimization, and self-healing tests are making testing more efficient and effective.
• Visual Testing: Explore the emerging capabilities of AI in visual testing and how it's set to revolutionize UI verification.
• Inflectra's AI Solutions: See demonstrations of Inflectra's cutting-edge AI tools like the ChatGPT plugin and Azure Open AI platform, designed to streamline your testing process.
Whether you're a developer, tester, or QA professional, this webinar will give you valuable insights into how AI is shaping the future of software delivery.
Neuro-symbolic is not enough, we need neuro-*semantic*Frank van Harmelen
Neuro-symbolic (NeSy) AI is on the rise. However, simply machine learning on just any symbolic structure is not sufficient to really harvest the gains of NeSy. These will only be gained when the symbolic structures have an actual semantics. I give an operational definition of semantics as “predictable inference”.
All of this illustrated with link prediction over knowledge graphs, but the argument is general.
JMeter webinar - integration with InfluxDB and GrafanaRTTS
Watch this recorded webinar about real-time monitoring of application performance. See how to integrate Apache JMeter, the open-source leader in performance testing, with InfluxDB, the open-source time-series database, and Grafana, the open-source analytics and visualization application.
In this webinar, we will review the benefits of leveraging InfluxDB and Grafana when executing load tests and demonstrate how these tools are used to visualize performance metrics.
Length: 30 minutes
Session Overview
-------------------------------------------
During this webinar, we will cover the following topics while demonstrating the integrations of JMeter, InfluxDB and Grafana:
- What out-of-the-box solutions are available for real-time monitoring JMeter tests?
- What are the benefits of integrating InfluxDB and Grafana into the load testing stack?
- Which features are provided by Grafana?
- Demonstration of InfluxDB and Grafana using a practice web application
To view the webinar recording, go to:
https://www.rttsweb.com/jmeter-integration-webinar
Essentials of Automations: Optimizing FME Workflows with ParametersSafe Software
Are you looking to streamline your workflows and boost your projects’ efficiency? Do you find yourself searching for ways to add flexibility and control over your FME workflows? If so, you’re in the right place.
Join us for an insightful dive into the world of FME parameters, a critical element in optimizing workflow efficiency. This webinar marks the beginning of our three-part “Essentials of Automation” series. This first webinar is designed to equip you with the knowledge and skills to utilize parameters effectively: enhancing the flexibility, maintainability, and user control of your FME projects.
Here’s what you’ll gain:
- Essentials of FME Parameters: Understand the pivotal role of parameters, including Reader/Writer, Transformer, User, and FME Flow categories. Discover how they are the key to unlocking automation and optimization within your workflows.
- Practical Applications in FME Form: Delve into key user parameter types including choice, connections, and file URLs. Allow users to control how a workflow runs, making your workflows more reusable. Learn to import values and deliver the best user experience for your workflows while enhancing accuracy.
- Optimization Strategies in FME Flow: Explore the creation and strategic deployment of parameters in FME Flow, including the use of deployment and geometry parameters, to maximize workflow efficiency.
- Pro Tips for Success: Gain insights on parameterizing connections and leveraging new features like Conditional Visibility for clarity and simplicity.
We’ll wrap up with a glimpse into future webinars, followed by a Q&A session to address your specific questions surrounding this topic.
Don’t miss this opportunity to elevate your FME expertise and drive your projects to new heights of efficiency.
The Art of the Pitch: WordPress Relationships and SalesLaura Byrne
Clients don’t know what they don’t know. What web solutions are right for them? How does WordPress come into the picture? How do you make sure you understand scope and timeline? What do you do if sometime changes?
All these questions and more will be explored as we talk about matching clients’ needs with what your agency offers without pulling teeth or pulling your hair out. Practical tips, and strategies for successful relationship building that leads to closing the deal.
State of ICS and IoT Cyber Threat Landscape Report 2024 previewPrayukth K V
The IoT and OT threat landscape report has been prepared by the Threat Research Team at Sectrio using data from Sectrio, cyber threat intelligence farming facilities spread across over 85 cities around the world. In addition, Sectrio also runs AI-based advanced threat and payload engagement facilities that serve as sinks to attract and engage sophisticated threat actors, and newer malware including new variants and latent threats that are at an earlier stage of development.
The latest edition of the OT/ICS and IoT security Threat Landscape Report 2024 also covers:
State of global ICS asset and network exposure
Sectoral targets and attacks as well as the cost of ransom
Global APT activity, AI usage, actor and tactic profiles, and implications
Rise in volumes of AI-powered cyberattacks
Major cyber events in 2024
Malware and malicious payload trends
Cyberattack types and targets
Vulnerability exploit attempts on CVEs
Attacks on counties – USA
Expansion of bot farms – how, where, and why
In-depth analysis of the cyber threat landscape across North America, South America, Europe, APAC, and the Middle East
Why are attacks on smart factories rising?
Cyber risk predictions
Axis of attacks – Europe
Systemic attacks in the Middle East
Download the full report from here:
https://sectrio.com/resources/ot-threat-landscape-reports/sectrio-releases-ot-ics-and-iot-security-threat-landscape-report-2024/
Kubernetes & AI - Beauty and the Beast !?! @KCD Istanbul 2024Tobias Schneck
As AI technology is pushing into IT I was wondering myself, as an “infrastructure container kubernetes guy”, how get this fancy AI technology get managed from an infrastructure operational view? Is it possible to apply our lovely cloud native principals as well? What benefit’s both technologies could bring to each other?
Let me take this questions and provide you a short journey through existing deployment models and use cases for AI software. On practical examples, we discuss what cloud/on-premise strategy we may need for applying it to our own infrastructure to get it to work from an enterprise perspective. I want to give an overview about infrastructure requirements and technologies, what could be beneficial or limiting your AI use cases in an enterprise environment. An interactive Demo will give you some insides, what approaches I got already working for real.
Unsubscribed: Combat Subscription Fatigue With a Membership Mentality by Head...
CyberCity 3D Global Smart Cities Showcase
1. CyberCity 3D Global Ltd
3D CITY MAPS FOR SMART CITIES
TIM HUGHES
@CYBERCITY3DUK
#3DCITYMAPS
WWW.CESIUMJS.ORG/CANARYWHARF
2. CyberCity 3D
6 inch, reliable 3D buildings
In-house developed technology
Largest 3D building library in the world
Optimized for streaming (100,000’s!)
Cloud technology
API database
@CyberCity3DUK #3DCityMapswww.cesiumjs.org/CanaryWharf
3. The Challenge
Smart Cities are confusing!
Local Authorities need a scalable 3D
mapping solution for collaboration
Nothing like this exists (until now…)
Many groups work with different maps,
data, and systems that don’t always
interoperate with each other
Confusion, inefficiencies & loss of
credibility
@CyberCity3DUK #3DCityMapswww.cesiumjs.org/CanaryWharf
SMART CITIES
CITY PLANNING
UTILITIES
MAPPING
AEC
DECISION
MAKERS
PRIVATE
STAKEHOLDERS
PUBLIC
4. 3D City Map
Smart 3D Buildings
Intelligent data layers
Open Architecture 3D
Globe
Simple to use, familiar
Engaging
@CyberCity3DUK #3DCityMapswww.cesiumjs.org/CanaryWharf