Downloaded 117 times


![Faculty of Science and Engineering
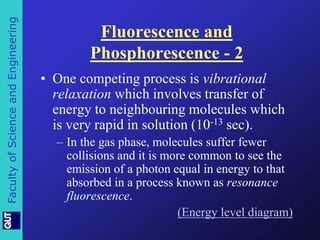
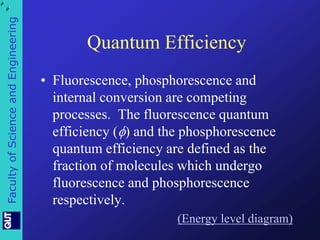
APPLICATIONS
A. Determination of polyaromatic hydrocarbons
– Benzo[a]pyrene is a product of incomplete
combustion and found in coal tar.](https://image.slidesharecdn.com/absfluor14-140927044649-phpapp01/85/CVB222-UV-vis-Absorption-and-Fluorescence-Lecture-41-320.jpg)
![Faculty of Science and Engineering
APPLICATIONS
• Benzo[a]pyrene, is a 5-
ring polycyclic aromatic
hydrocarbon that is
mutagenic and highly
carcinogenic
• It is found in tobacco
smoke and tar
• The epoxide of this
molecule intercalates in
DNA, covalently
bonding to the guanine
base nucleotide](https://image.slidesharecdn.com/absfluor14-140927044649-phpapp01/85/CVB222-UV-vis-Absorption-and-Fluorescence-Lecture-42-320.jpg)


- The document discusses absorption and fluorescence spectroscopy techniques. It covers fundamental concepts like Beer's law, deviations from Beer's law, instrumentation for absorption and fluorescence measurements, and applications like drug and pollutant analysis. - Key concepts covered include energy level diagrams to explain fluorescence and phosphorescence, factors that influence fluorescence intensity, and examples of fluorescent molecules and how their structure impacts fluorescence properties. - Applications discussed are determination of carcinogenic polyaromatic hydrocarbons like benzo(a)pyrene and fluorimetric analysis of drugs like quinine and LSD.


![Human Reproduction [ Reproductive System ] Notes @irfanullah_mehar Irfanullah...](https://cdn.slidesharecdn.com/ss_thumbnails/humanreproductionreproductivesystemnotesirfanullahmeharirfanullahmeharjanantantra-260111172350-56e85778-thumbnail.jpg?width=640&height=640&fit=bounds)


