Download to read offline


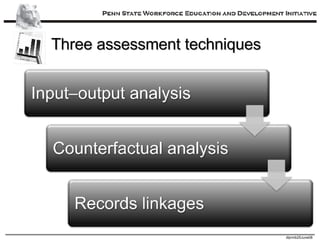


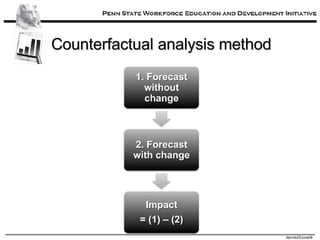


The document discusses three cutting edge economic techniques for assessing regional innovations: input-output analysis, counterfactual analysis, and records linkages. Input-output analysis uses tables to organize data on production and consumption across industries and calculate economic multipliers. Counterfactual analysis uses models to examine hypothetical scenarios and their implications. Records linkages match youth and unemployment data to study employment outcomes over time while preserving confidentiality.


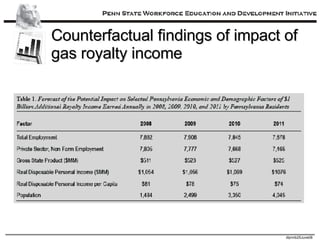
![Rural Decline[1][1][1]](https://cdn.slidesharecdn.com/ss_thumbnails/rural-decline111-1202225155673894-5-thumbnail.jpg?width=640&height=640&fit=bounds)