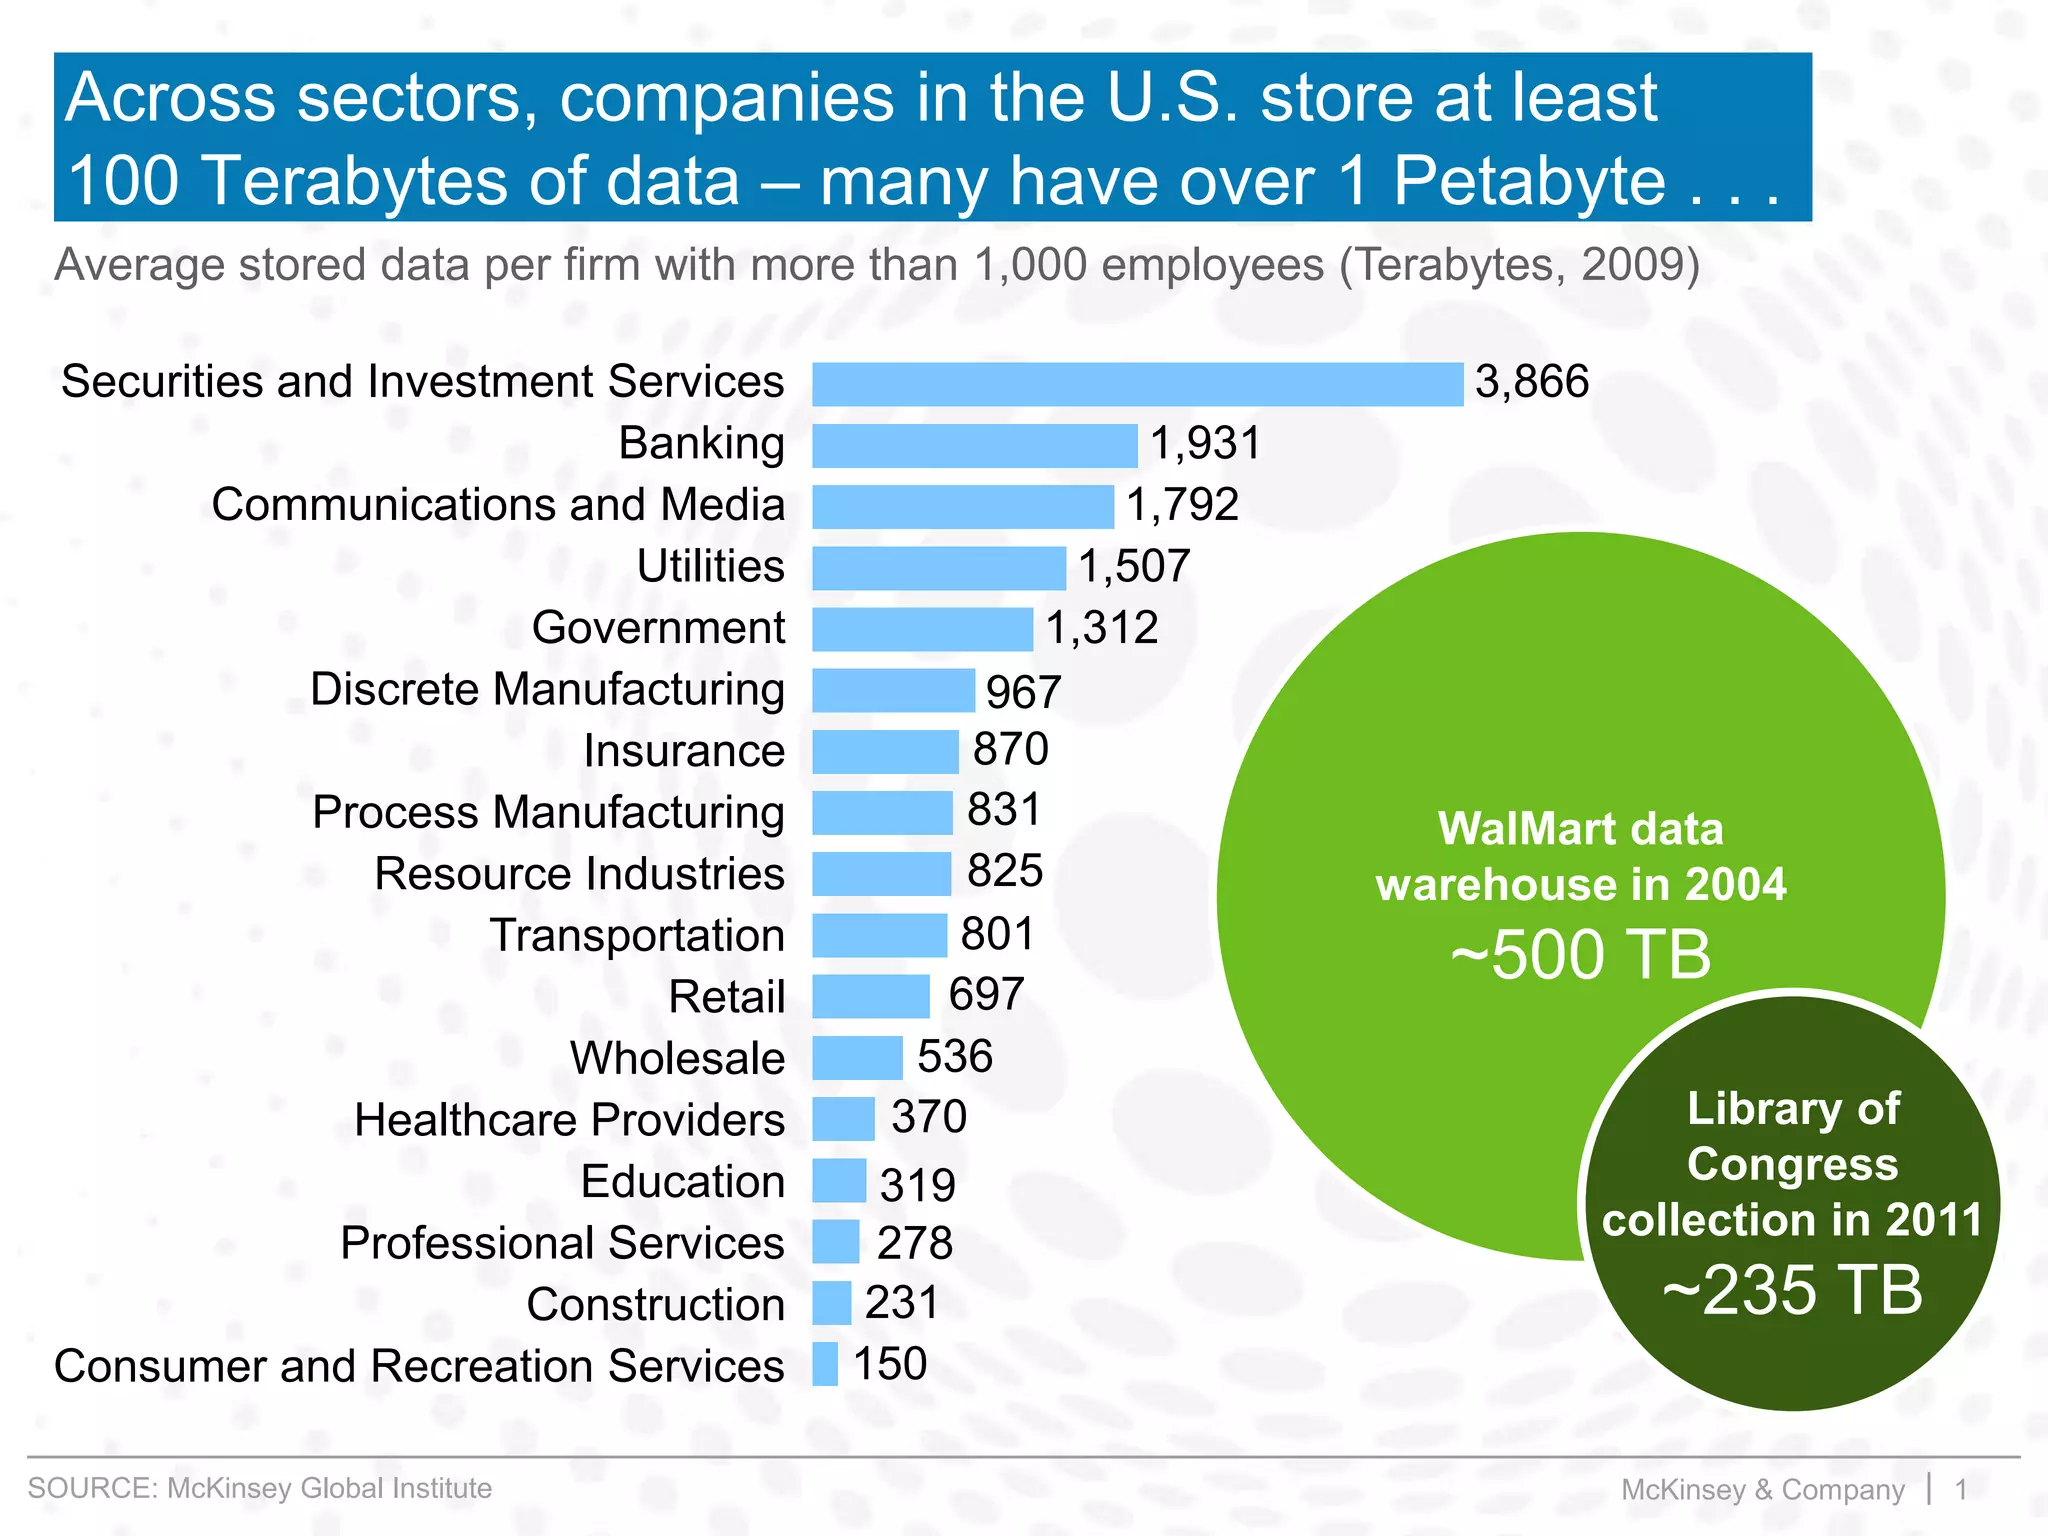
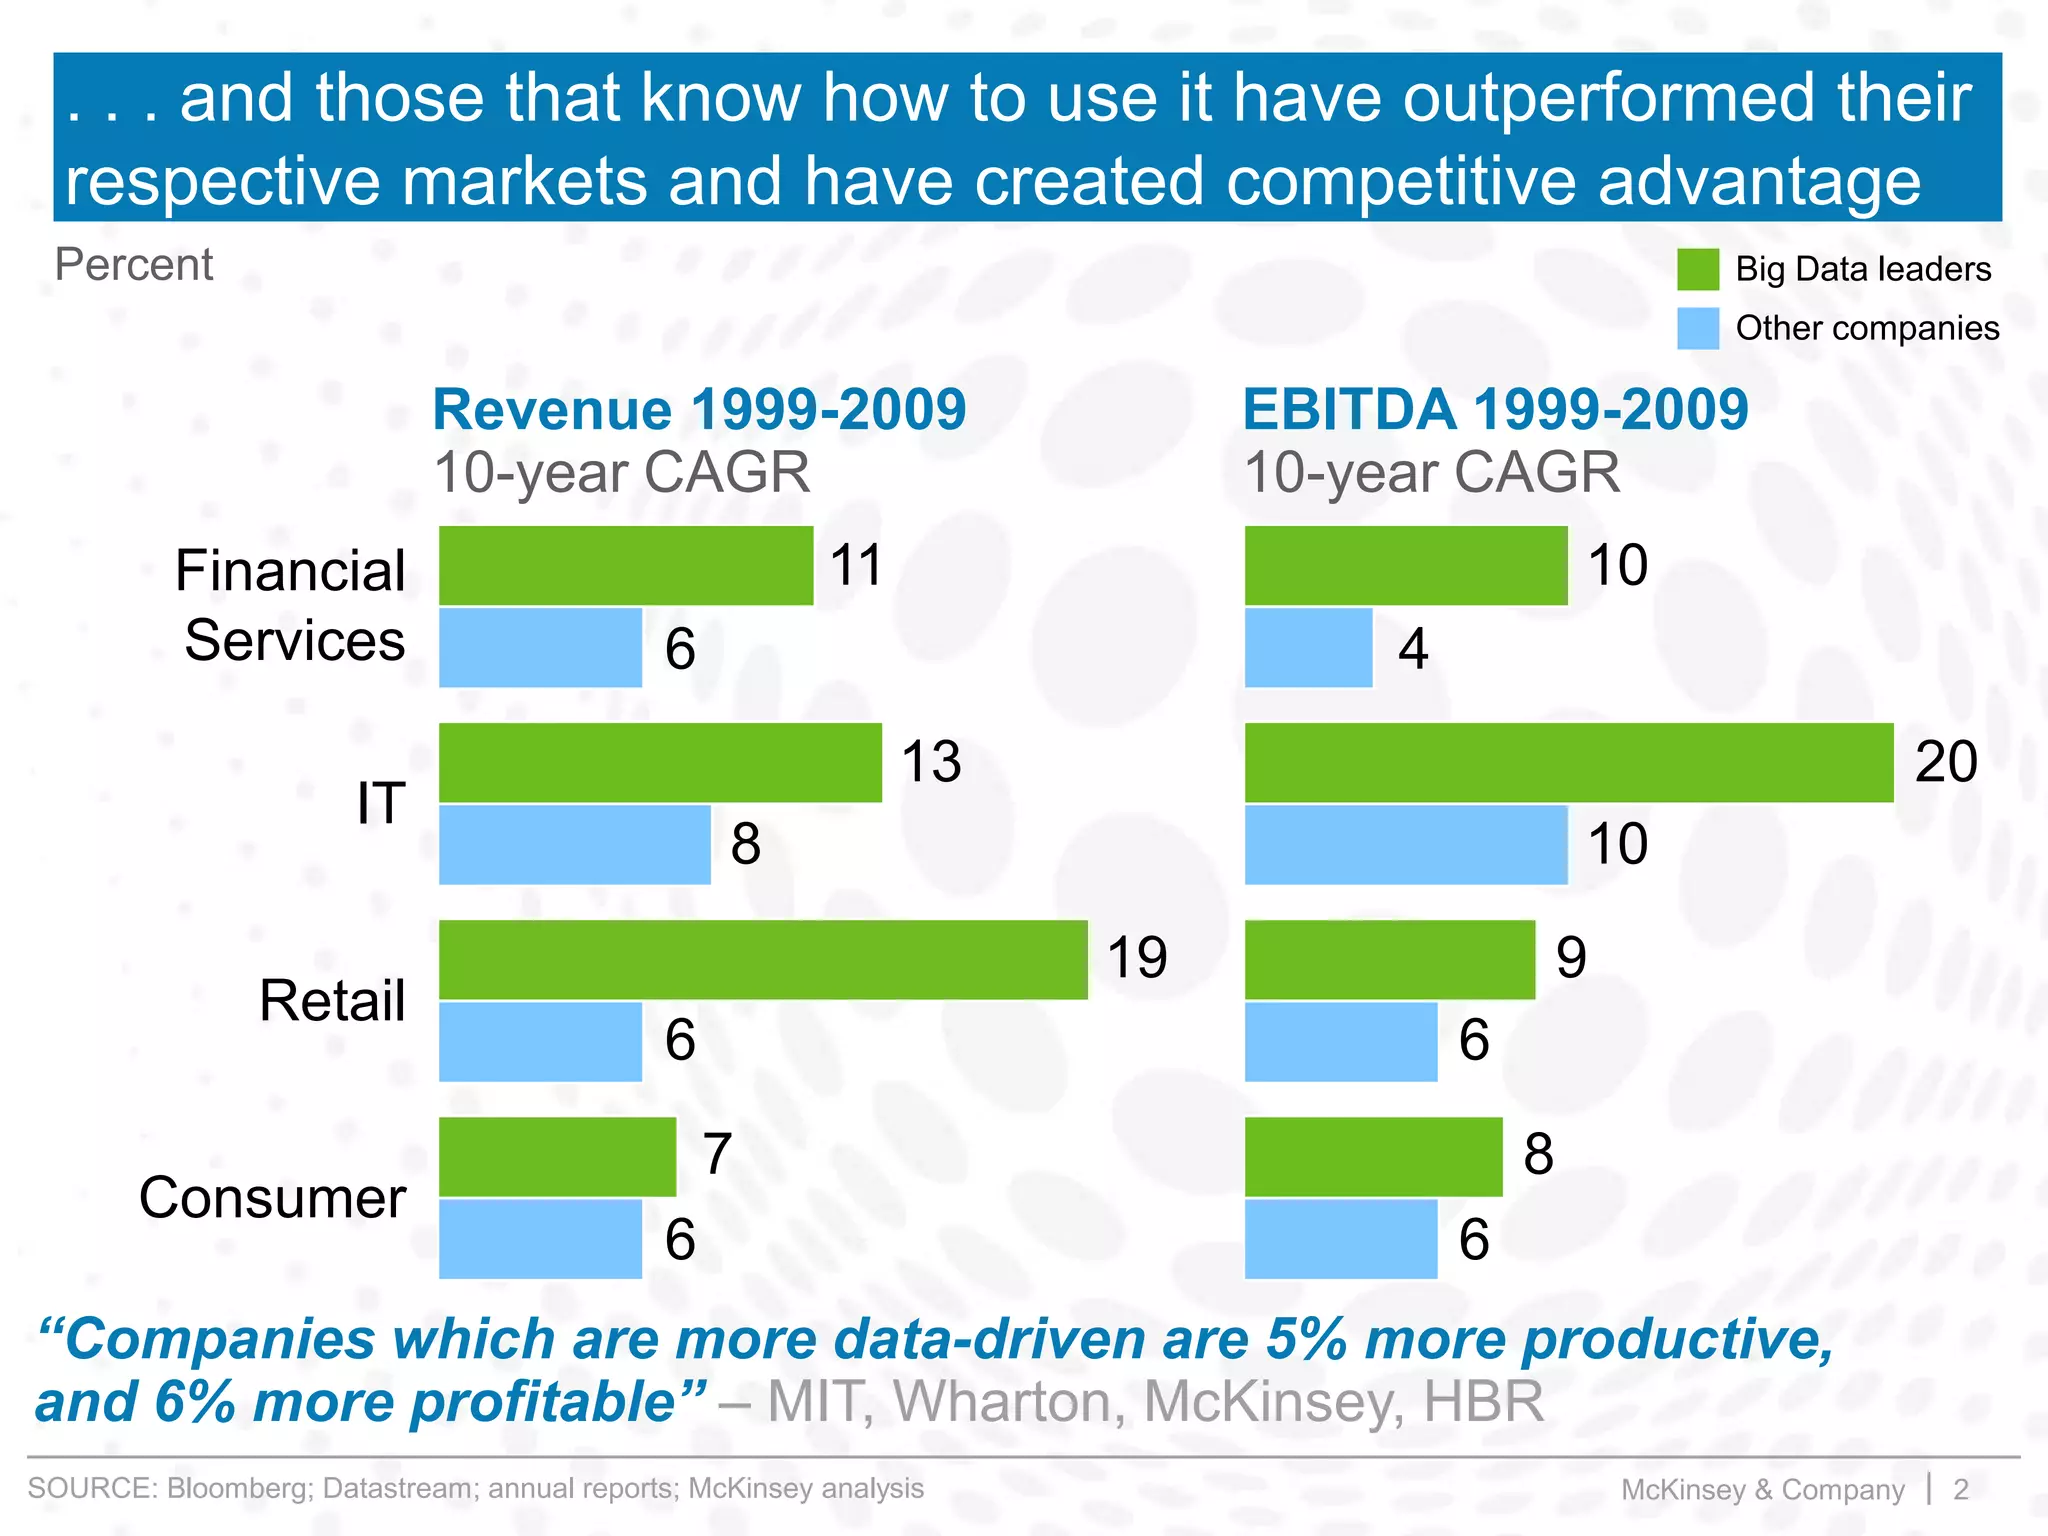
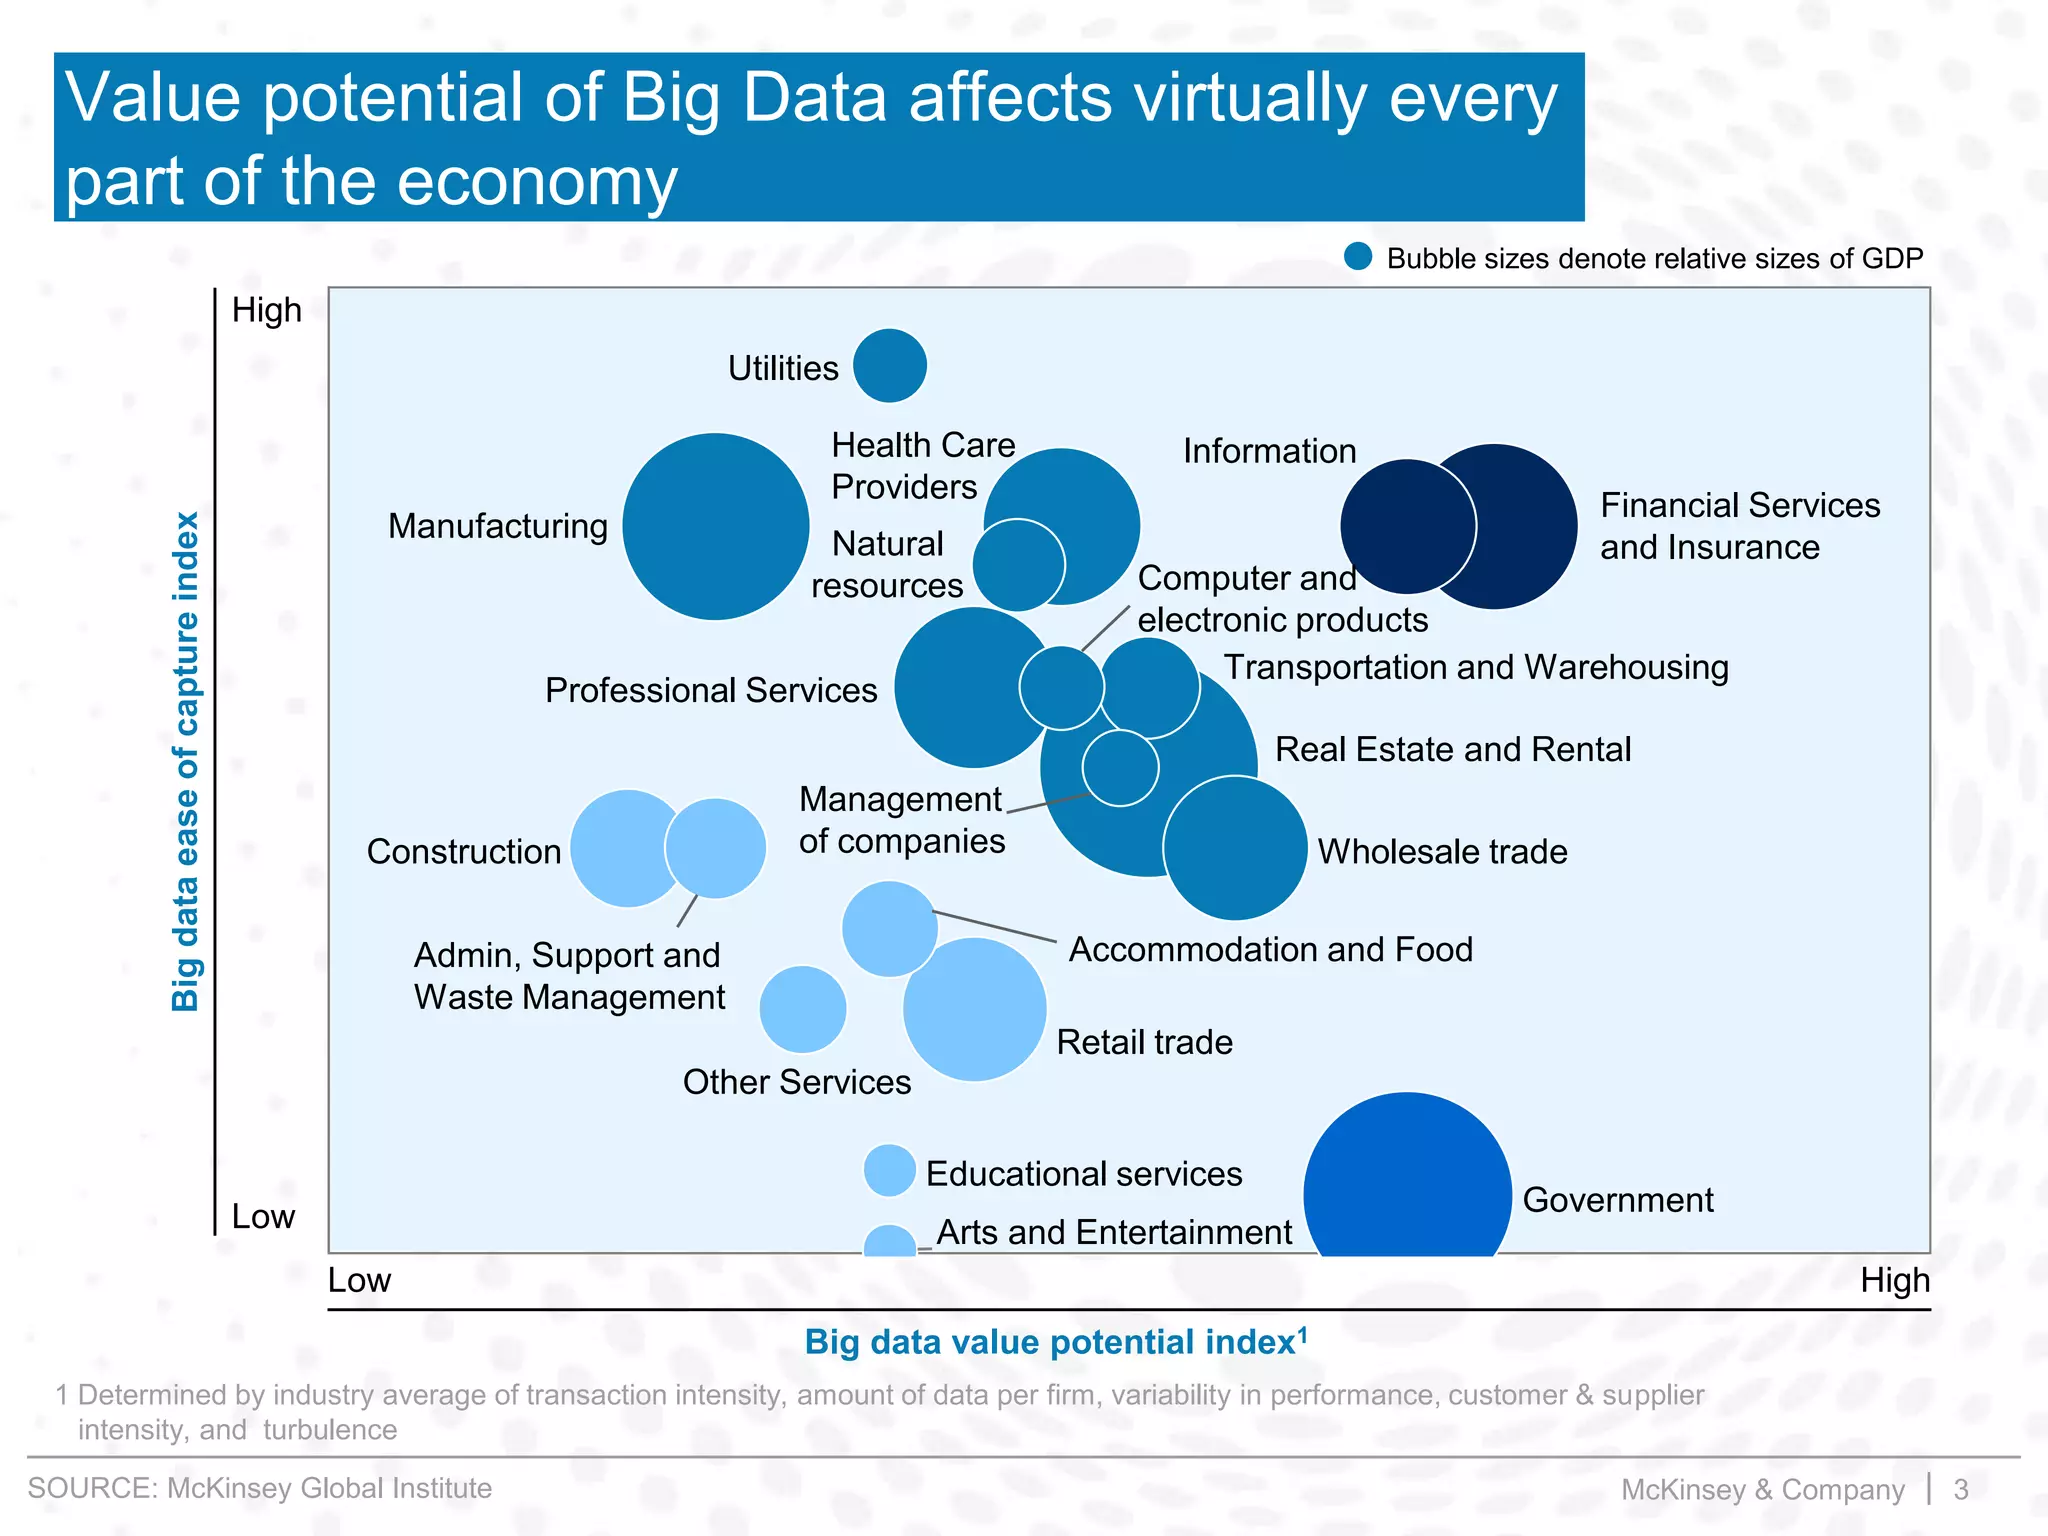
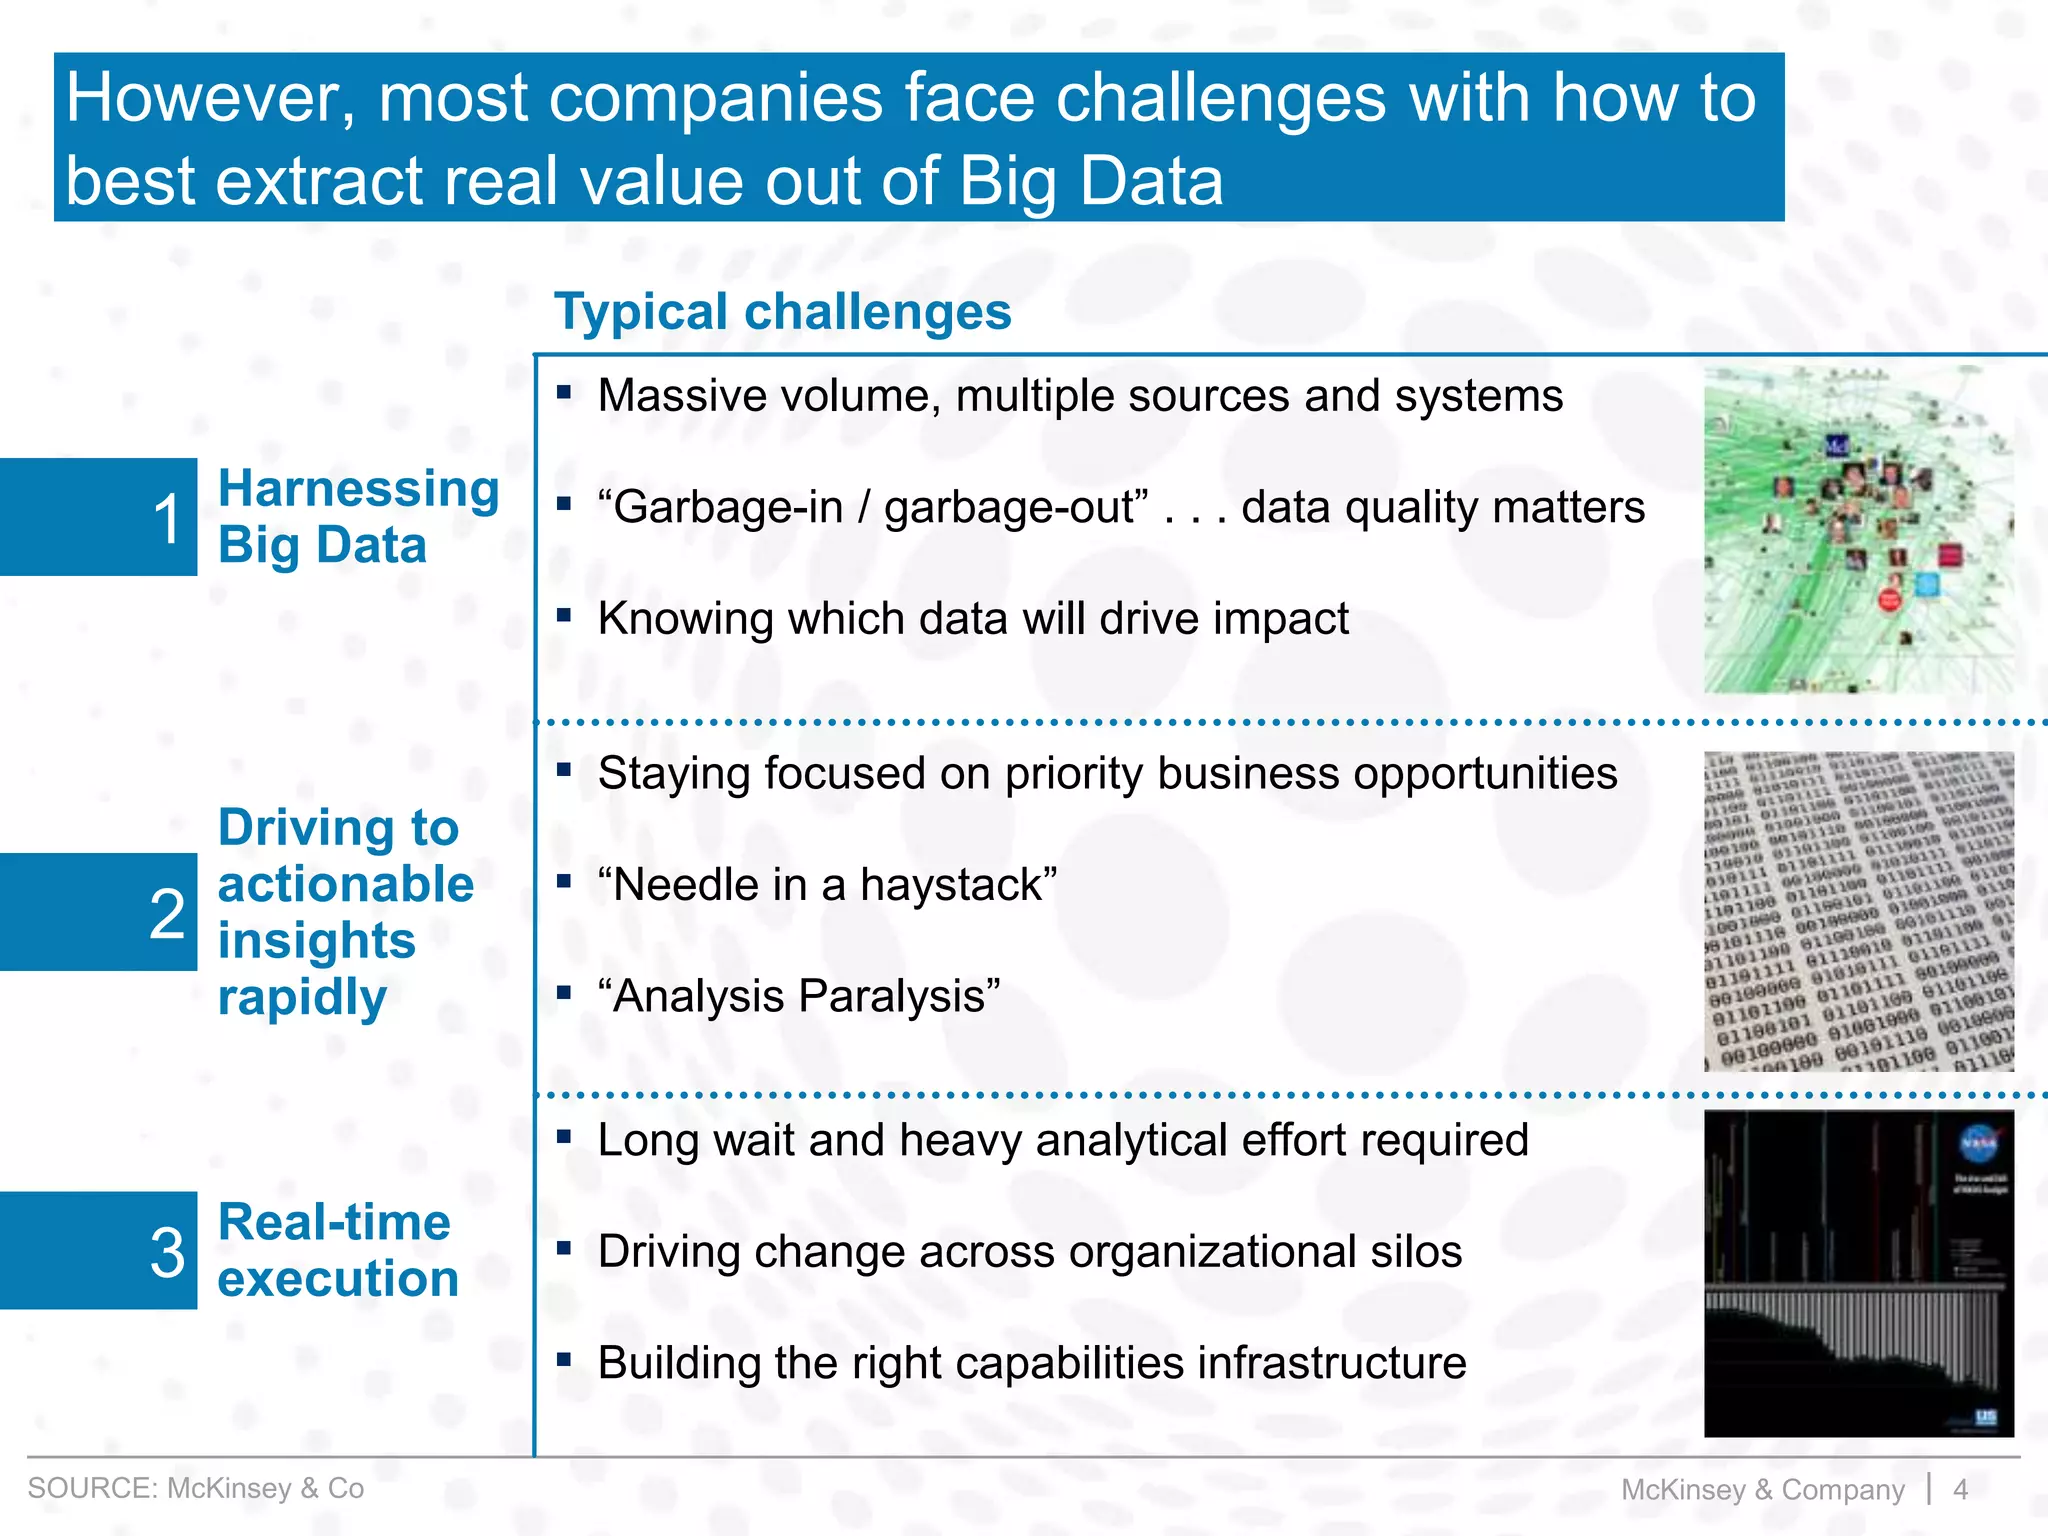
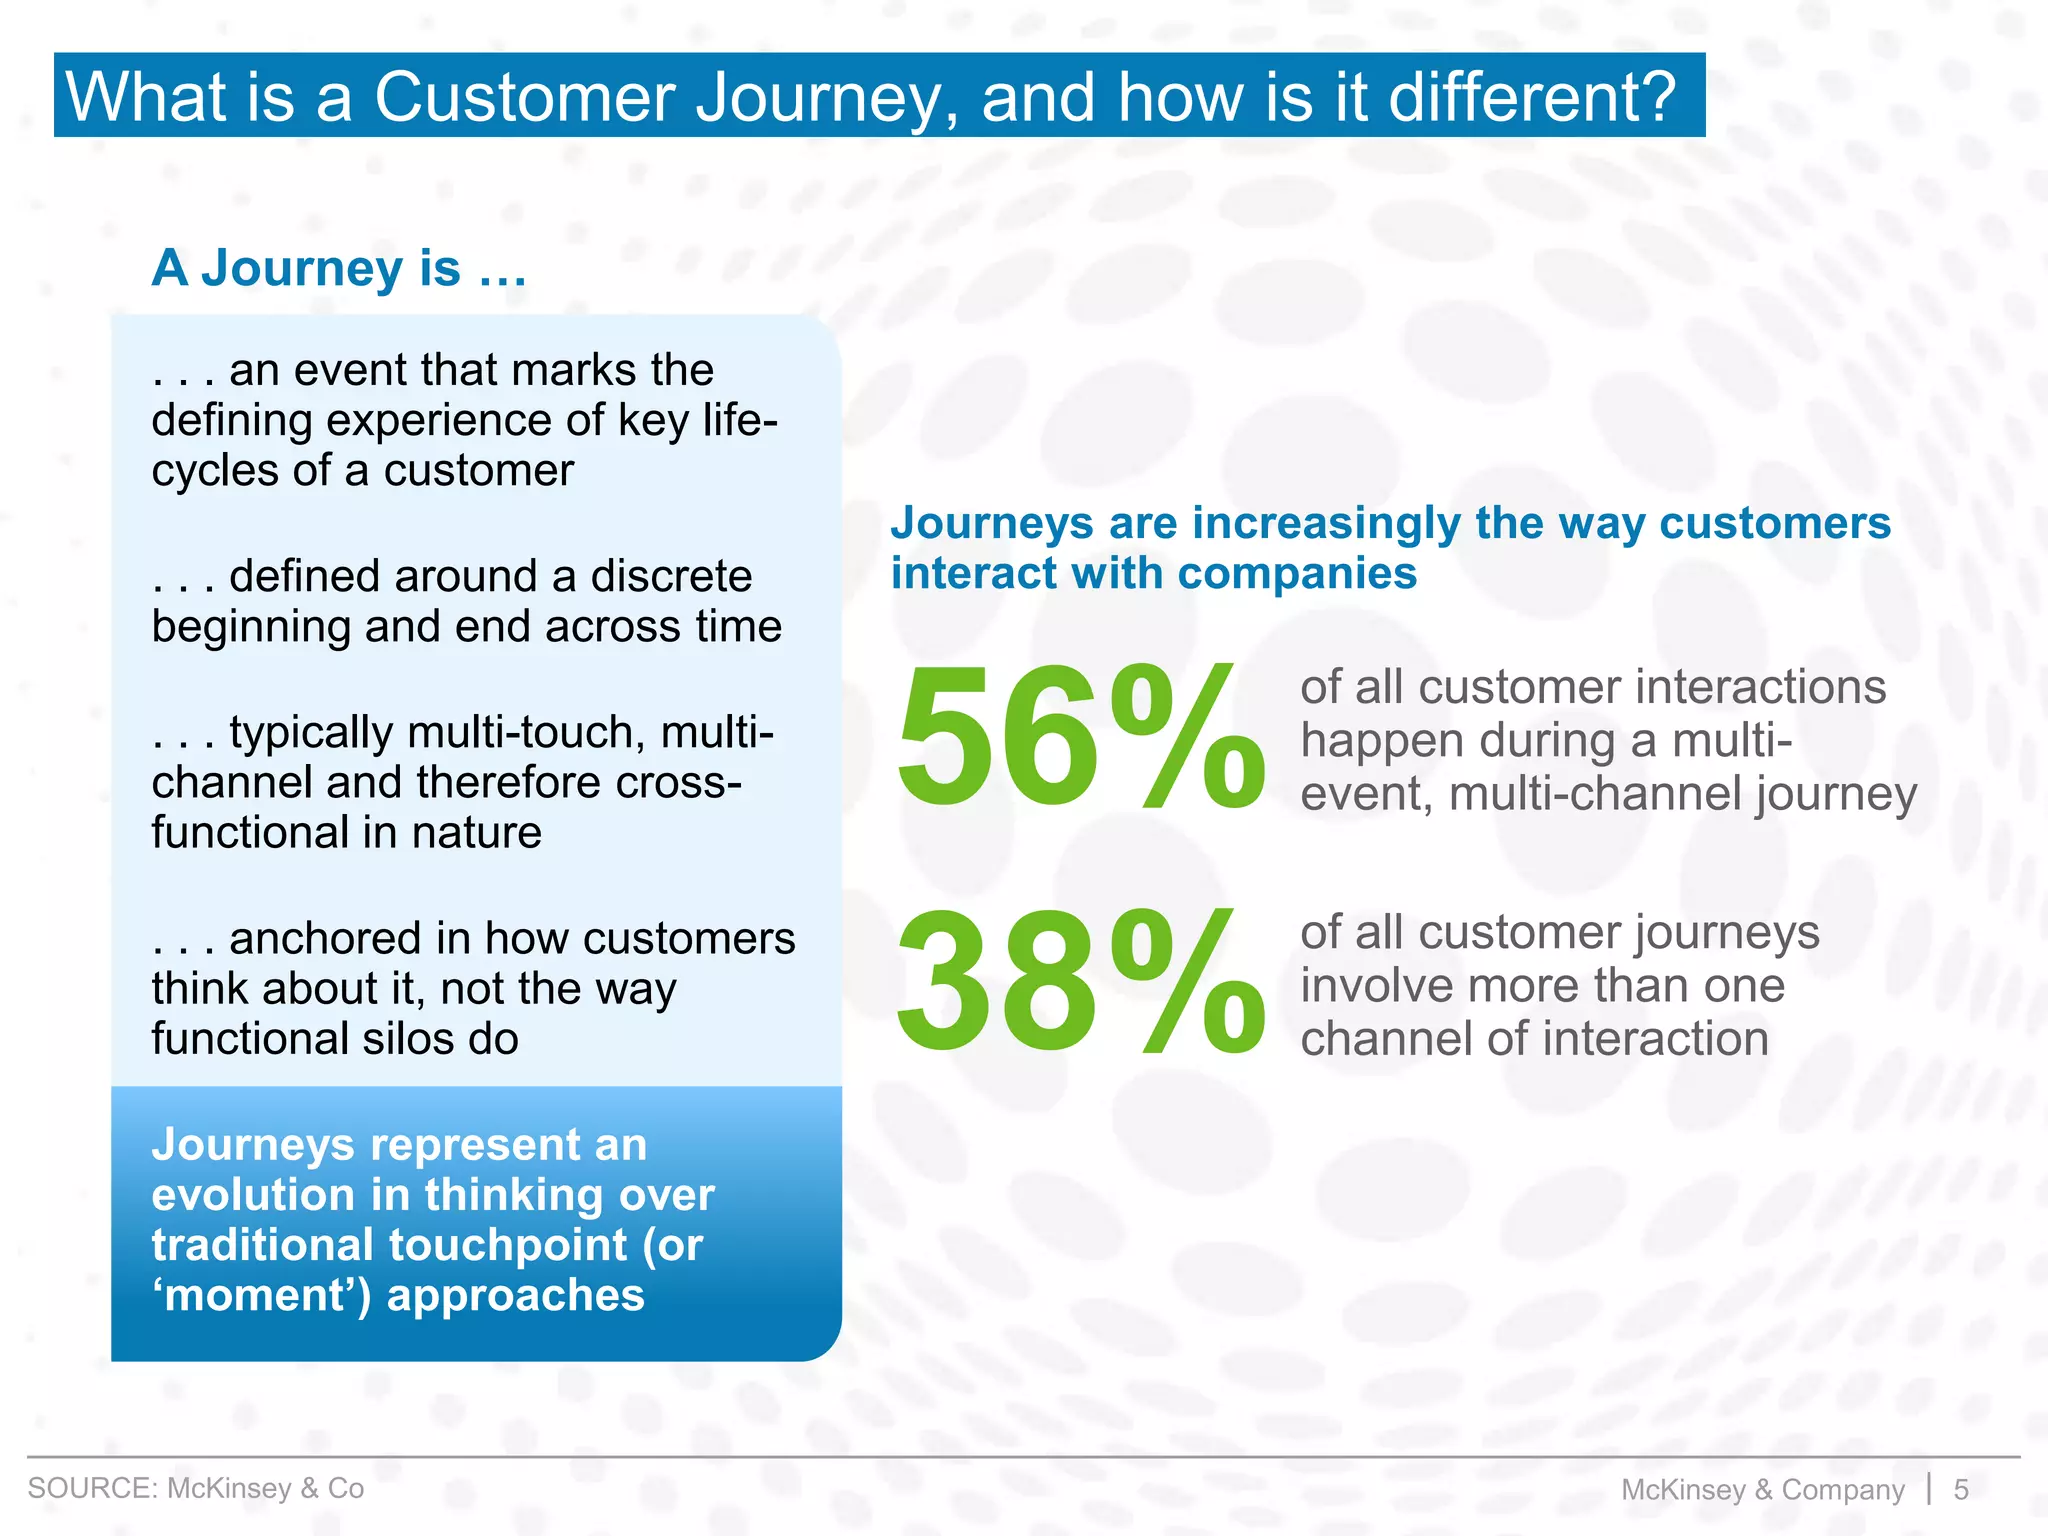
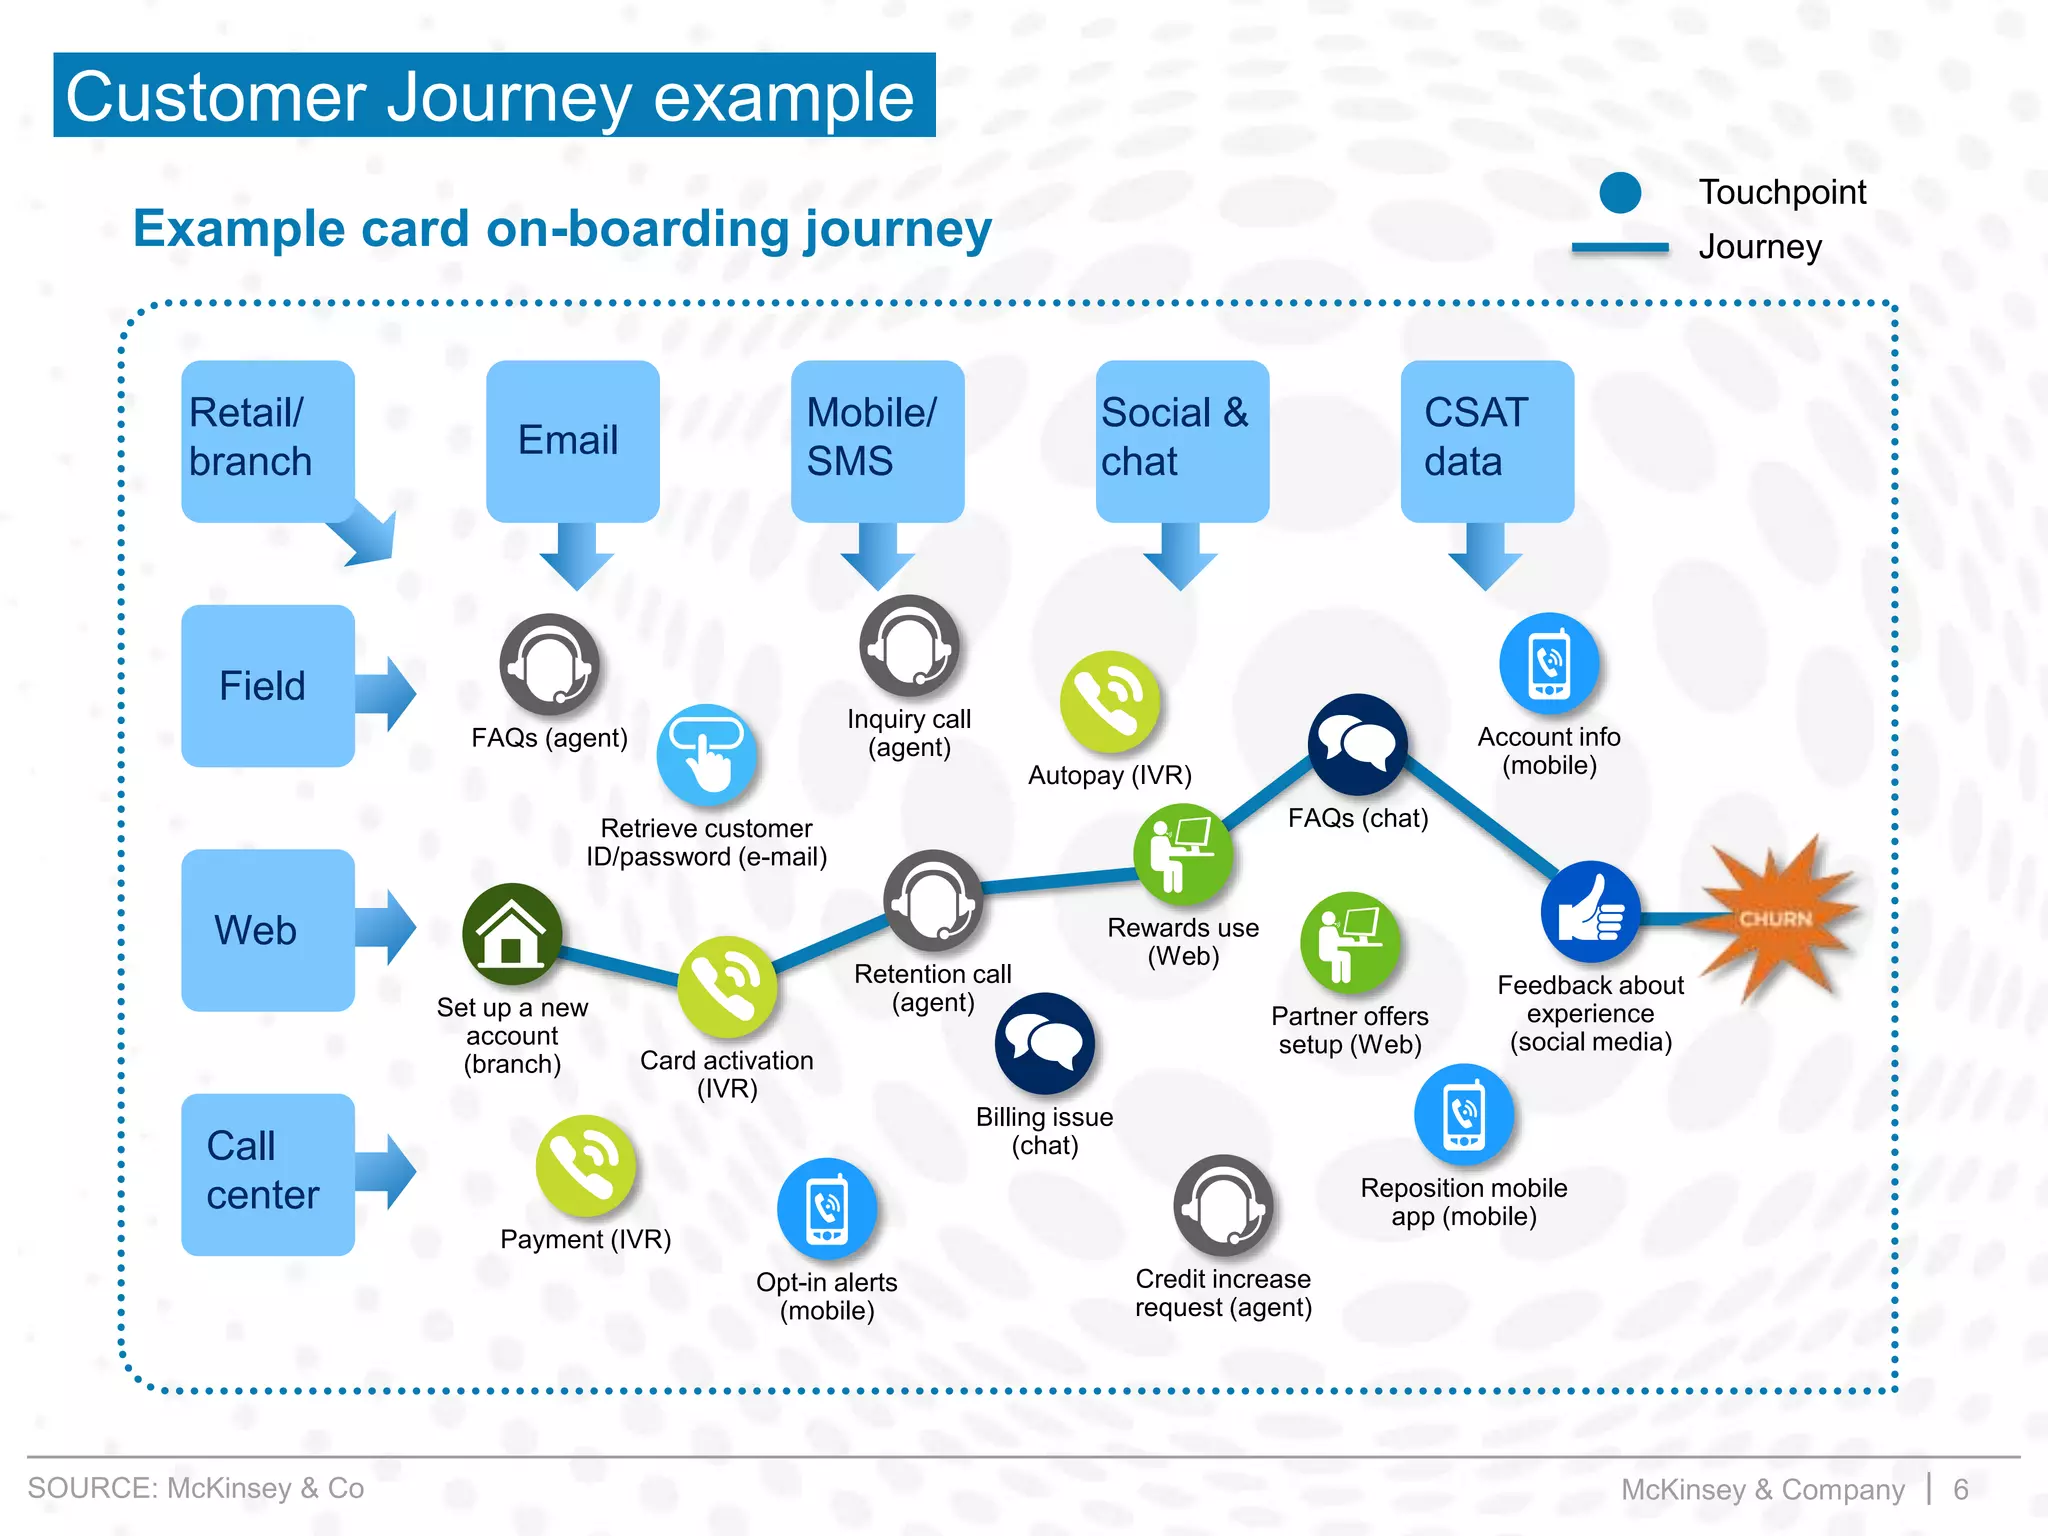
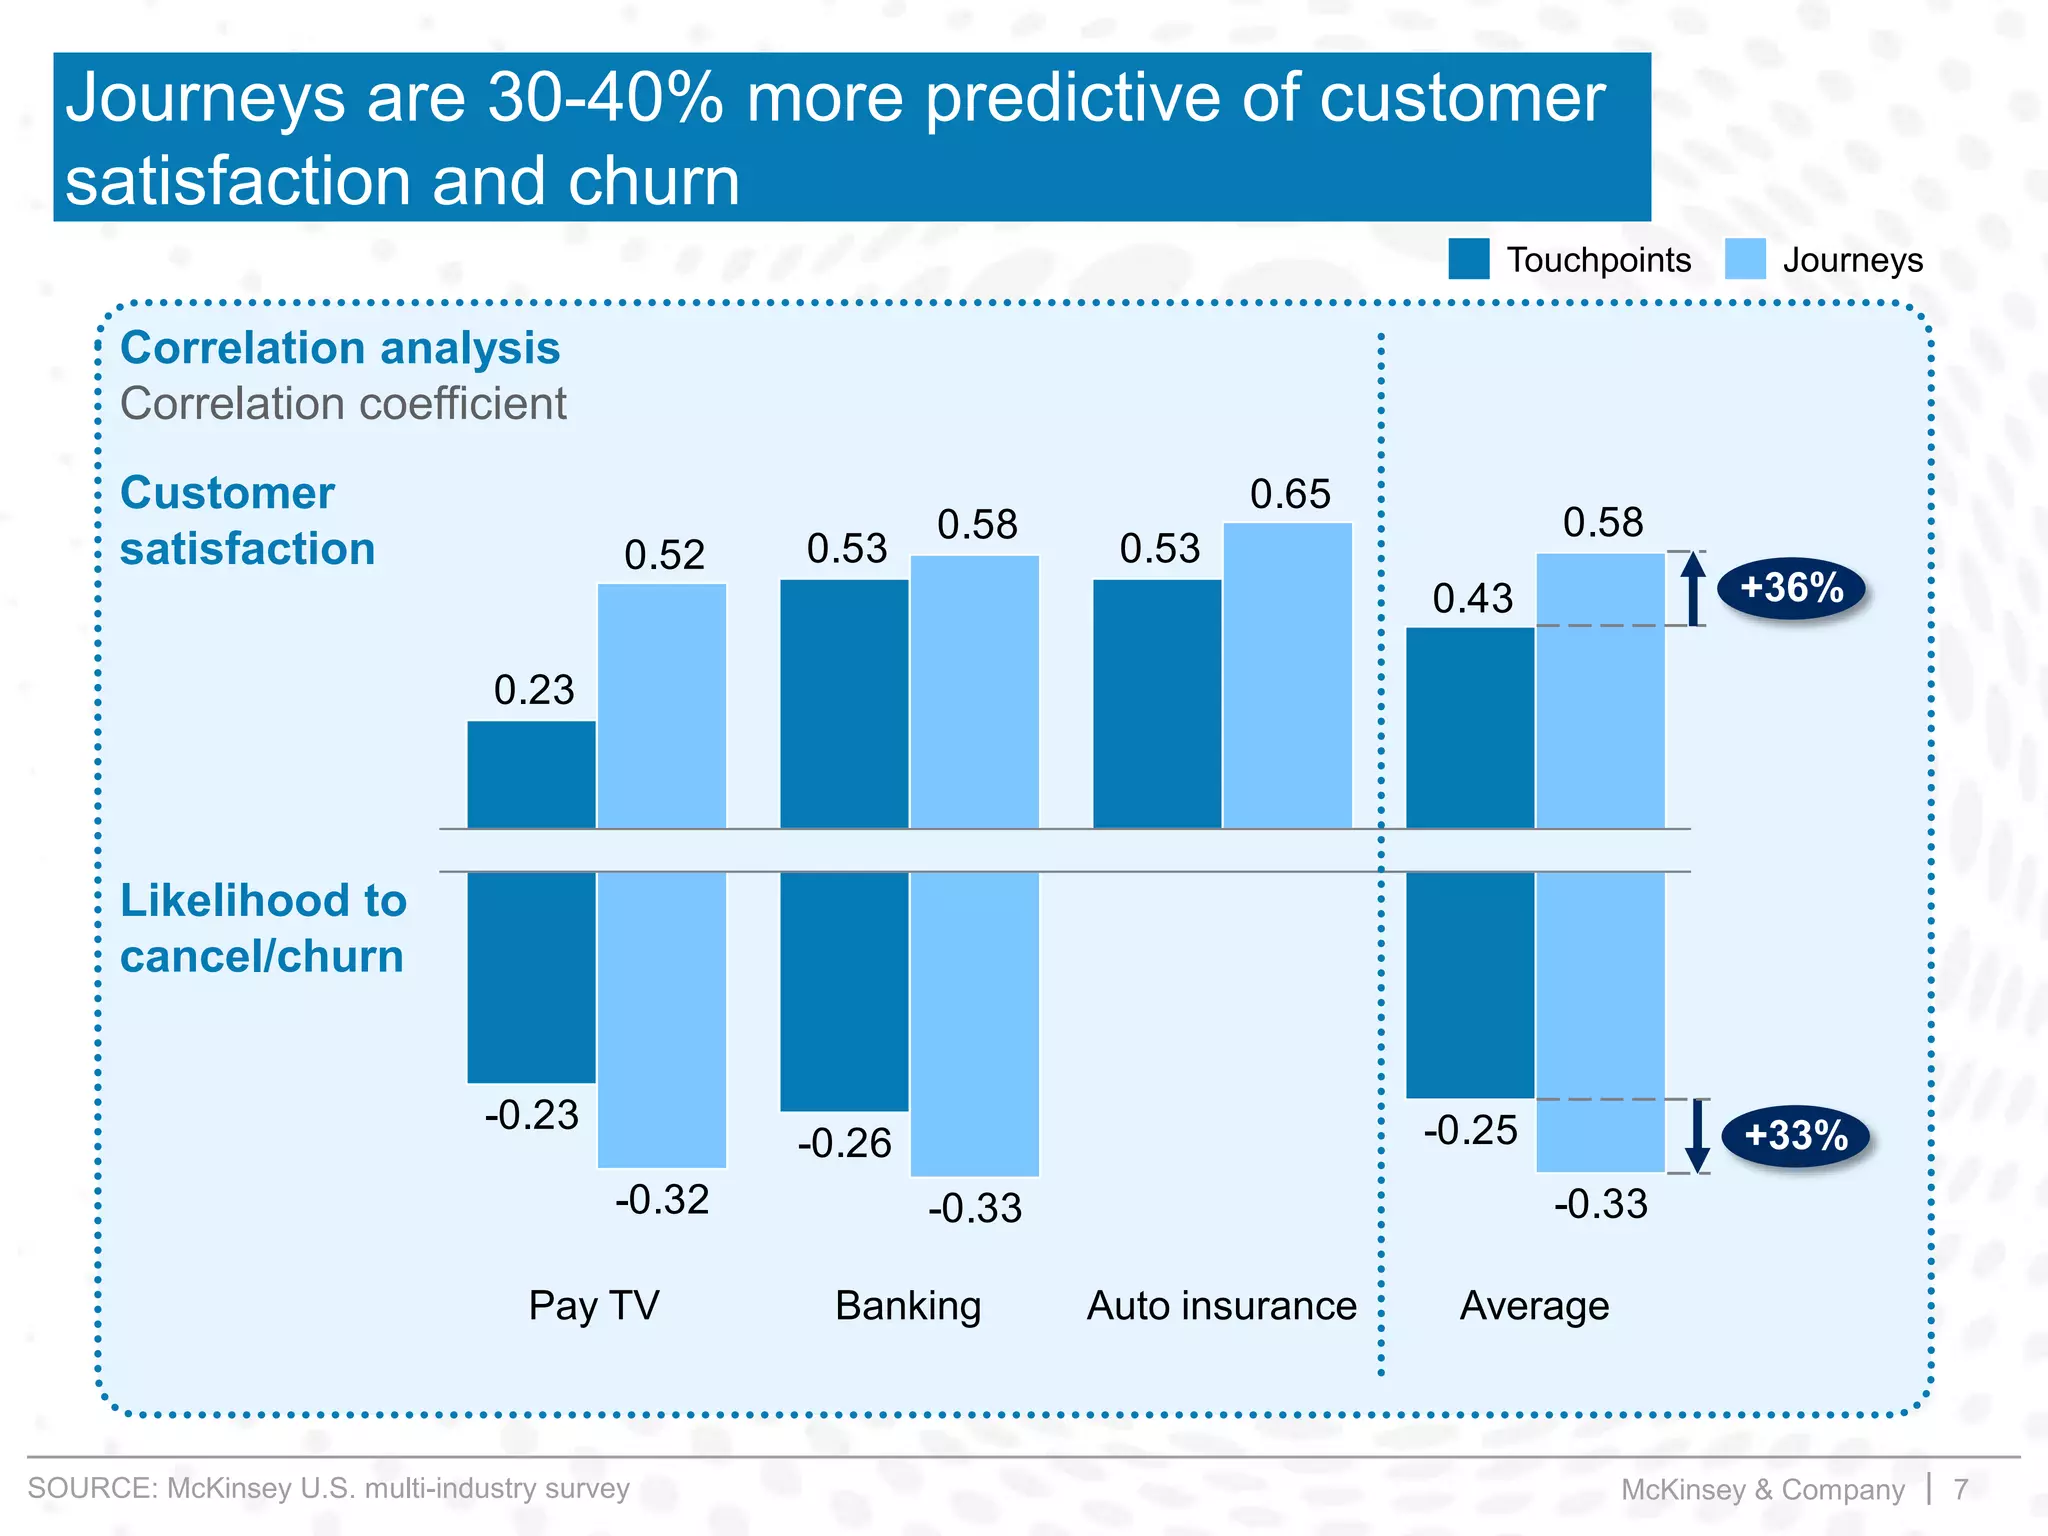
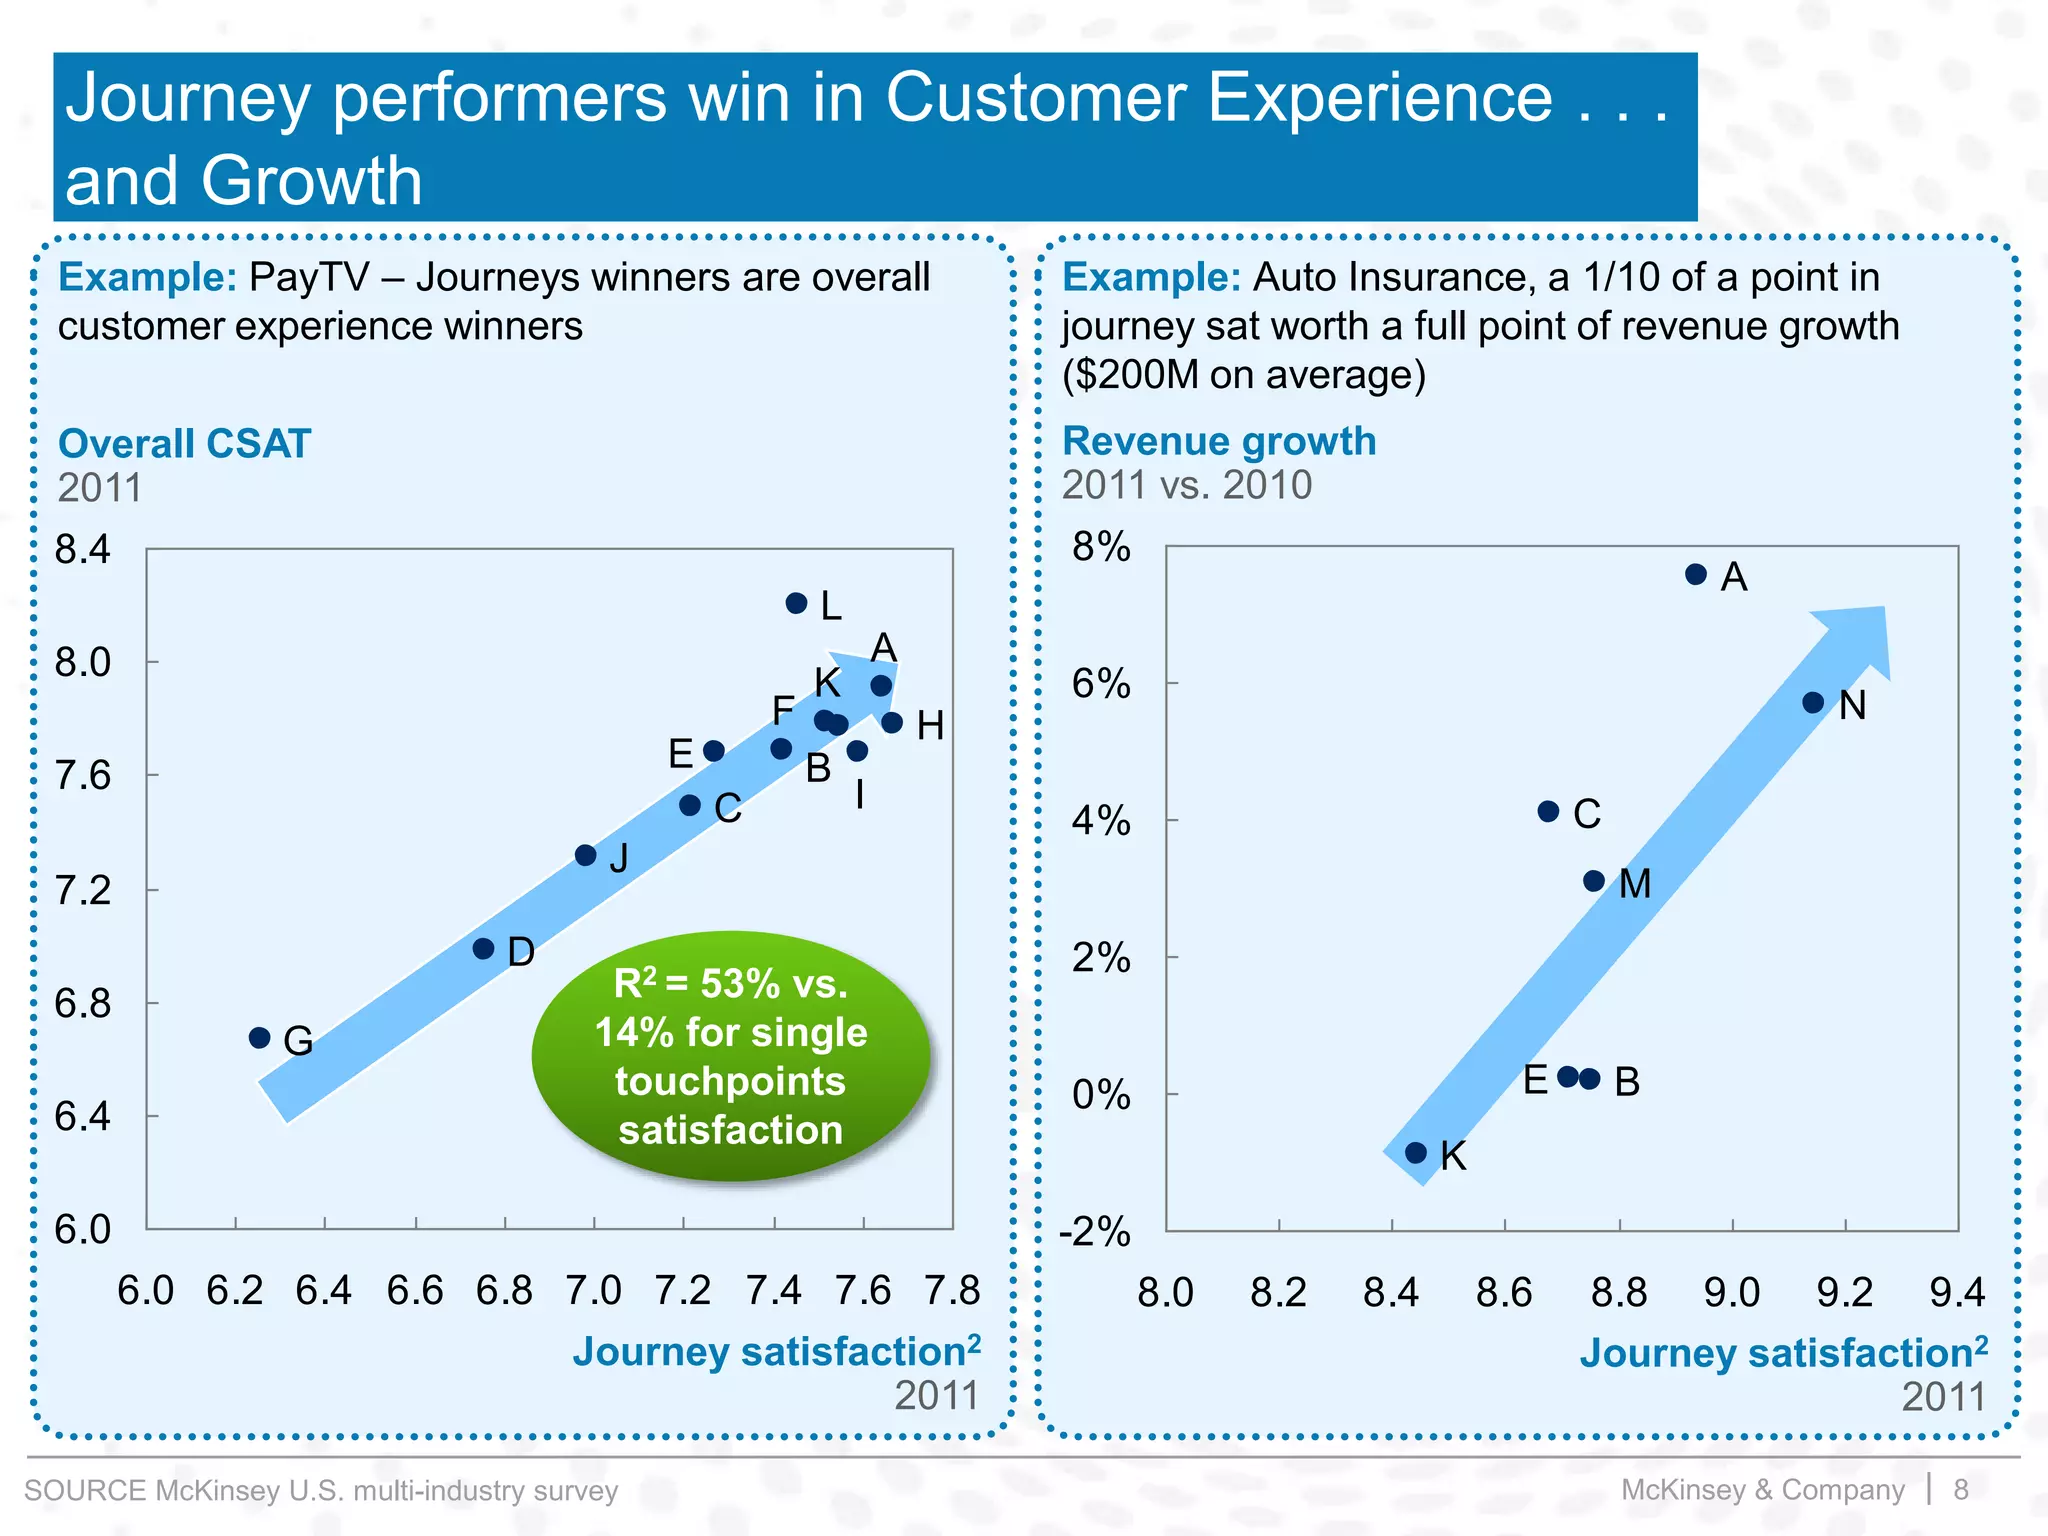
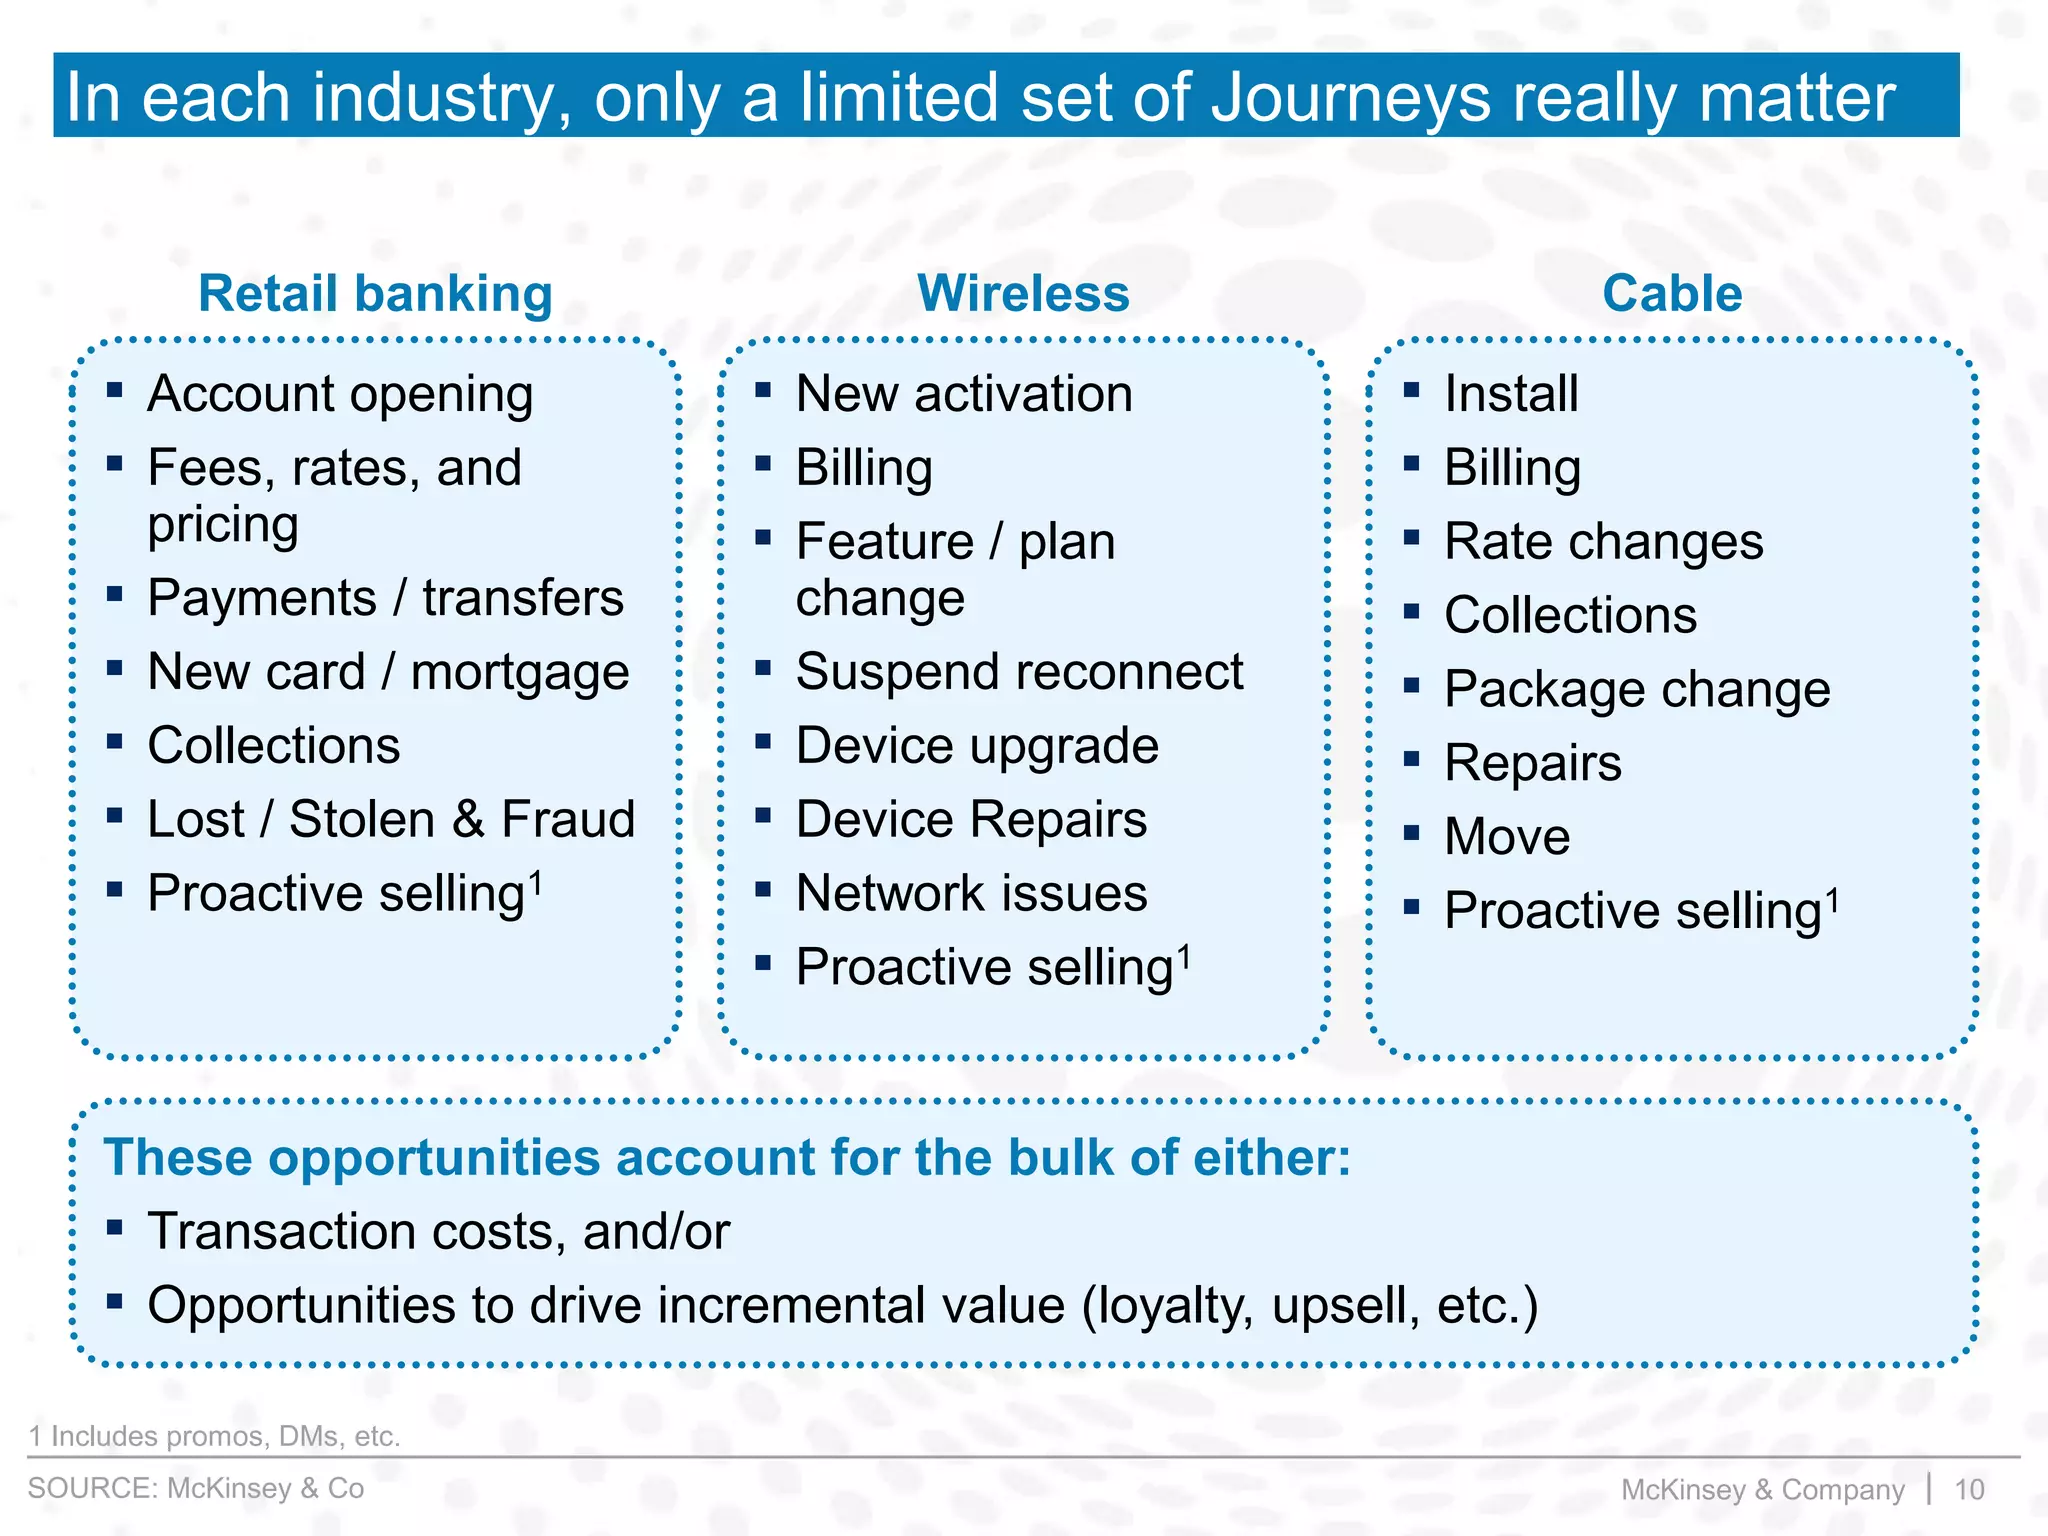
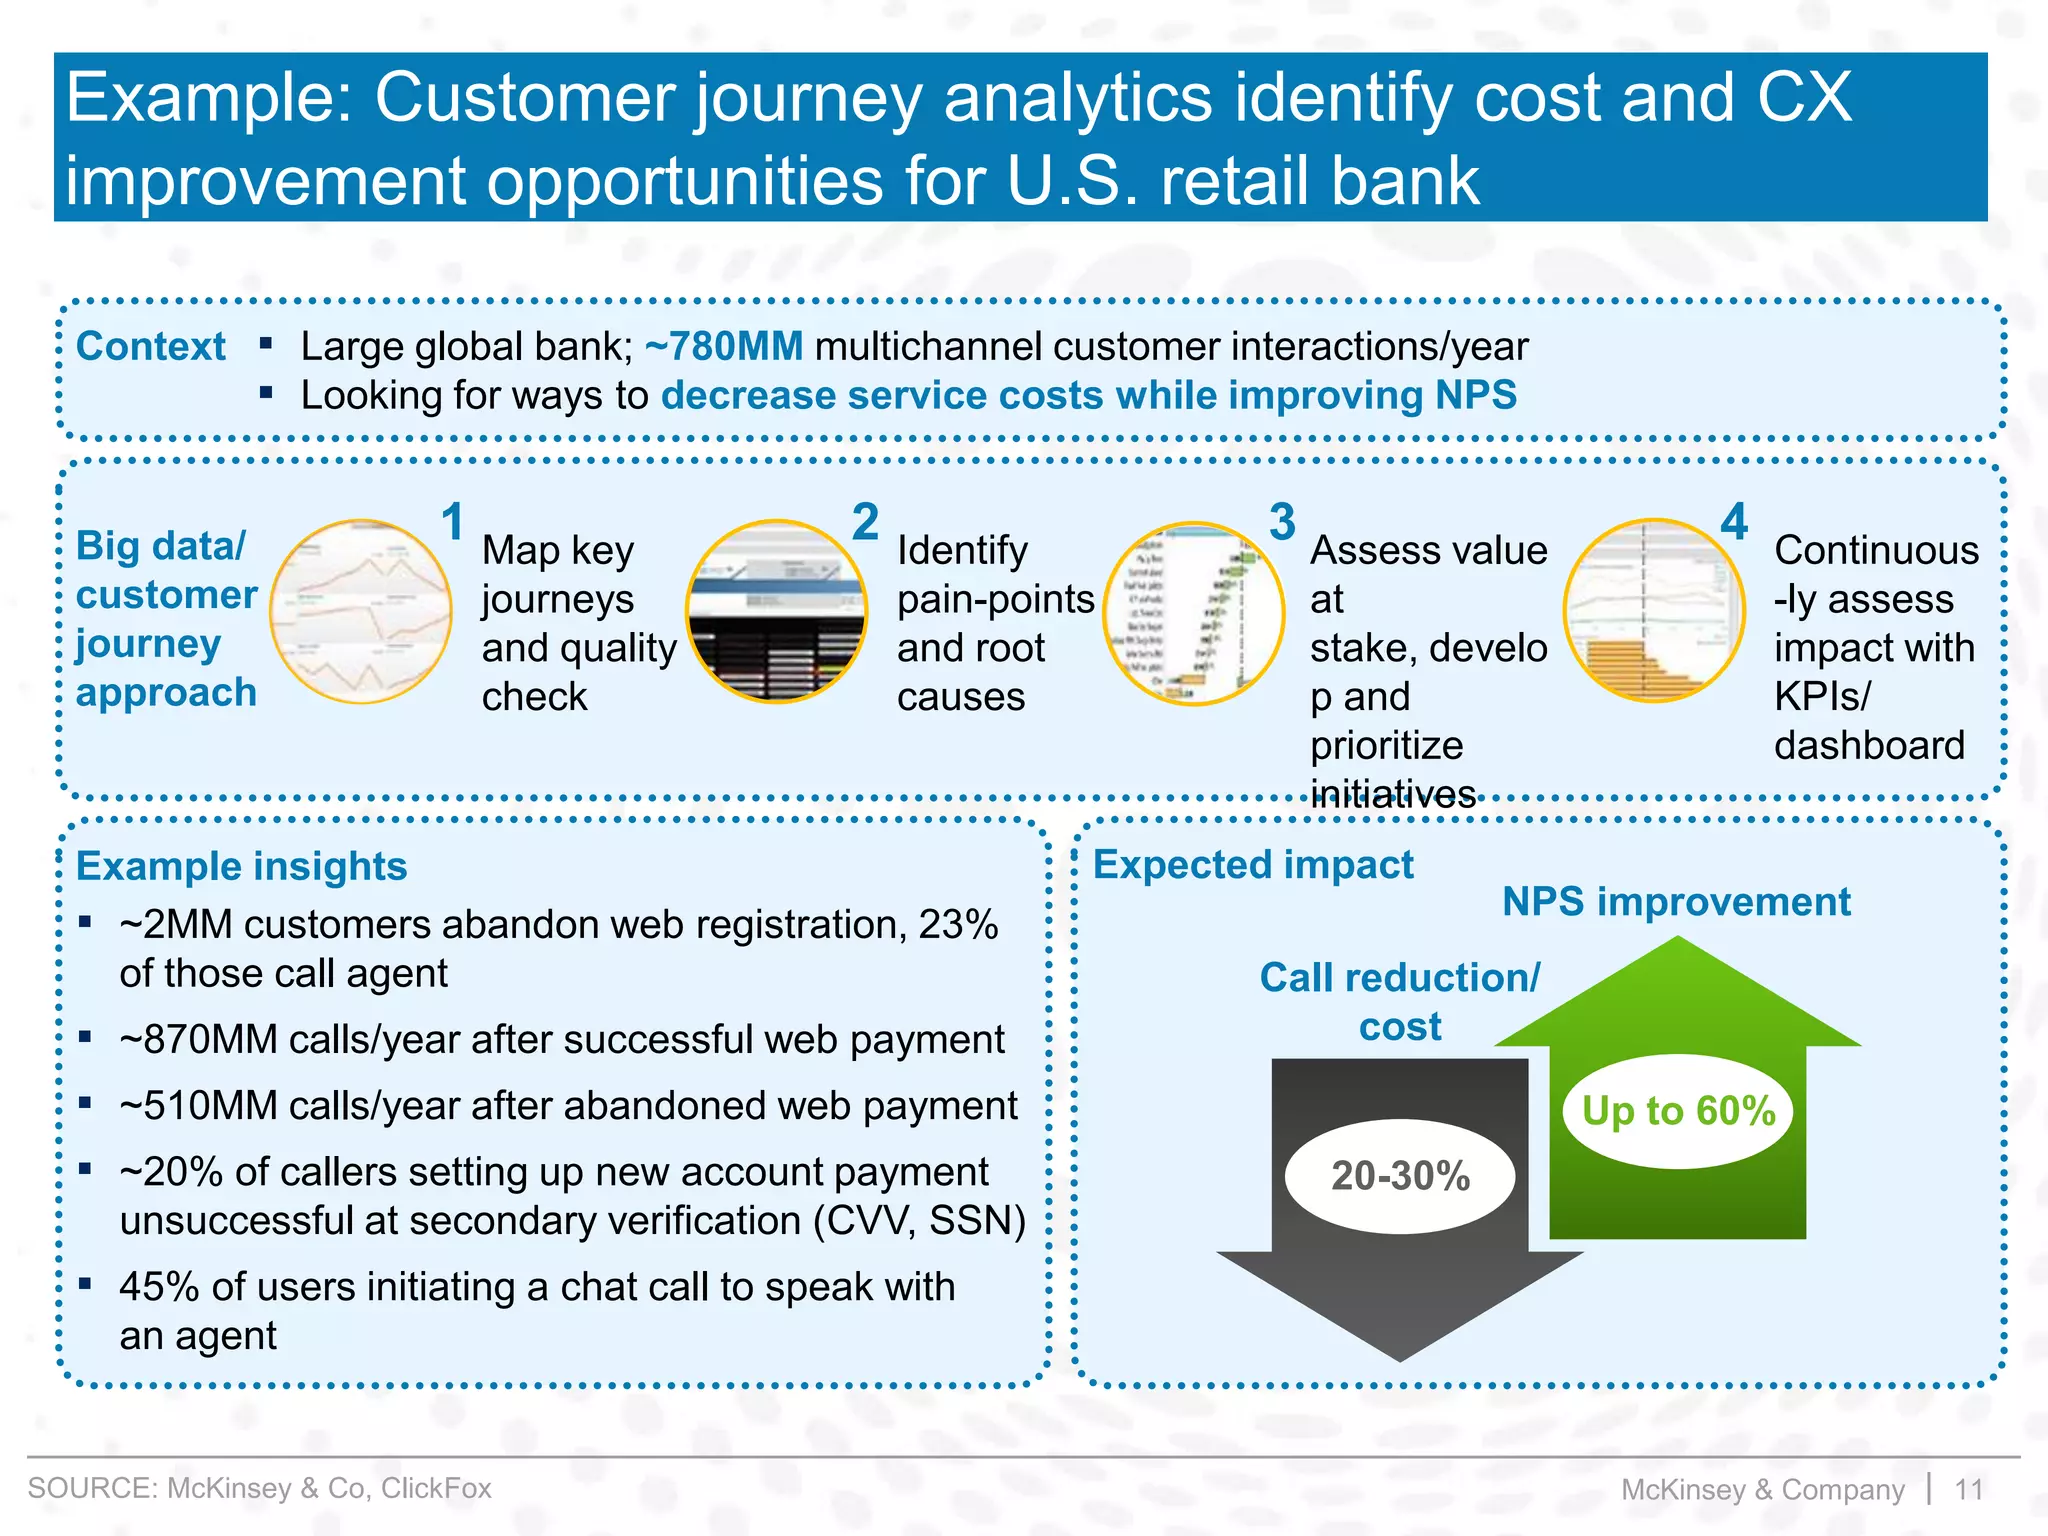
Any use of this material without specific permission of McKinsey & Company is strictly prohibited
McKinsey on Marketing & Sales – Slideshare Brief
April 2013
Customer Journey Analytics
and Big Data
McKinsey & Company | 1
Across sectors, companies in the U.S. store at least
100 Terabytes of data – many have over 1 Petabyte . . .
Average stored data per firm with more than 1,000 employees (Terabytes, 2009)
967
870
831
825
801
697
536
370
319
278
231
150
Discrete Manufacturing
Securities and Investment Services
Banking
Communications and Media
1,312
3,866
1,931
1,792
Utilities 1,507
Government
Healthcare Providers
Education
Professional Services
Construction
Consumer and Recreation Services
Insurance
Process Manufacturing
Resource Industries
Transportation
Retail
Wholesale
WalMart data
warehouse in 2004
~500 TB
Library of
Congress
collection in 2011
~235 TB
SOURCE: McKinsey Global Institute
McKinsey & Company | 2
. . . and those that know how to use it have outperformed their
respective markets and have created competitive advantage
Percent
Revenue 1999-2009
10-year CAGR
EBITDA 1999-2009
10-year CAGR
Financial
Services
IT
Retail
Consumer
11 10
6 4
13 20
8 10
19 9
6 6
7 8
6 6
Other companies
Big Data leaders
“Companies which are more data-driven are 5% more productive,
and 6% more profitable” – MIT, Wharton, McKinsey, HBR
SOURCE: Bloomberg; Datastream; annual reports; McKinsey analysis
McKinsey & Company | 3
Value potential of Big Data affects virtually every
part of the economy
Wholesale trade
Utilities
Computer and
electronic products
Arts and Entertainment
Educational services
Real Estate and Rental
Other Services
Health Care
Providers
Construction
Professional Services
Natural
resources
Transportation and Warehousing
Information
Manufacturing
Management
of companies
Financial Services
and Insurance
Government
Admin, Support and
Waste Management
Accommodation and Food
Retail trade
Bubble sizes denote relative sizes of GDP
High
Low
Big data value potential index1
High
Low
1 Determined by industry average of transaction intensity, amount of data per firm, variability in performance, customer & supplier
intensity, and turbulence
Bigdataeaseofcaptureindex
SOURCE: McKinsey Global Institute
McKinsey & Company | 4
However, most companies face challenges with how to
best extract real value out of Big Data
Harnessing
Big Data
Driving to
actionable
insights
rapidly
Real-time
execution
1
2
3
▪ Massive volume, multiple sources and systems
▪ “Garbage-in / garbage-out” . . . data quality matters
▪ Knowing which data will drive impact
▪ Staying focused on priority business opportunities
▪ “Needle in a haystack”
▪ “Analysis Paralysis”
▪ Long wait and heavy analytical effort required
▪ Driving change across organizational silos
▪ Building the right capabilities infrastructure
Typical challenges
SOURCE: McKinsey & Co
McKinsey & Company | 5
What is a Customer Journey, and how is it different?
. . . an event that marks the
defining experience of key life-
cycles of a customer
. . . defined around a discrete
beginning and end across time
. . . typically multi-touch, multi-
channel and therefore cross-
functional in nature
. . . anchored in how customers
think about it, not the way
functional silos do
Journeys represent an
evolution in thinking over
traditional touchpoint (or
„moment‟) approaches
A Journey is …
Journeys are increasingly the way customers
interact with companies
of all customer interactions
happen during a multi-
event, multi-channel journey
of all customer journeys
involve more than one
channel of interaction
56%
38%
SOURCE: McKinsey & Co
McKinsey & Company | 6
Customer Journey example
Journey
Touchpoint
Example card on-boarding journey
FAQs (agent)
Retrieve customer
ID/password (e-mail)
Inquiry call
(agent)
FAQs (chat)
Card activation
(IVR)
Rewards use
(Web)
Partner offers
setup (Web)
Feedback about
experience
(social media)
Billing issue
(chat)
Opt-in alerts
(mobile)
Account info
(mobile)
Reposition mobile
app (mobile)
Credit increase
request (agent)
Retention call
(agent)
Payment (IVR)
Autopay (IVR)
Email
Social &
chat
Retail/
branch
Web
Call
center
Field
Mobile/
SMS
CSAT
data
Set up a new
account
(branch)
SOURCE: McKinsey & Co
McKinsey & Company | 7
Journeys are 30-40% more predictive of customer
satisfaction and churn
Correlation analysis
Correlation coefficient
0.43
0.530.53
0.23
0.58
0.65
0.58
0.52
+36%
JourneysTouchpoints
Customer
satisfaction
-0.25-0.26
-0.23
-0.33-0.33-0.32
+33%
AverageAuto insuranceBankingPay TV
Likelihood to
cancel/churn
SOURCE: McKinsey U.S. multi-industry survey
McKinsey & Company | 8
6.0
6.4
6.8
7.2
7.6
8.0
8.4
6.0 6.2 6.4 6.6 6.8 7.0 7.2 7.4 7.6 7.8
Overall CSAT
2011
Journey satisfaction2
2011
I
H
J
G
F
E
D
L
K
C
B
A
Journey performers win in Customer Experience . . .
and Growth
Example: PayTV – Journeys winners are overall
customer experience winners
R2 = 53% vs.
14% for single
touchpoints
satisfaction
-2%
0%
2%
4%
6%
8%
8.0 8.2 8.4 8.6 8.8 9.0 9.2 9.4
Journey satisfaction2
2011
N
M
E
K
C
B
A
Revenue growth
2011 vs. 2010
Example: Auto Insurance, a 1/10 of a point in
journey sat worth a full point of revenue growth
($200M on average)
SOURCE McKinsey U.S. multi-industry survey
McKinsey & Company | 9
. . . and drive substantial impact along all key business levers
Impact
Service operations
10% to 20% of customer service cost
trapped between channels
15-20%
Call/visit reduction
Retention, cross/up-selling
Journeys account for 5% to 20%
of churn / sale
Cross selling
10-20%
10-25bps
Churn
decrease
Customer experience (CE)
Journeys are 30% to 40% more
predictive of CE than touch
points
CSAT lift
5-10 ppts
5-15%
Cost
avoidance
Business lever
SOURCE: McKinsey & Co
McKinsey & Company | 10
In each industry, only a limited set of Journeys really matter
1 Includes promos, DMs, etc.
Retail banking Wireless Cable
▪ Account opening
▪ Fees, rates, and
pricing
▪ Payments / transfers
▪ New card / mortgage
▪ Collections
▪ Lost / Stolen & Fraud
▪ Proactive selling1
▪ New activation
▪ Billing
▪ Feature / plan
change
▪ Suspend reconnect
▪ Device upgrade
▪ Device Repairs
▪ Network issues
▪ Proactive selling1
▪ Install
▪ Billing
▪ Rate changes
▪ Collections
▪ Package change
▪ Repairs
▪ Move
▪ Proactive selling1
These opportunities account for the bulk of either:
▪ Transaction costs, and/or
▪ Opportunities to drive incremental value (loyalty, upsell, etc.)
SOURCE: McKinsey & Co
McKinsey & Company | 11
Example: Customer journey analytics identify cost and CX
improvement opportunities for U.S. retail bank
▪ Large global bank; ~780MM multichannel customer interactions/year
▪ Looking for ways to decrease service costs while improving NPS
Context
Big data/
customer
journey
approach
Map key
journeys
and quality
check
1 Identify
pain-points
and root
causes
2 Assess value
at
stake, develo
p and
prioritize
initiatives
3 Continuous
-ly assess
impact with
KPIs/
dashboard
4
Expected impactExample insights
▪ ~2MM customers abandon web registration, 23%
of those call agent
▪ ~870MM calls/year after successful web payment
▪ ~510MM calls/year after abandoned web payment
▪ ~20% of callers setting up new account payment
unsuccessful at secondary verification (CVV, SSN)
▪ 45% of users initiating a chat call to speak with
an agent
20-30%
Call reduction/
cost
NPS improvement
Up to 60%
SOURCE: McKinsey & Co, ClickFox
McKinsey & Company | 12
McKinsey’s core beliefs on Big Data
Big Data is not about technology, but about the real-
time use of data in the front-line execution - Data
without execution does not bring any value
1
The most important success factor is the man-machine
interface and the decisions made by humans based on
analytic insights
2
Any Big Data solution has to be “business
first”, hypothesis driven, rather than trying to gather all
the data available – Half the battle is to identify and
eliminate the data that is irrelevant
3
No matter how incomplete your data is right now, you
can nevertheless use it better to create business value
through the use of Big Data tools – no “Apollo” project is
needed to get going
4
SOURCE: McKinsey & Co
McKinsey & Company | 13
Whom to contact
Dorian Stone - Partner
Vera Tkach
Maxence
Vancauwenberghe
Vera_Tkach@mckinsey.com
Maxence_Vancauwenberghe@
mckinsey.com
Dorian_Stone@mckinsey.com
CONFIDENTIAL AND PROPRIETARY | Any use of this material without specific permission of McKinsey & Company is strictly prohibited
Learn more on the Chief
Marketing & Sales
Officer Forum
1
www.cmsoforum.mckinsey.com
WWW
@McK_CMSOForum
www.youtube.com/McKinseyCMSOforum
marketingandsales@mckinsey.com
McKinsey & Company | 15
APPENDIX
McKinsey & Company | 16
The McKinsey / ClickFox partnership brings “Big data”
insights to action in a distinctive way
▪ Quick set up (weeks)
▪ Prioritization of data to
aggregate based on
business case
▪ Integrating customers and
touchpoint data in one single
datamart
▪ Millions of touchpoints data
ingested every day (4 bn p.a.
in total)
▪ Managing disparate
sources / messy data
▪ Automatic prioritization of
Journeys / pain points driving
cost, CSAT, churn with built-
in algorithms
▪ Ability to drill / surface root
causes of pain points
▪ Leverage of McKinsey
Advanced Analytics and
predictive modeling
(e.g., churn, NPTB)
▪ Design of target Journeys
with McKinsey benchmarks
(e.g., ICE) and expertise
▪ McKinsey transformation /
change approach – starting
from the top, down to the
“shopfloor,” and across silos
▪ Real time Journey
performance tracking, across
channels
▪ Test and learn with
immediate feedback
▪ Integration with CRM
systems / workflow
(e.g., customer outreach
alerts/ lists)
1. Stitching Journey data
across channels –
Everyday
3. Accelerating execution –
Real time
2. Surfacing actionable
insights – Fast

Customer Journey Analytics and Big Data

  • 1.
    Any use ofthis material without specific permission of McKinsey & Company is strictly prohibited McKinsey on Marketing & Sales – Slideshare Brief April 2013 Customer Journey Analytics and Big Data
  • 2.
    McKinsey & Company| 1 Across sectors, companies in the U.S. store at least 100 Terabytes of data – many have over 1 Petabyte . . . Average stored data per firm with more than 1,000 employees (Terabytes, 2009) 967 870 831 825 801 697 536 370 319 278 231 150 Discrete Manufacturing Securities and Investment Services Banking Communications and Media 1,312 3,866 1,931 1,792 Utilities 1,507 Government Healthcare Providers Education Professional Services Construction Consumer and Recreation Services Insurance Process Manufacturing Resource Industries Transportation Retail Wholesale WalMart data warehouse in 2004 ~500 TB Library of Congress collection in 2011 ~235 TB SOURCE: McKinsey Global Institute
  • 3.
    McKinsey & Company| 2 . . . and those that know how to use it have outperformed their respective markets and have created competitive advantage Percent Revenue 1999-2009 10-year CAGR EBITDA 1999-2009 10-year CAGR Financial Services IT Retail Consumer 11 10 6 4 13 20 8 10 19 9 6 6 7 8 6 6 Other companies Big Data leaders “Companies which are more data-driven are 5% more productive, and 6% more profitable” – MIT, Wharton, McKinsey, HBR SOURCE: Bloomberg; Datastream; annual reports; McKinsey analysis
  • 4.
    McKinsey & Company| 3 Value potential of Big Data affects virtually every part of the economy Wholesale trade Utilities Computer and electronic products Arts and Entertainment Educational services Real Estate and Rental Other Services Health Care Providers Construction Professional Services Natural resources Transportation and Warehousing Information Manufacturing Management of companies Financial Services and Insurance Government Admin, Support and Waste Management Accommodation and Food Retail trade Bubble sizes denote relative sizes of GDP High Low Big data value potential index1 High Low 1 Determined by industry average of transaction intensity, amount of data per firm, variability in performance, customer & supplier intensity, and turbulence Bigdataeaseofcaptureindex SOURCE: McKinsey Global Institute
  • 5.
    McKinsey & Company| 4 However, most companies face challenges with how to best extract real value out of Big Data Harnessing Big Data Driving to actionable insights rapidly Real-time execution 1 2 3 ▪ Massive volume, multiple sources and systems ▪ “Garbage-in / garbage-out” . . . data quality matters ▪ Knowing which data will drive impact ▪ Staying focused on priority business opportunities ▪ “Needle in a haystack” ▪ “Analysis Paralysis” ▪ Long wait and heavy analytical effort required ▪ Driving change across organizational silos ▪ Building the right capabilities infrastructure Typical challenges SOURCE: McKinsey & Co
  • 6.
    McKinsey & Company| 5 What is a Customer Journey, and how is it different? . . . an event that marks the defining experience of key life- cycles of a customer . . . defined around a discrete beginning and end across time . . . typically multi-touch, multi- channel and therefore cross- functional in nature . . . anchored in how customers think about it, not the way functional silos do Journeys represent an evolution in thinking over traditional touchpoint (or „moment‟) approaches A Journey is … Journeys are increasingly the way customers interact with companies of all customer interactions happen during a multi- event, multi-channel journey of all customer journeys involve more than one channel of interaction 56% 38% SOURCE: McKinsey & Co
  • 7.
    McKinsey & Company| 6 Customer Journey example Journey Touchpoint Example card on-boarding journey FAQs (agent) Retrieve customer ID/password (e-mail) Inquiry call (agent) FAQs (chat) Card activation (IVR) Rewards use (Web) Partner offers setup (Web) Feedback about experience (social media) Billing issue (chat) Opt-in alerts (mobile) Account info (mobile) Reposition mobile app (mobile) Credit increase request (agent) Retention call (agent) Payment (IVR) Autopay (IVR) Email Social & chat Retail/ branch Web Call center Field Mobile/ SMS CSAT data Set up a new account (branch) SOURCE: McKinsey & Co
  • 8.
    McKinsey & Company| 7 Journeys are 30-40% more predictive of customer satisfaction and churn Correlation analysis Correlation coefficient 0.43 0.530.53 0.23 0.58 0.65 0.58 0.52 +36% JourneysTouchpoints Customer satisfaction -0.25-0.26 -0.23 -0.33-0.33-0.32 +33% AverageAuto insuranceBankingPay TV Likelihood to cancel/churn SOURCE: McKinsey U.S. multi-industry survey
  • 9.
    McKinsey & Company| 8 6.0 6.4 6.8 7.2 7.6 8.0 8.4 6.0 6.2 6.4 6.6 6.8 7.0 7.2 7.4 7.6 7.8 Overall CSAT 2011 Journey satisfaction2 2011 I H J G F E D L K C B A Journey performers win in Customer Experience . . . and Growth Example: PayTV – Journeys winners are overall customer experience winners R2 = 53% vs. 14% for single touchpoints satisfaction -2% 0% 2% 4% 6% 8% 8.0 8.2 8.4 8.6 8.8 9.0 9.2 9.4 Journey satisfaction2 2011 N M E K C B A Revenue growth 2011 vs. 2010 Example: Auto Insurance, a 1/10 of a point in journey sat worth a full point of revenue growth ($200M on average) SOURCE McKinsey U.S. multi-industry survey
  • 10.
    McKinsey & Company| 9 . . . and drive substantial impact along all key business levers Impact Service operations 10% to 20% of customer service cost trapped between channels 15-20% Call/visit reduction Retention, cross/up-selling Journeys account for 5% to 20% of churn / sale Cross selling 10-20% 10-25bps Churn decrease Customer experience (CE) Journeys are 30% to 40% more predictive of CE than touch points CSAT lift 5-10 ppts 5-15% Cost avoidance Business lever SOURCE: McKinsey & Co
  • 11.
    McKinsey & Company| 10 In each industry, only a limited set of Journeys really matter 1 Includes promos, DMs, etc. Retail banking Wireless Cable ▪ Account opening ▪ Fees, rates, and pricing ▪ Payments / transfers ▪ New card / mortgage ▪ Collections ▪ Lost / Stolen & Fraud ▪ Proactive selling1 ▪ New activation ▪ Billing ▪ Feature / plan change ▪ Suspend reconnect ▪ Device upgrade ▪ Device Repairs ▪ Network issues ▪ Proactive selling1 ▪ Install ▪ Billing ▪ Rate changes ▪ Collections ▪ Package change ▪ Repairs ▪ Move ▪ Proactive selling1 These opportunities account for the bulk of either: ▪ Transaction costs, and/or ▪ Opportunities to drive incremental value (loyalty, upsell, etc.) SOURCE: McKinsey & Co
  • 12.
    McKinsey & Company| 11 Example: Customer journey analytics identify cost and CX improvement opportunities for U.S. retail bank ▪ Large global bank; ~780MM multichannel customer interactions/year ▪ Looking for ways to decrease service costs while improving NPS Context Big data/ customer journey approach Map key journeys and quality check 1 Identify pain-points and root causes 2 Assess value at stake, develo p and prioritize initiatives 3 Continuous -ly assess impact with KPIs/ dashboard 4 Expected impactExample insights ▪ ~2MM customers abandon web registration, 23% of those call agent ▪ ~870MM calls/year after successful web payment ▪ ~510MM calls/year after abandoned web payment ▪ ~20% of callers setting up new account payment unsuccessful at secondary verification (CVV, SSN) ▪ 45% of users initiating a chat call to speak with an agent 20-30% Call reduction/ cost NPS improvement Up to 60% SOURCE: McKinsey & Co, ClickFox
  • 13.
    McKinsey & Company| 12 McKinsey’s core beliefs on Big Data Big Data is not about technology, but about the real- time use of data in the front-line execution - Data without execution does not bring any value 1 The most important success factor is the man-machine interface and the decisions made by humans based on analytic insights 2 Any Big Data solution has to be “business first”, hypothesis driven, rather than trying to gather all the data available – Half the battle is to identify and eliminate the data that is irrelevant 3 No matter how incomplete your data is right now, you can nevertheless use it better to create business value through the use of Big Data tools – no “Apollo” project is needed to get going 4 SOURCE: McKinsey & Co
  • 14.
    McKinsey & Company| 13 Whom to contact Dorian Stone - Partner Vera Tkach Maxence Vancauwenberghe Vera_Tkach@mckinsey.com Maxence_Vancauwenberghe@ mckinsey.com Dorian_Stone@mckinsey.com
  • 15.
    CONFIDENTIAL AND PROPRIETARY| Any use of this material without specific permission of McKinsey & Company is strictly prohibited Learn more on the Chief Marketing & Sales Officer Forum 1 www.cmsoforum.mckinsey.com WWW @McK_CMSOForum www.youtube.com/McKinseyCMSOforum marketingandsales@mckinsey.com
  • 16.
    McKinsey & Company| 15 APPENDIX
  • 17.
    McKinsey & Company| 16 The McKinsey / ClickFox partnership brings “Big data” insights to action in a distinctive way ▪ Quick set up (weeks) ▪ Prioritization of data to aggregate based on business case ▪ Integrating customers and touchpoint data in one single datamart ▪ Millions of touchpoints data ingested every day (4 bn p.a. in total) ▪ Managing disparate sources / messy data ▪ Automatic prioritization of Journeys / pain points driving cost, CSAT, churn with built- in algorithms ▪ Ability to drill / surface root causes of pain points ▪ Leverage of McKinsey Advanced Analytics and predictive modeling (e.g., churn, NPTB) ▪ Design of target Journeys with McKinsey benchmarks (e.g., ICE) and expertise ▪ McKinsey transformation / change approach – starting from the top, down to the “shopfloor,” and across silos ▪ Real time Journey performance tracking, across channels ▪ Test and learn with immediate feedback ▪ Integration with CRM systems / workflow (e.g., customer outreach alerts/ lists) 1. Stitching Journey data across channels – Everyday 3. Accelerating execution – Real time 2. Surfacing actionable insights – Fast