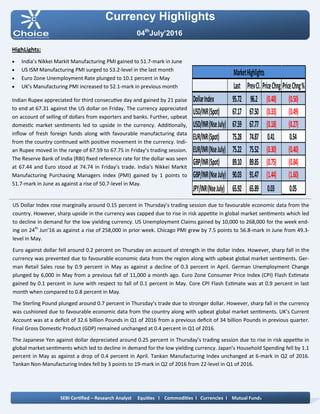
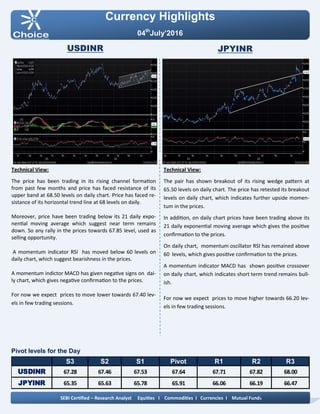
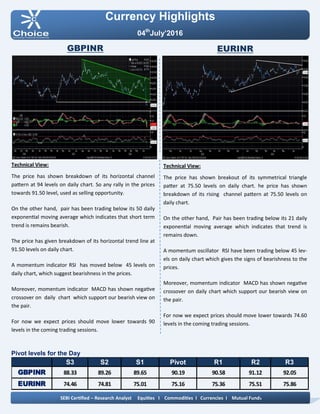
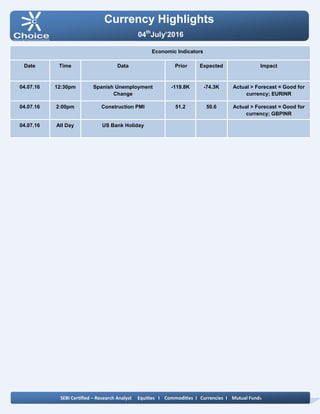
Currency Highlights
04th
July’2016
HighLights:
 India’s Nikkei Markit Manufacturing PMI gained to 51.7-mark in June
 US ISM Manufacturing PMI surged to 53.2-level in the last month
 Euro Zone Unemployment Rate plunged to 10.1 percent in May
 UK’s Manufacturing PMI increased to 52.1-mark in previous month
Indian Rupee appreciated for third consecutive day and gained by 21 paise
to end at 67.31 against the US dollar on Friday. The currency appreciated
on account of selling of dollars from exporters and banks. Further, upbeat
domestic market sentiments led to upside in the currency. Additionally,
inflow of fresh foreign funds along with favourable manufacturing data
from the country continued with positive movement in the currency. Indi-
an Rupee moved in the range of 67.59 to 67.75 in Friday’s trading session.
The Reserve Bank of India (RBI) fixed reference rate for the dollar was seen
at 67.44 and Euro stood at 74.74 in Friday’s trade. India’s Nikkei Markit
Manufacturing Purchasing Managers Index (PMI) gained by 1 points to
51.7-mark in June as against a rise of 50.7-level in May.
US Dollar Index rose marginally around 0.15 percent in Thursday’s trading session due to favourable economic data from the
country. However, sharp upside in the currency was capped due to rise in risk appetite in global market sentiments which led
to decline in demand for the low yielding currency. US Unemployment Claims gained by 10,000 to 268,000 for the week end-
ing on 24th
Jun’16 as against a rise of 258,000 in prior week. Chicago PMI grew by 7.5 points to 56.8-mark in June from 49.3-
level in May.
Euro against dollar fell around 0.2 percent on Thursday on account of strength in the dollar index. However, sharp fall in the
currency was prevented due to favourable economic data from the region along with upbeat global market sentiments. Ger-
man Retail Sales rose by 0.9 percent in May as against a decline of 0.3 percent in April. German Unemployment Change
plunged by 6,000 in May from a previous fall of 11,000 a month ago. Euro Zone Consumer Price Index (CPI) Flash Estimate
gained by 0.1 percent in June with respect to fall of 0.1 percent in May. Core CPI Flash Estimate was at 0.9 percent in last
month when compared to 0.8 percent in May.
The Sterling Pound plunged around 0.7 percent in Thursday’s trade due to stronger dollar. However, sharp fall in the currency
was cushioned due to favourable economic data from the country along with upbeat global market sentiments. UK’s Current
Account was at a deficit of 32.6 billion Pounds in Q1 of 2016 from a previous deficit of 34 billion Pounds in previous quarter.
Final Gross Domestic Product (GDP) remained unchanged at 0.4 percent in Q1 of 2016.
The Japanese Yen against dollar depreciated around 0.25 percent in Thursday’s trading session due to rise in risk appetite in
global market sentiments which led to decline in demand for the low yielding currency. Japan’s Household Spending fell by 1.1
percent in May as against a drop of 0.4 percent in April. Tankan Manufacturing Index unchanged at 6-mark in Q2 of 2016.
Tankan Non-Manufacturing Index fell by 3 points to 19-mark in Q2 of 2016 from 22-level in Q1 of 2016.
SEBI Certified – Research Analyst Equities I Commodities I Currencies I Mutual Funds
Last PrevCl. PriceChng PriceChng%
DollarIndex 95.72 96.2 (0.48) (0.50)
USD/INR(Spot) 67.17 67.50 (0.33) (0.49)
USD/INR(NseJuly) 67.59 67.77 (0.18) (0.27)
EUR/INR(Spot) 75.28 74.87 0.41 0.54
EUR/INR(NseJuly) 75.22 75.52 (0.30) (0.40)
GBP/INR(Spot) 89.10 89.85 (0.75) (0.84)
GBP/INR(NseJuly) 90.03 91.47 (1.44) (1.60)
JPY/INR(NseJuly) 65.92 65.89 0.03 0.05
MarketHighlights
Technical View:
The pair has shown breakout of its rising wedge pattern at
65.50 levels on daily chart. The price has retested its breakout
levels on daily chart, which indicates further upside momen-
tum in the prices.
In addition, on daily chart prices have been trading above its
21 daily exponential moving average which gives the positive
confirmation to the prices.
On daily chart, momentum oscillator RSI has remained above
60 levels, which gives positive confirmation to the prices.
A momentum indicator MACD has shown positive crossover
on daily chart, which indicates short term trend remains bull-
ish.
For now we expect prices to move higher towards 66.20 lev-
els in few trading sessions.
Pivot levels for the Day
Technical View:
The price has been trading in its rising channel formation
from past few months and price has faced resistance of its
upper band at 68.50 levels on daily chart. Price has faced re-
sistance of its horizontal trend line at 68 levels on daily.
Moreover, price have been trading below its 21 daily expo-
nential moving average which suggest near term remains
down. So any rally in the prices towards 67.85 level, used as
selling opportunity.
A momentum indicator RSI has moved below 60 levels on
daily chart, which suggest bearishness in the prices.
A momentum indictor MACD has given negative signs on dai-
ly chart, which gives negative confirmation to the prices.
For now we expect prices to move lower towards 67.40 lev-
els in few trading sessions.
Currency Highlights
04th
July’2016
USDINR JPYINR
SEBI Certified – Research Analyst Equities I Commodities I Currencies I Mutual Funds
S3 S2 S1 Pivot R1 R2 R3
USDINR 67.28 67.46 67.53 67.64 67.71 67.82 68.00
JPYINR 65.35 65.63 65.78 65.91 66.06 66.19 66.47
Pivot levels for the Day
Currency Highlights
04th
July’2016
GBPINR EURINR
Technical View:
The price has shown breakout of its symmetrical triangle
patter at 75.50 levels on daily chart. he price has shown
breakdown of its rising channel pattern at 75.50 levels on
daily chart.
On the other hand, Pair has been trading below its 21 daily
exponential moving average which indicates that trend is
remains down.
A momentum oscillator RSI have been trading below 45 lev-
els on daily chart which gives the signs of bearishness to the
prices.
Moreover, momentum indicator MACD has shown negative
crossover on daily chart which support our bearish view on
the pair.
For now we expect prices should move lower towards 74.60
levels in the coming trading sessions.
Technical View:
The price has shown breakdown of its horizontal channel
pattern at 94 levels on daily chart. So any rally in the prices
towards 91.50 level, used as selling opportunity.
On the other hand, pair has been trading below its 50 daily
exponential moving average which indicates that short term
trend is remains bearish.
The price has given breakdown of its horizontal trend line at
91.50 levels on daily chart.
A momentum indicator RSI has moved below 45 levels on
daily chart, which suggest bearishness in the prices.
Moreover, momentum indicator MACD has shown negative
crossover on daily chart which support our bearish view on
the pair.
For now we expect prices should move lower towards 90
levels in the coming trading sessions.
SEBI Certified – Research Analyst Equities I Commodities I Currencies I Mutual Funds
S3 S2 S1 Pivot R1 R2 R3
GBPINR 88.33 89.26 89.65 90.19 90.58 91.12 92.05
EURINR 74.46 74.81 75.01 75.16 75.36 75.51 75.86
Currency Highlights
SEBI Certified – Research Analyst Equities I Commodities I Currencies I Mutual Funds
Economic Indicators
Date Time Data Prior Expected Impact
04.07.16 12:30pm Spanish Unemployment
Change
-119.8K -74.3K Actual > Forecast = Good for
currency; EURINR
04.07.16 2:00pm Construction PMI 51.2 50.6 Actual > Forecast = Good for
currency; GBPINR
04.07.16 All Day US Bank Holiday
04th
July’2016
Currency Highlights
04th
July’2016
SEBI Certified – Research Analyst Equities I Commodities I Currencies I Mutual Funds
Amit Pathania
Digitally signed by Amit Pathania
DN: cn=Amit Pathania, o=Choice Equity Broking Pvt. ltd, ou=Research
Department, email=amit.pathania@choiceindia.com, c=IN
Date: 2016.07.04 08:49:53 +05'30'

Currency high lights 04.07.16

  • 1.
    Currency Highlights 04th July’2016 HighLights:  India’sNikkei Markit Manufacturing PMI gained to 51.7-mark in June  US ISM Manufacturing PMI surged to 53.2-level in the last month  Euro Zone Unemployment Rate plunged to 10.1 percent in May  UK’s Manufacturing PMI increased to 52.1-mark in previous month Indian Rupee appreciated for third consecutive day and gained by 21 paise to end at 67.31 against the US dollar on Friday. The currency appreciated on account of selling of dollars from exporters and banks. Further, upbeat domestic market sentiments led to upside in the currency. Additionally, inflow of fresh foreign funds along with favourable manufacturing data from the country continued with positive movement in the currency. Indi- an Rupee moved in the range of 67.59 to 67.75 in Friday’s trading session. The Reserve Bank of India (RBI) fixed reference rate for the dollar was seen at 67.44 and Euro stood at 74.74 in Friday’s trade. India’s Nikkei Markit Manufacturing Purchasing Managers Index (PMI) gained by 1 points to 51.7-mark in June as against a rise of 50.7-level in May. US Dollar Index rose marginally around 0.15 percent in Thursday’s trading session due to favourable economic data from the country. However, sharp upside in the currency was capped due to rise in risk appetite in global market sentiments which led to decline in demand for the low yielding currency. US Unemployment Claims gained by 10,000 to 268,000 for the week end- ing on 24th Jun’16 as against a rise of 258,000 in prior week. Chicago PMI grew by 7.5 points to 56.8-mark in June from 49.3- level in May. Euro against dollar fell around 0.2 percent on Thursday on account of strength in the dollar index. However, sharp fall in the currency was prevented due to favourable economic data from the region along with upbeat global market sentiments. Ger- man Retail Sales rose by 0.9 percent in May as against a decline of 0.3 percent in April. German Unemployment Change plunged by 6,000 in May from a previous fall of 11,000 a month ago. Euro Zone Consumer Price Index (CPI) Flash Estimate gained by 0.1 percent in June with respect to fall of 0.1 percent in May. Core CPI Flash Estimate was at 0.9 percent in last month when compared to 0.8 percent in May. The Sterling Pound plunged around 0.7 percent in Thursday’s trade due to stronger dollar. However, sharp fall in the currency was cushioned due to favourable economic data from the country along with upbeat global market sentiments. UK’s Current Account was at a deficit of 32.6 billion Pounds in Q1 of 2016 from a previous deficit of 34 billion Pounds in previous quarter. Final Gross Domestic Product (GDP) remained unchanged at 0.4 percent in Q1 of 2016. The Japanese Yen against dollar depreciated around 0.25 percent in Thursday’s trading session due to rise in risk appetite in global market sentiments which led to decline in demand for the low yielding currency. Japan’s Household Spending fell by 1.1 percent in May as against a drop of 0.4 percent in April. Tankan Manufacturing Index unchanged at 6-mark in Q2 of 2016. Tankan Non-Manufacturing Index fell by 3 points to 19-mark in Q2 of 2016 from 22-level in Q1 of 2016. SEBI Certified – Research Analyst Equities I Commodities I Currencies I Mutual Funds Last PrevCl. PriceChng PriceChng% DollarIndex 95.72 96.2 (0.48) (0.50) USD/INR(Spot) 67.17 67.50 (0.33) (0.49) USD/INR(NseJuly) 67.59 67.77 (0.18) (0.27) EUR/INR(Spot) 75.28 74.87 0.41 0.54 EUR/INR(NseJuly) 75.22 75.52 (0.30) (0.40) GBP/INR(Spot) 89.10 89.85 (0.75) (0.84) GBP/INR(NseJuly) 90.03 91.47 (1.44) (1.60) JPY/INR(NseJuly) 65.92 65.89 0.03 0.05 MarketHighlights
  • 2.
    Technical View: The pairhas shown breakout of its rising wedge pattern at 65.50 levels on daily chart. The price has retested its breakout levels on daily chart, which indicates further upside momen- tum in the prices. In addition, on daily chart prices have been trading above its 21 daily exponential moving average which gives the positive confirmation to the prices. On daily chart, momentum oscillator RSI has remained above 60 levels, which gives positive confirmation to the prices. A momentum indicator MACD has shown positive crossover on daily chart, which indicates short term trend remains bull- ish. For now we expect prices to move higher towards 66.20 lev- els in few trading sessions. Pivot levels for the Day Technical View: The price has been trading in its rising channel formation from past few months and price has faced resistance of its upper band at 68.50 levels on daily chart. Price has faced re- sistance of its horizontal trend line at 68 levels on daily. Moreover, price have been trading below its 21 daily expo- nential moving average which suggest near term remains down. So any rally in the prices towards 67.85 level, used as selling opportunity. A momentum indicator RSI has moved below 60 levels on daily chart, which suggest bearishness in the prices. A momentum indictor MACD has given negative signs on dai- ly chart, which gives negative confirmation to the prices. For now we expect prices to move lower towards 67.40 lev- els in few trading sessions. Currency Highlights 04th July’2016 USDINR JPYINR SEBI Certified – Research Analyst Equities I Commodities I Currencies I Mutual Funds S3 S2 S1 Pivot R1 R2 R3 USDINR 67.28 67.46 67.53 67.64 67.71 67.82 68.00 JPYINR 65.35 65.63 65.78 65.91 66.06 66.19 66.47
  • 3.
    Pivot levels forthe Day Currency Highlights 04th July’2016 GBPINR EURINR Technical View: The price has shown breakout of its symmetrical triangle patter at 75.50 levels on daily chart. he price has shown breakdown of its rising channel pattern at 75.50 levels on daily chart. On the other hand, Pair has been trading below its 21 daily exponential moving average which indicates that trend is remains down. A momentum oscillator RSI have been trading below 45 lev- els on daily chart which gives the signs of bearishness to the prices. Moreover, momentum indicator MACD has shown negative crossover on daily chart which support our bearish view on the pair. For now we expect prices should move lower towards 74.60 levels in the coming trading sessions. Technical View: The price has shown breakdown of its horizontal channel pattern at 94 levels on daily chart. So any rally in the prices towards 91.50 level, used as selling opportunity. On the other hand, pair has been trading below its 50 daily exponential moving average which indicates that short term trend is remains bearish. The price has given breakdown of its horizontal trend line at 91.50 levels on daily chart. A momentum indicator RSI has moved below 45 levels on daily chart, which suggest bearishness in the prices. Moreover, momentum indicator MACD has shown negative crossover on daily chart which support our bearish view on the pair. For now we expect prices should move lower towards 90 levels in the coming trading sessions. SEBI Certified – Research Analyst Equities I Commodities I Currencies I Mutual Funds S3 S2 S1 Pivot R1 R2 R3 GBPINR 88.33 89.26 89.65 90.19 90.58 91.12 92.05 EURINR 74.46 74.81 75.01 75.16 75.36 75.51 75.86
  • 4.
    Currency Highlights SEBI Certified– Research Analyst Equities I Commodities I Currencies I Mutual Funds Economic Indicators Date Time Data Prior Expected Impact 04.07.16 12:30pm Spanish Unemployment Change -119.8K -74.3K Actual > Forecast = Good for currency; EURINR 04.07.16 2:00pm Construction PMI 51.2 50.6 Actual > Forecast = Good for currency; GBPINR 04.07.16 All Day US Bank Holiday 04th July’2016
  • 5.
    Currency Highlights 04th July’2016 SEBI Certified– Research Analyst Equities I Commodities I Currencies I Mutual Funds Amit Pathania Digitally signed by Amit Pathania DN: cn=Amit Pathania, o=Choice Equity Broking Pvt. ltd, ou=Research Department, email=amit.pathania@choiceindia.com, c=IN Date: 2016.07.04 08:49:53 +05'30'