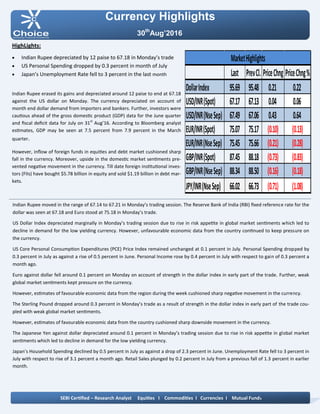
Currency Highlights
30th
Aug’2016
HighLights:
 Indian Rupee depreciated by 12 paise to 67.18 in Monday’s trade
 US Personal Spending dropped by 0.3 percent in month of July
 Japan’s Unemployment Rate fell to 3 percent in the last month
Indian Rupee erased its gains and depreciated around 12 paise to end at 67.18
against the US dollar on Monday. The currency depreciated on account of
month end dollar demand from importers and bankers. Further, investors were
cautious ahead of the gross domestic product (GDP) data for the June quarter
and fiscal deficit data for July on 31st
Aug’16. According to Bloomberg analyst
estimates, GDP may be seen at 7.5 percent from 7.9 percent in the March
quarter.
However, inflow of foreign funds in equities and debt market cushioned sharp
fall in the currency. Moreover, upside in the domestic market sentiments pre-
vented negative movement in the currency. Till date foreign institutional inves-
tors (FIIs) have bought $5.78 billion in equity and sold $1.19 billion in debt mar-
kets.
Indian Rupee moved in the range of 67.14 to 67.21 in Monday’s trading session. The Reserve Bank of India (RBI) fixed reference rate for the
dollar was seen at 67.18 and Euro stood at 75.18 in Monday’s trade.
US Dollar Index depreciated marginally in Monday’s trading session due to rise in risk appetite in global market sentiments which led to
decline in demand for the low yielding currency. However, unfavourable economic data from the country continued to keep pressure on
the currency.
US Core Personal Consumption Expenditures (PCE) Price Index remained unchanged at 0.1 percent in July. Personal Spending dropped by
0.3 percent in July as against a rise of 0.5 percent in June. Personal Income rose by 0.4 percent in July with respect to gain of 0.3 percent a
month ago.
Euro against dollar fell around 0.1 percent on Monday on account of strength in the dollar index in early part of the trade. Further, weak
global market sentiments kept pressure on the currency.
However, estimates of favourable economic data from the region during the week cushioned sharp negative movement in the currency.
The Sterling Pound dropped around 0.3 percent in Monday’s trade as a result of strength in the dollar index in early part of the trade cou-
pled with weak global market sentiments.
However, estimates of favourable economic data from the country cushioned sharp downside movement in the currency.
The Japanese Yen against dollar depreciated around 0.1 percent in Monday’s trading session due to rise in risk appetite in global market
sentiments which led to decline in demand for the low yielding currency.
Japan’s Household Spending declined by 0.5 percent in July as against a drop of 2.3 percent in June. Unemployment Rate fell to 3 percent in
July with respect to rise of 3.1 percent a month ago. Retail Sales plunged by 0.2 percent in July from a previous fall of 1.3 percent in earlier
month.
SEBI Certified – Research Analyst Equities I Commodities I Currencies I Mutual Funds
Last PrevCl. PriceChng PriceChng%
DollarIndex 95.69 95.48 0.21 0.22
USD/INR(Spot) 67.17 67.13 0.04 0.06
USD/INR(NseSep) 67.49 67.06 0.43 0.64
EUR/INR(Spot) 75.07 75.17 (0.10) (0.13)
EUR/INR(NseSep) 75.45 75.66 (0.21) (0.28)
GBP/INR(Spot) 87.45 88.18 (0.73) (0.83)
GBP/INR(NseSep) 88.34 88.50 (0.16) (0.18)
JPY/INR(NseSep) 66.02 66.73 (0.71) (1.08)
MarketHighlights
Technical View:
The prices have been trading in falling channel pattern and
prices have been facing resistance of upper band of channel
pattern 67 levels on daily chart. The price has formed double
top formation on daily chart.
The pair has faced résistance of horizontal trend line at 67.05
levels on daily chart.
Moreover, prices have been trading below its 21 HEMA on
hourly chart, which indicates short term trend remains down.
On daily chart, momentum oscillator RSI has faced resistance
at 65 levels, which gives negative confirmation to the prices.
For now we expect prices to move lower towards 66.20 levels
in few trading sessions.
Pivot levels for the Day
Technical View:
price have been trading above its 21 , 50, 100, 200 daily ex-
ponential moving average which is act as short term support.
So any any deep 67.60 level, used as Buying opportunity.
The price has given breakdown of its rising channel pattern at
67.20 levels and price has retested the lower trend line 67.17
levels on daily chart. On the other hand prices have been fac-
ing resistance of horizontal trend line at 67.20 levels on daily
chart.
Moreover, A momentum indicator RSI reading at 55 level &
it has remained above 50 levels on daily chart, which suggest
bullish momentum in the prices.
For now we expect prices to move good up side moment in
few trading sessions.
Currency Highlights
30th
Aug’2016
USDINR JPYINR
SEBI Certified – Research Analyst Equities I Commodities I Currencies I Mutual Funds
S3 S2 S1 Pivot R1 R2 R3
USDINR 67.23 67.35 67.42 67.47 67.54 67.59 67.71
JPYINR 65.14 65.61 65.82 66.08 66.29 66.55 67.02
Pivot levels for the Day
Currency Highlights
30th
Aug’2016
GBPINR EURINR
Technical View:
The prices have been trading in descending triangle pattern
from past few weeks and prices has faced resistance of its
upper band of triangle pattern at 76 levels on daily chart.
On the other hand, Pair has been trading below its 21 hourly
exponential moving average which indicates that trend is
turned into bearish.
A momentum oscillator RSI have been trading below 60 lev-
els on daily chart which gives the signs of bearish to the pric-
es.
Moreover, momentum indicator MACD has shown negative
sign on daily chart which support our bearish view on the
pair.
For now we expect prices should move lower towards 74.60
levels in the coming trading sessions.
Technical View:
The price has been trading in descending triangle formation
from past weeks and prices have been facing resistance of its
upper bad of triangle at 88.20 levels on daily chart. Any
movement can be if prices shown breakout above falling tre
nd line at 89 levels.
The prices have been trading below its 50 DEMA, which sug-
gest short term trend is down.
A momentum indicator RSI has remained below 50 levels on
daily chart, which suggest bearishness in the prices.
Moreover, momentum indicator MACD has shown negative
sign on daily chart which support our bearish view on the
pair.
For now we expect prices should move lower towards 87.80
levels in the coming trading sessions.
SEBI Certified – Research Analyst Equities I Commodities I Currencies I Mutual Funds
S3 S2 S1 Pivot R1 R2 R3
GBPINR 87.60 88.05 88.19 88.50 88.64 88.95 89.40
EURINR 73.82 74.72 74.89 75.62 75.79 76.52 77.42
Currency Highlights
SEBI Certified – Research Analyst Equities I Commodities I Currencies I Mutual Funds
Economic Indicators
Date Time Data Prior Expected Impact
30.08.16 5:00 AM Household Spending y/y -2.2% -1.3% Actual > Forecast = Good
for currency; JPYINR
30.08.16 All Day German Prelim CPI m/m 0.3% 0.1% Actual > Forecast = Good
for currency; EURINR
30.08.16 12:30 PM Spanish Flash CPI y/y -0.6% -0.5% Actual > Forecast = Good
for currency; EURINR
30.08.16 2:00 PM Net Lending to Individuals
m/m
5.2B 4.9B Actual > Forecast = Good
for currency; GBPINR
30.08.16 7:30PM CB Consumer Confidence 97.3 97.2 Actual > Forecast = Good
for currency; USDINR
30th
Aug’2016
Currency Highlights
30th
Aug’2016
SEBI Certified – Research Analyst Equities I Commodities I Currencies I Mutual Funds
Vikas Chaudhari
Digitally signed by Vikas Chaudhari
DN: cn=Vikas Chaudhari, o=Choice Equity
Broking Pvt Ltd, ou=Research Department,
email=vikas.chaudhari@choiceindia.com, c=IN
Date: 2016.08.30 08:51:05 +05'30'

Currency high lights 30.08.16

  • 1.
    Currency Highlights 30th Aug’2016 HighLights:  IndianRupee depreciated by 12 paise to 67.18 in Monday’s trade  US Personal Spending dropped by 0.3 percent in month of July  Japan’s Unemployment Rate fell to 3 percent in the last month Indian Rupee erased its gains and depreciated around 12 paise to end at 67.18 against the US dollar on Monday. The currency depreciated on account of month end dollar demand from importers and bankers. Further, investors were cautious ahead of the gross domestic product (GDP) data for the June quarter and fiscal deficit data for July on 31st Aug’16. According to Bloomberg analyst estimates, GDP may be seen at 7.5 percent from 7.9 percent in the March quarter. However, inflow of foreign funds in equities and debt market cushioned sharp fall in the currency. Moreover, upside in the domestic market sentiments pre- vented negative movement in the currency. Till date foreign institutional inves- tors (FIIs) have bought $5.78 billion in equity and sold $1.19 billion in debt mar- kets. Indian Rupee moved in the range of 67.14 to 67.21 in Monday’s trading session. The Reserve Bank of India (RBI) fixed reference rate for the dollar was seen at 67.18 and Euro stood at 75.18 in Monday’s trade. US Dollar Index depreciated marginally in Monday’s trading session due to rise in risk appetite in global market sentiments which led to decline in demand for the low yielding currency. However, unfavourable economic data from the country continued to keep pressure on the currency. US Core Personal Consumption Expenditures (PCE) Price Index remained unchanged at 0.1 percent in July. Personal Spending dropped by 0.3 percent in July as against a rise of 0.5 percent in June. Personal Income rose by 0.4 percent in July with respect to gain of 0.3 percent a month ago. Euro against dollar fell around 0.1 percent on Monday on account of strength in the dollar index in early part of the trade. Further, weak global market sentiments kept pressure on the currency. However, estimates of favourable economic data from the region during the week cushioned sharp negative movement in the currency. The Sterling Pound dropped around 0.3 percent in Monday’s trade as a result of strength in the dollar index in early part of the trade cou- pled with weak global market sentiments. However, estimates of favourable economic data from the country cushioned sharp downside movement in the currency. The Japanese Yen against dollar depreciated around 0.1 percent in Monday’s trading session due to rise in risk appetite in global market sentiments which led to decline in demand for the low yielding currency. Japan’s Household Spending declined by 0.5 percent in July as against a drop of 2.3 percent in June. Unemployment Rate fell to 3 percent in July with respect to rise of 3.1 percent a month ago. Retail Sales plunged by 0.2 percent in July from a previous fall of 1.3 percent in earlier month. SEBI Certified – Research Analyst Equities I Commodities I Currencies I Mutual Funds Last PrevCl. PriceChng PriceChng% DollarIndex 95.69 95.48 0.21 0.22 USD/INR(Spot) 67.17 67.13 0.04 0.06 USD/INR(NseSep) 67.49 67.06 0.43 0.64 EUR/INR(Spot) 75.07 75.17 (0.10) (0.13) EUR/INR(NseSep) 75.45 75.66 (0.21) (0.28) GBP/INR(Spot) 87.45 88.18 (0.73) (0.83) GBP/INR(NseSep) 88.34 88.50 (0.16) (0.18) JPY/INR(NseSep) 66.02 66.73 (0.71) (1.08) MarketHighlights
  • 2.
    Technical View: The priceshave been trading in falling channel pattern and prices have been facing resistance of upper band of channel pattern 67 levels on daily chart. The price has formed double top formation on daily chart. The pair has faced résistance of horizontal trend line at 67.05 levels on daily chart. Moreover, prices have been trading below its 21 HEMA on hourly chart, which indicates short term trend remains down. On daily chart, momentum oscillator RSI has faced resistance at 65 levels, which gives negative confirmation to the prices. For now we expect prices to move lower towards 66.20 levels in few trading sessions. Pivot levels for the Day Technical View: price have been trading above its 21 , 50, 100, 200 daily ex- ponential moving average which is act as short term support. So any any deep 67.60 level, used as Buying opportunity. The price has given breakdown of its rising channel pattern at 67.20 levels and price has retested the lower trend line 67.17 levels on daily chart. On the other hand prices have been fac- ing resistance of horizontal trend line at 67.20 levels on daily chart. Moreover, A momentum indicator RSI reading at 55 level & it has remained above 50 levels on daily chart, which suggest bullish momentum in the prices. For now we expect prices to move good up side moment in few trading sessions. Currency Highlights 30th Aug’2016 USDINR JPYINR SEBI Certified – Research Analyst Equities I Commodities I Currencies I Mutual Funds S3 S2 S1 Pivot R1 R2 R3 USDINR 67.23 67.35 67.42 67.47 67.54 67.59 67.71 JPYINR 65.14 65.61 65.82 66.08 66.29 66.55 67.02
  • 3.
    Pivot levels forthe Day Currency Highlights 30th Aug’2016 GBPINR EURINR Technical View: The prices have been trading in descending triangle pattern from past few weeks and prices has faced resistance of its upper band of triangle pattern at 76 levels on daily chart. On the other hand, Pair has been trading below its 21 hourly exponential moving average which indicates that trend is turned into bearish. A momentum oscillator RSI have been trading below 60 lev- els on daily chart which gives the signs of bearish to the pric- es. Moreover, momentum indicator MACD has shown negative sign on daily chart which support our bearish view on the pair. For now we expect prices should move lower towards 74.60 levels in the coming trading sessions. Technical View: The price has been trading in descending triangle formation from past weeks and prices have been facing resistance of its upper bad of triangle at 88.20 levels on daily chart. Any movement can be if prices shown breakout above falling tre nd line at 89 levels. The prices have been trading below its 50 DEMA, which sug- gest short term trend is down. A momentum indicator RSI has remained below 50 levels on daily chart, which suggest bearishness in the prices. Moreover, momentum indicator MACD has shown negative sign on daily chart which support our bearish view on the pair. For now we expect prices should move lower towards 87.80 levels in the coming trading sessions. SEBI Certified – Research Analyst Equities I Commodities I Currencies I Mutual Funds S3 S2 S1 Pivot R1 R2 R3 GBPINR 87.60 88.05 88.19 88.50 88.64 88.95 89.40 EURINR 73.82 74.72 74.89 75.62 75.79 76.52 77.42
  • 4.
    Currency Highlights SEBI Certified– Research Analyst Equities I Commodities I Currencies I Mutual Funds Economic Indicators Date Time Data Prior Expected Impact 30.08.16 5:00 AM Household Spending y/y -2.2% -1.3% Actual > Forecast = Good for currency; JPYINR 30.08.16 All Day German Prelim CPI m/m 0.3% 0.1% Actual > Forecast = Good for currency; EURINR 30.08.16 12:30 PM Spanish Flash CPI y/y -0.6% -0.5% Actual > Forecast = Good for currency; EURINR 30.08.16 2:00 PM Net Lending to Individuals m/m 5.2B 4.9B Actual > Forecast = Good for currency; GBPINR 30.08.16 7:30PM CB Consumer Confidence 97.3 97.2 Actual > Forecast = Good for currency; USDINR 30th Aug’2016
  • 5.
    Currency Highlights 30th Aug’2016 SEBI Certified– Research Analyst Equities I Commodities I Currencies I Mutual Funds Vikas Chaudhari Digitally signed by Vikas Chaudhari DN: cn=Vikas Chaudhari, o=Choice Equity Broking Pvt Ltd, ou=Research Department, email=vikas.chaudhari@choiceindia.com, c=IN Date: 2016.08.30 08:51:05 +05'30'