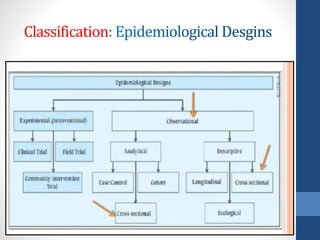
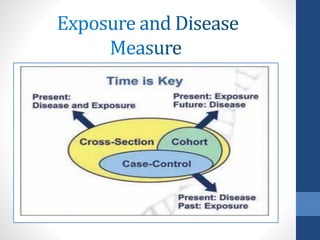
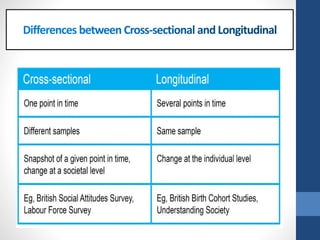
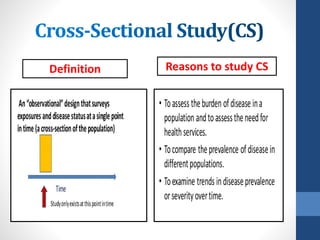
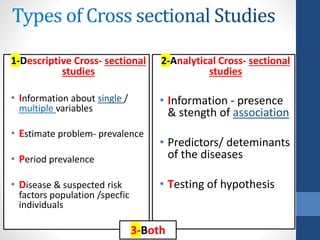
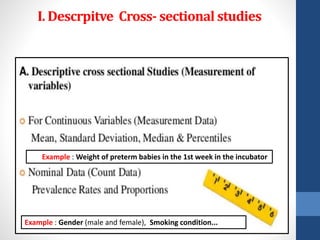
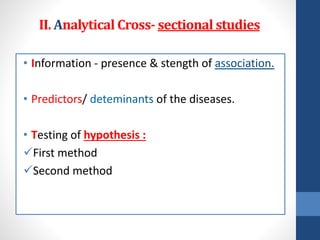
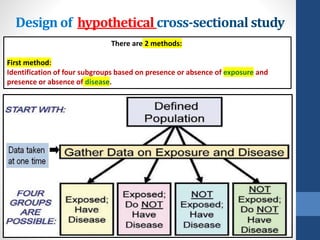
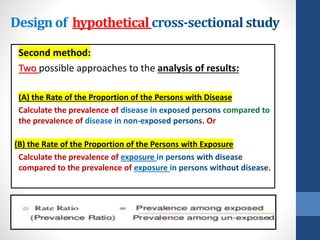
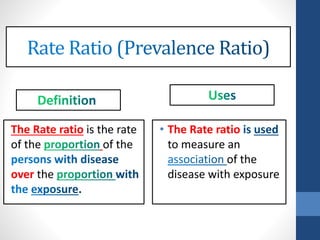
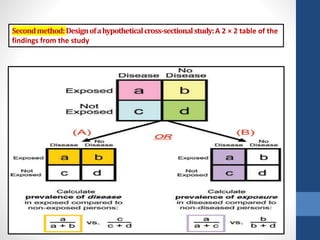
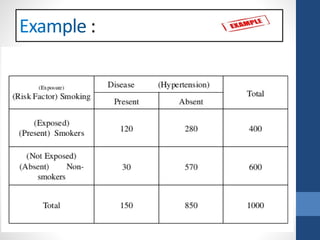
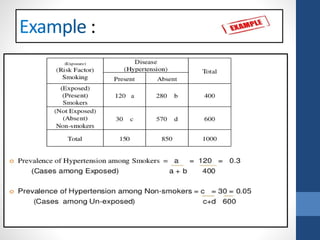
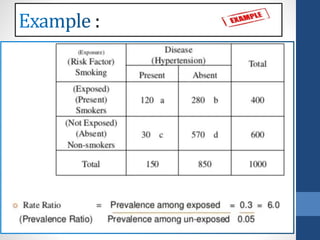
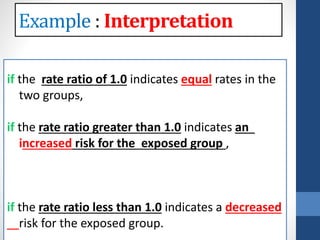
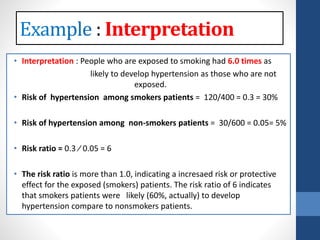
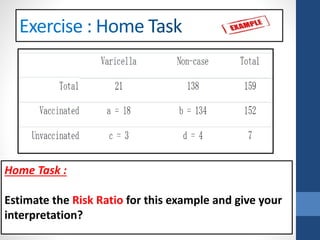
Cross-Sectional
Studies
Dr. Faiza Abou El-Soud
Professor- Community Health Nursing
Menoufiya University-Egypt
➢Define cross-sectional study design
➢Reason to use cross-sectional study design
➢Different items between cross-sectional and longitudinal study.
➢Discuss types of the cross-sectional studies
➢identify the design of a hypothetical cross-sectional study
➢Identify advantages of cross-sectional study design
➢Discuss disadvantages of cross-sectional study design
Classification
Definition Reasons to study CS
1-Descriptive Cross- sectional
studies
• Information about /
variables
• Estimate problem- prevalence
• Period prevalence
• Disease & suspected risk
factors population /specfic
individuals
2-Analytical Cross- sectional
studies
• Information - presence
& stength of
• Predictors/ deteminants
of the diseases
• Testing of hypothesis
3-Both
I. Descrpitve Cross- sectional studies
Example : Weight of preterm babies in the 1st week in the incubator
Example : Gender (male and female), Smoking condition...
II. Analytical Cross- sectional studies
• Information - presence & stength of
• Predictors/ of the diseases.
• Testing of hypothesis :
✓First method
✓Second method
hypothetical
There are 2 methods:
First method:
Identification of four subgroups based on presence or absence of and
presence or absence of .
hypothetical
Second method:
Two possible approaches to the analysis of results:
(A) the Rate of the Proportion of the Persons with Disease
Calculate the prevalence of
the prevalence of . Or
(B) the Rate of the Proportion of the Persons with Exposure
Calculate the prevalence of
compared to the prevalence of .
The Rate ratio is the rate
of the of the
over the
• The Rate ratio
to measure an
of the
disease with exposure
Secondmethod:Designofahypotheticalcross-sectionalstudy:A 2 × 2 table of the
findings from the study
:
:
:
: Interpretation
the rate ratio of 1.0 indicates equal rates in the
two groups,
the rate ratio greater than 1.0 indicates an
increased risk for the exposed group ,
the rate ratio less than 1.0 indicates a decreased
risk for the exposed group.
• Interpretation : People who are exposed to smoking had 6.0 times as
likely to develop hypertension as those who are not
exposed.
• Risk of hypertension among smokers patients = 120/400 = 0.3 = 30%
• Risk of hypertension among non-smokers patients = 30/600 = 0.05= 5%
• Risk ratio = 0.3 ⁄ 0.05 = 6
• The risk ratio is more than 1.0, indicating a incresaed risk or protective
effect for the exposed (smokers) patients. The risk ratio of 6 indicates
that smokers patients were likely (60%, actually) to develop
hypertension compare to nonsmokers patients.
: Interpretation
Home Task :
Estimate the Risk Ratio for this example and give your
interpretation?
Thank You

Cross sectional studies

  • 1.
    Cross-Sectional Studies Dr. Faiza AbouEl-Soud Professor- Community Health Nursing Menoufiya University-Egypt
  • 2.
    ➢Define cross-sectional studydesign ➢Reason to use cross-sectional study design ➢Different items between cross-sectional and longitudinal study. ➢Discuss types of the cross-sectional studies ➢identify the design of a hypothetical cross-sectional study ➢Identify advantages of cross-sectional study design ➢Discuss disadvantages of cross-sectional study design
  • 3.
  • 6.
  • 7.
    1-Descriptive Cross- sectional studies •Information about / variables • Estimate problem- prevalence • Period prevalence • Disease & suspected risk factors population /specfic individuals 2-Analytical Cross- sectional studies • Information - presence & stength of • Predictors/ deteminants of the diseases • Testing of hypothesis 3-Both
  • 8.
    I. Descrpitve Cross-sectional studies Example : Weight of preterm babies in the 1st week in the incubator Example : Gender (male and female), Smoking condition...
  • 9.
    II. Analytical Cross-sectional studies • Information - presence & stength of • Predictors/ of the diseases. • Testing of hypothesis : ✓First method ✓Second method
  • 10.
    hypothetical There are 2methods: First method: Identification of four subgroups based on presence or absence of and presence or absence of .
  • 11.
    hypothetical Second method: Two possibleapproaches to the analysis of results: (A) the Rate of the Proportion of the Persons with Disease Calculate the prevalence of the prevalence of . Or (B) the Rate of the Proportion of the Persons with Exposure Calculate the prevalence of compared to the prevalence of .
  • 12.
    The Rate ratiois the rate of the of the over the • The Rate ratio to measure an of the disease with exposure
  • 13.
  • 14.
  • 15.
  • 16.
  • 17.
    : Interpretation the rateratio of 1.0 indicates equal rates in the two groups, the rate ratio greater than 1.0 indicates an increased risk for the exposed group , the rate ratio less than 1.0 indicates a decreased risk for the exposed group.
  • 18.
    • Interpretation :People who are exposed to smoking had 6.0 times as likely to develop hypertension as those who are not exposed. • Risk of hypertension among smokers patients = 120/400 = 0.3 = 30% • Risk of hypertension among non-smokers patients = 30/600 = 0.05= 5% • Risk ratio = 0.3 ⁄ 0.05 = 6 • The risk ratio is more than 1.0, indicating a incresaed risk or protective effect for the exposed (smokers) patients. The risk ratio of 6 indicates that smokers patients were likely (60%, actually) to develop hypertension compare to nonsmokers patients. : Interpretation
  • 19.
    Home Task : Estimatethe Risk Ratio for this example and give your interpretation?
  • 22.