Download as PDF, PPTX


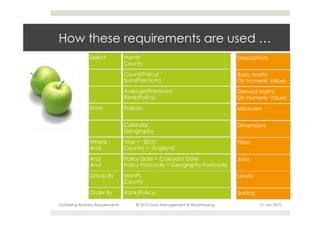
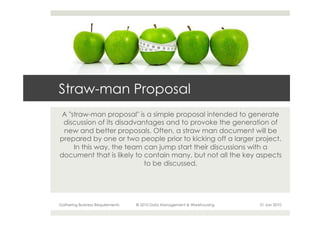


This document provides an overview of the process for gathering business requirements for a data management and warehousing project. It discusses why requirements are gathered, the types of requirements needed, how business processes create data in the form of dimensions and measures, and how the gathered requirements will be used to design reports to meet business needs. A straw-man proposal is presented as a starting point for further discussion.