SlideShare a Scribd company logo
1 of 26
Download to read offline
Stock Focus
ASX (ASX)
1
SEEING UPSIDE THROUGH THE FOG
RECOMMENDATION : POSITIVE
We initiate on ASX Limited (ASX) with a Positive
recommendation and $35.86 blended valuation.
EARNINGS CAN GROW DESPITE COMPETITION
ASX has been mired in the fog of a cyclical downturn and structural risks.
We expect new entrants will eventually emerge in derivatives, settlements
and clearing, leading to margin and share decline in these segments.
But we look through this and see a medium-term opportunity to buy a high
margin, well-diversified franchise at depressed prices with:
(i) Upside from cyclical recovery, multiple growth options and pricing
power in uncontested segments; and
(ii) Consolidation opportunities.
MULTIPLE GROWTH OPTIONS
Growth options include OTC derivatives clearing; listing of government
bonds, international securities, managed funds, and ETFs; ASX Data Centre
co-location; expanded trading times; and expanded product functionality.
RISK/REWARD EQUATION FIRMLY IN YOUR FAVOUR
Scenario analysis (bear case valuation $30.07, bull case $40.26) suggests
upside outweighs downside by more than a 3:1 ratio from current levels.
Cyclical and structural concerns mean it may take time for the share price to
bridge the valuation gap. Catalysts could include: (i) equity capital markets
cyclical recovery; (ii) improved regulatory and competitive outlook visibility;
or (iii) traction in growth options.
In the meantime, ASX’s 90% payout ratio translates to a 6.6% FY13 cash
yield – investors are being paid to wait for a cyclical recovery with multiple
free growth options.
Trading Data
Last Price $31.33
12 month range $27.15 - $33.20
Market Cap $5,487m
Free Float $5,465m (99.6%)
Avg. Daily Volume 0.7m
Avg. Daily Value $23.7m
12 month return (historical) 0.2%
A mix of volume growth and
pricing power in uncontested
revenue lines to drive return on
capital higher.
High operating leverage and
monopoly-like positions in
various segments translate to
high operating profit margins.
Earnings Forecasts
Yr to June 09A 10A 11A 12E 13E 14E
EBITDA ($m) 400.2 454.0 482.1 487.9 550.3 569.7
Rep NPAT ($m) 313.6 328.1 352.3 361.6 400.9 408.5
Adj NPAT ($m) 313.6 332.6 356.6 361.6 400.9 408.5
EPS (¢) 183.2 193.0 204.0 206.4 228.9 233.3
EPS Gth (%) (14.4) 5.3 5.7 1.2 10.9 1.9
PER (x) 17.1 16.2 15.4 15.2 13.7 13.4
PEG Ratio (x) 1.5 2.3 1.3 1.2
DPS (¢) 164.9 173.1 183.2 185.7 205.9 209.8
Yield (%) 5.3 5.5 5.8 5.9 6.6 6.7
Franking (%) 100% 100% 100% 100% 100% 100%
ROE (%) 11% 12% 12% 12% 13% 13%
EV/EBITDA (x) 10.4 9.9 7.9 7.8 6.9 6.7
Net Debt/EBITDA (x) (3.3) (2.2) (3.5) (3.5) (3.1) (3.0)
Int. Cover (x) (7.3) (14.8) (12.2) (10.5) (11.7) (11.9)
Valuation (blended) $35.86
George Gabriel, CFA
ggabriel@evansandpartners.com.au
April 12, 2012
+61 3 9631 9853
2
CONTENTS
1 SUMMARY INVESTMENT CONSIDERATIONS 3
2. VALUATION 5
 EAP valuation
 Key value drivers
 Bear/Base/Bull cases
 Historical valuation perspectives
 Global comparables
3. COMPETITION 10
 Contested revenue lines
o Equities trading
o Clearing
o Settlements
o Derivatives
 Competitive response
o ASX alternative trading facilities
o Pricing strategies
o Growth options
 Key competitor overview
4. COMPANY OVERVIEW 14
 Business overview
 Segmental overview
o Derivatives
o Listing and Issuer Services
o Cash Market
o Information Services
o Technical Services
o Austraclear
o Other revenue
 Sector consolidation
o ASX as acquirer
o ASX as target
o International consolidation
5. KEY RISKS 23
 Regulatory risk
o “Best execution”
o OTC Derivatives clearing
 Cyclical outlook
 Competition
6. FINANCIAL SUMMARY 24
3
1. SUMMARY INVESTMENT CONSIDERATIONS
ASX is currently trading on bottom-of-cycle FY13F PE of 13.7x, with a 6.6% fully franked yield, offering cyclical
recovery upside and multiple free growth options.
1. Undemanding valuation reflects uncertain regulatory, competitive and cyclical outlooks.
a. PE discount. ASX is trading at a discount to its average PE since 2000 of ~18x. Chart 3.
b. Domestic peer-relative discount. ASX is trading at a discount relative to the ASX Industrials,
compared to its premium from Mar 2005. Chart 4.
c. Global peer-relative discount. ASX’s PE is in line with European and North American peers, who are
already post-competition, which supports the view that ASX’s share price already discounts the impact
of competition. Chart 7-8.
2. Positive risk/reward ratio
a. ASX offers a positive risk/reward ratio of 3.3x (assuming a $31.50 purchase price).
b. Our valuation scenarios quantify a range of key drivers: market value; market share loss; pricing
discounts (ie. margin decline) and price increases in uncontested segments.
c. Table 1 summarises our bear, bull and base cases. Our $30.07 bear case valuation factors in low
market cap growth, market share loss (in derivatives, clearing, settlement and cash market trading),
pricing discount in competed segments and price increases in uncontested segments.
3. Effective pricing strategies
a. Pricing power exercised in uncontested segments. Prices have increased for annual listings;
secondary raisings; cash equities settlement and registry services.
b. Derivatives and market data pricing reviews are soon to be announced.
c. Price discounting in cash equities trading. In June 2010, ASX pre-emptively reduced cash equities
trading fees in anticipation of the arrival of competition. We do not expect further material price
reductions given ASX is already pricing is at the lower end of international exchange pricing.
d. Annual pricing reviews. ASX has committed to at least an annual review of pricing across its
business portfolio.
4. High sensitivity to cyclical recovery
a. A 10% increase in the total listed equity market cap translates to ~ 9.1% FY13F EPS
increase for ASX. Key drivers are futures & options, daily cash equities, CHESS statements and
terminals. Table 5.
5. Multiple growth options mitigate headwinds in a post-monopoly competitive environment.
a. Competition is currently only in cash equities trading, comprising 6.2% of 1H12 revenues.
b. Our base case assumes new entrants in derivatives, settlement and clearing by FY15.
c. Medium-term growth options exist including OTC derivatives clearing; listing of government bonds,
international securities, managed funds, and ETFs; ASX Data Centre co-location; expanded trading
times; and expanded product functionality.
4
6. Consolidation options.
a. As an acquirer, ASX has a wide range of options including: (i) smaller offshore exchanges; (ii)
bolt-on acquisitions in its various revenue lines; or (iii) a larger acquisition such as the purchase of
Computershare (registry business), IRESS (market information services, 18.9% owned by ASX) etc..
The new CEO is yet to articulate his M&A agenda.
b. A takeover/merger with the ASX is unlikely in the short-medium term. On 8 April 2011, SGX’s
acquisition of ASX was rejected on national interest grounds. The existing 15% shareholder cap
requires political consent for removal, which is currently unlikely.
c. However, the Council of Financial Regulators’ (CFR) recommendations are potentially
creating the conditions for long-term consolidation. The recommendations of step-in rights and
mandatory onshore location of clearing and settlement infrastructure address some of the concerns
highlighted in consideration of the proposed SGX-ASX takeover.
7. What’s next?
a. Council of Financial Regulators (CFR) report due “shortly” on whether clearing and settlement
should be opened up to competition.
b. ASX Data Centre expected for completion in 2Q 2012. This facility will accommodate co-location of
customers’ IT infrastructure with ASX for the purposes of increasing execution speed.
c. OTC Equity Clear will be launched in May 2012, allowing institutional investors to trade equity
options with any expiry date and electable strike price without any ISDA requirements.
d. OTC equity derivatives clearing on track to go live in 2H12.
e. OTC interest rate swap clearing subject to evolving regulatory framework.
f. Listing international depositary receipts by July 2012, subject to ASIC approval. ASX plans to
offer depositary receipts in Xstrata, BHP Billiton, Rio Tinto, HSBC Holdings, with other depositary
receipts issued on demand.
g. New product launches (electricity derivatives targeted 2H12; equity index derivatives expected
1H13; exchange traded option enhancements due FY13; carbon trading end of FY13).
h. Mandatory “best execution” review in March 2013. ASIC will decide whether “best execution”
effectively compels all brokers to sign up with Chi-X.
i. Managed fund trading service from FY13. ASX is looking to use existing technology to allow
investors to apply for and redeem unlisted managed funds.
j. Review “dark pool” minimum order size in April 2015. If dark pool market share becomes
excessive, ASIC will increase the minimum order size to $50k (compared to ASX average of ~$7.6k per
trade). ASX wants immediate introduction of the $50k dark pool minimum trade size.
5
2. VALUATION
EAP Valuation
Our base case blended valuation of $35.86 is comprised as set out in Table 1:
TABLE 1: EAP BLENDED VALUATION
Methodology Key Inputs Value ($ps)
Discounted Cash Flow 11.0% WACC $34.58
Capitalisation of Earnings 3-yr EV/EBITDA average $37.34
Market Relative 3-yr average PE $35.66
Average $35.86
Source: EAP Research estimates
Key Value Drivers
The key drivers of ASX shareholder value are:
(i) Market value growth;
(ii) Market share loss to new entrants;
(iii) Product pricing; and
(iv) Growth options.
Base Case
Our base case assumptions for each value driver are summarised below.
(i) Market Value
We assume cross-cycle market index value growth of 7.0% pa, in line with the 6.8% 20-year average. Chart 2.
CHART 1: ASX200 INDEX LEVEL CHART 2: ANNUAL CHANGE IN ASX200
(ii) Market Share Loss
We expect that ASX will eventually lose market share to new entrants in Derivatives, Clearing and Settlements
(even though there are no current competitors). See Sections 3 and 4 of this report for a comprehensive
discussion of competitive threats & an overview of each segment, respectively.
 Derivatives – 10% market share loss by 1H15.
o We believe Derivatives is less susceptible than other segments to competition given the challenge of
drawing liquidity to a new entrant (network effect), greater perceived counter-party risk (given longer
contract terms) and cash margining requirements.
6
 Clearing – 20% share loss by 1H15.
o LCH Clearnet has expressed an interest in entering the local market.
o The regulator is expected to release a policy report “shortly”. With the Council for Financial Regulators
recommending mandatory onshore clearing infrastructure, barriers for new entrants are being elevated.
 Settlement – 30% market share loss by 1H15.
o We believe cash equities settlement is the most commoditised segment and so faces the greatest
volume and margin risk.
 Cash Market Trading – 30% market share loss by 1H14.
o Market share loss is the sum of both dark pools and Chi-X market share gains.
o Currently, Chi-X has ~2% market share and dark pools ~10%.
o We note that in Canada (the most comparable market to Australia), Chi-X only gained ~10% share,
implying some upside risk to EAP’s base case.
(iii) Product Pricing
Beyond already announced near-term price increases (see Section 3 of this report for a summary), our base
case assumes 4% pa price increases in uncontested segments and price declines of between 10% (trading,
clearing, derivatives) and 30% (settlement) in segments which we believe will ultimately face competition.
(iv) Growth Options
Our base case does not include growth options, providing a key source of upside risk (refer Section 3
“Growth options”).
7
Bear and Bull cases
In our view, the bear case valuation of $30.07 discounts a highly pessimistic scenario. Buyers of ASX stock at
around $30 will enjoy a significant margin of safety.
Whilst the $40.26 bull case valuation is possible, the share price is unlikely to reach these levels until there is some
visibility on the competitive outlook for Derivatives, Clearing and Settlements.
TABLE 2: BEAR AND BULL CASE SUMMARY
Driver Description
Bear
case
Base
case
Bull
case
Comments
Market value
Annual market index growth
from 1H14
4% 7% 10%
Market value growth is a key
revenue driver for a number of
segments including Listings &
Capital Raisings, Cash Market
Trading Value, Information &
Technical Services.
Market share loss
Derivatives – market share
loss by 1H15
30% 10% 0%
Clearing – market share loss
by 1H15
40% 20% 10%
Settlement – market share
loss by 1H15
50% 30% 20%
Cash market trading –
market share loss by 1H14
50% 30% 15%
Pricing discounts
Trading – additional price
discount in 1H13
30% 10% 0%
Clearing – price discount in
1H14.
20% 10% 0%
Settlement – price discount
in FY14 as competition
commoditises this service
50% 30% 0%
Derivatives –price discount
in 1H15
25% 10% 0%
Price increases
Annual price increases in all
other segments
3% 4% 5%
Our base case includes
announced price increases in
certain segments. We also
assume uncontested segments
will increase prices over time.
Blended valuation $30.07 $35.86 $40.26
Source: EAP
Our base case sees market
share losses in 4 segments:
derivatives, clearing,
settlements and cash market
equities.
Our base case also includes
price discounting in segments
which we believe will ultimately
face competition.
8
Historical valuation perspectives
ASX’s depressed valuation reflects the overhang of cyclical and structural concerns. We note the following valuation
trends:
o PE declining from 25x to ~14.0x FY13F. Chart 3.
o PE discount to the ASX Industrials. Chart 4.
o Price/book valuation multiple of ~1.6x at bottom of historical range. Chart 5.
o EV/EBITDA multiple of 10.0x at bottom of historical range. Chart 6.
CHART 3: 12 MONTH FORWARD PE RATIO CHART 4: PER RELATIVE TO ASX INDUSTRIALS
12.5
15.0
17.5
20.0
22.5
25.0
27.5
Source:Bloomberg
0.6
0.8
1.0
1.2
1.4
1.6
1.8
Source: Bloomberg, EAP
CHART 5: P/B VALUE (POST SFE MERGER) CHART 6: EV TO EBITDA
1.0
1.5
2.0
2.5
3.0
3.5
4.0
Jul-06 Jul-07 Jul-08 Jul-09 Jul-10 Jul-11
Source: Factset, EAP
Global comparables
ASX’s PE is in line with European and North American exchanges which are already post-competition. Charts 7-8.
Table 3. However, it is not clear that ASX will suffer the same degree of market share loss as its North American
and European exchange incumbents given:
o ASX is more broadly diversified.
o ASX retains multiple growth options.
o ASX could capture growing Asian capital flows through a strategic alliance or international listings.
o ASX’s pre-emptive competitive responses may mitigate share loss (refer Section 3 “Competitive response”
below).
o Rising barriers to entry in clearing and settlement decrease the likelihood of new entrants.
9
CHART 7: PER RELATIVE TO GLOBAL COMPS CHART 8: PER RELATIVE TO GLOBAL COMPS
HKExch&Clearing
BursaMalaysia
SingaporeExchange
BolsaMexicana
NZX
IntercontintenalExch
CBOE
BM&FBovespa
CME
ASX
WarsawSE
JohanesburgSE
BolsasyME
TMXGroup
NYSEEuronext
DeustcheBorse
LSE
NasdaqOMX
0.0
5.0
10.0
15.0
20.0
25.0
30.0
Source: Factset
TABLE 3: GLOBAL COMPARABLES
2012 2013 2012 2013 2012 2013 2012 2013 2012 2013
Asia-Pac
Australian Stock Exchange AUD 31.33 5487 4851 15.2 13.7 8.3 7.4 5.9 6.6 1.2 10.9 12.0 13.2
HK Exchanges and Clearing HKD 128.5 138768 93530 25.8 23.4 15.1 13.5 3.5 3.9 5.7 10.4 56.5 57.3
Singapore Exchange SGD 6.74 7223 6530 23.4 21.1 17.7 15.8 3.9 4.3 -3.0 11.1 37.0 39.9
Bursa Malaysia MYR 7.06 3755 3221 24.8 21.9 15.6 13.7 4.8 5.4 4.4 13.0 17.4 19.5
Osaka Securities Exchange JPY 459000 123930 82288
NZX NZD 2.78 336 323 18.9 16.4 13.4 11.8 4.4 4.9 22.5 15.6 25.3 27.0
Average Asia-Pac 23.2 20.7 15.4 13.7 4.2 4.6 7.4 12.5 34.1 35.9
Americas
CME USD 282.09 18742 19759 16.1 13.9 9.3 8.1 4.2 4.3 2.4 15.3 5.4 6.0
BM&F Bovespa BRL 11.13 22037 21016 13.5 11.9 16.1 14.0 4.5 5.5 3.2 13.2 7.1 7.9
NYSE Euronext USD 27.48 7098 8741 11.2 9.2 8.7 7.4 4.5 4.6 -1.5 22.2 9.2 10.1
Intercontintenal exchange USD 132.18 9595 9660 16.5 14.7 10.8 9.4 0.0 0.0 14.5 12.0 17.5 17.6
Nasdaq OMX USD 24.59 4264 5596 9.1 8.0 7.1 6.3 0.0 0.3 7.8 13.5 9.4 10.2
TMX Group CAD 44.2 3301 3240 11.5 10.5 8.3 7.6 3.7 3.8 4.4 9.7 21.8 20.7
CBOE USD 27 2397 2262 16.4 14.3 8.3 7.2 1.9 2.1 5.9 14.7 54.9 45.0
Bolsa Mexicana MXN 25.94 15382 13339 20.3 16.6 12.4 9.8 4.5 5.5 12.3 21.9 14.4 17.1
Average Americas 14.3 12.4 10.1 8.7 2.9 3.3 6.1 15.3 17.4 16.8
Europe
Deustche Borse EUR 49.135 9483 10035 10.4 9.6 8.0 7.5 4.9 5.2 2.9 8.6 24.9 23.7
London Stock Exchange GBp 1023 277344 277576 11.4 11.4 6.9 7.2 2.9 3.1 38.9 0.2 20.1 17.4
Warsaw Stock Exchange PLN 39.2 1054 876 13.5 12.1 6.3 5.6 5.4 6.2 -9.8 12.0 23.1 24.2
Bolsas y Mercados Espanoles EUR 18.3 1530 1174 10.5 10.6 5.8 5.7 9.1 8.8 -3.3 -0.9 32.3 31.5
Oslo Bors NOK 66 2838 1945
Average Europe 11.5 10.9 6.7 6.5 5.6 5.8 7.2 5.0 25.1 24.2
Other
Dubai Financial Market AED 1.21 9680 9018 80.7 43.2 162.6 48.9 1.3 2.2 400.0 86.7 1.4 2.8
Johanesburg Stock Exchange ZAr 8000 695021 694006 13.5 12.2 11.6 10.7 4.0 4.9 6.7 10.4 31.8 29.8
Average other 47.1 27.7 87.1 29.8 2.7 3.5 203.4 48.5 16.6 16.3
Source: EAP, Bloomberg
ASX global comparable
companies
ROE (%)
Crncy
Share
price
Mkt cap
Ent.
Value
P/E RATIO EV/EBIT (x) YIELD EPS GROWTH (%)
10
3. COMPETITION
Contested Revenue Lines
Currently, only Cash Equities Trading faces competition from a new entrant, Chi-X. However, our base case
assumes competition will progressively arrive over time to FY15F in Equities Clearing, Equities Settlements and
Derivatives. We consider each of these segments below.
(i) Cash Equities Trading
This segment is now less relevant to ASX given it contributed only 6.2% of 1H12 revenues. Table 4. Our base case
assumes an additional 10% price decline in 1H13 and 30% share loss by 1H14 comprising: (i) dark pool market
share of 15% (currently ~10%); and (ii) Chi-X share of 15% (currently ~2%).
There is an upside risk that ASX retains greater market share than our base case because:
o ASX pre-emptively cut its pricing such that it is now priced at the bottom end of international peers (refer
section 3 “Pricing strategies”).
o ASX’s vertically integrated trading, clearing and settlement offers customers a convenient “one-stop-shop”
trading solution.
o Incurring capex to adopt new trading platforms makes less sense when equities trading prices are already
declining.
o It is unclear whether brokers will be mandatorily required to adopt new entrant trading platforms. ASIC
appears to be moving towards the view that “best execution” does not dictate that brokers must
mandatorily adopt new entrants’ trading platforms (refer section 5 “Regulatory Change”).
 Equities Trading – international experience of new entrants
New entrants have captured as little as 3% share (Tokyo) and as high as 36% (FTSE100).
o London. Within the first 12 months, Chi-X Europe/BATS captured 20%+ of FTSE100 share and currently
has ~36%.
o Toronto. The Toronto Stock Exchange lost ~ 35% share to new trading venues.
o Tokyo. After its debut last year, Chi-X’s market share remains less than 3%. However, Japanese regulation
prevents new entrants from exceeding 10% share, which may have limited the interest of market
participants.
(ii) Clearing
Although ASX Clear is currently the monopoly clearing house, our base case view assumes (i) 5% share loss in
1H14 which stabilises at 20% share in 1H15; and (ii) 10% price decline in 1H14. Price decline is mitigated by the
fact that clearing requires counter-party risk acceptance and so clearers will likely price for their perceived financial
stability.
We expect that clearing houses with global ambitions such as European Multilateral Clearing Facility (EMCF) and
LCH Clearnet will eventually enter the Australian market. However, smaller players such as LSE’s Turquoise, Six-x-
clear, EuroCCP, Nasdaq OMX and Burgundy Exchange are increasingly less likely to do so as the CFR’s regulatory
entry barriers are raised.
Regionally, BNP Paribas offers clearing and custody solutions in India, Hong Kong and Singapore. It already offers
third-party clearing for listed derivatives in Australia and hopes to offer third-party clearing services for cash
equities in Australia by end of 2012, subject to regulatory approval.
 Council of Financial Regulators (CFR) recommendations
In March 2012, the Australian Consumer and Competition Commission (ACCC) and the CFR (comprising the
Reserve Bank of Australia, Treasury, APRA and ASIC) proposed significant changes to Australia’s financial market
infrastructure regulation: (i) Clearing and settlement infrastructure must be physically located in Australia; (ii)
Regulator’s “step in” powers to take control of systemically important financial institutions such as the ASX in the
event of a systemic crisis.
11
The next stage of the CFR’s review is to consider whether clearing and settlement should be opened up to
competition – a report is close to being finalised.
(iii) Settlements
Our base case view is: (i) 30% cash equities settlements share loss by 1H15; and (ii) 30% price declines in FY14
as this segment becomes commoditised.
(iv) Derivatives
Our base case view is: (i) 10% market share loss; and (ii) 10% price decline by 1H15. Share loss is mitigated by:
(i) the network effect of incumbent exchange’s liquidity maintaining share; and (ii) derivatives are seen to have
greater counterparty risk due to longer contract duration and margining requirements.
Competitive Responses
ASX’s competitive responses include the following: (i) launching Alternative Trading Facilities; (ii) pricing
strategies; (iii) creating growth options; and (iv) product innovations.
ASX Alternative Trading Facilities (ATF)
ASX has launched two ATFs: (i) VolumeMatch - an anonymous large order execution venue; (ii) PureMatch - an
execution venue aimed at high frequency traders to compete directly with Chi-X for HFT order flow. Neither ATF
has gained traction and both are being reviewed.
Pricing strategies
ASX is adopting an effective range of pricing strategies to simultaneously pre-empt competition, retain volumes
and maximise profitability across its business portfolio. Pricing strategies include: (i) price discounting in contested
revenue lines; (ii) exercising pricing power in uncontested revenue lines; and (iii) rebates. It has committed to
annual pricing reviews across its business portfolio.
 Price discounts
In June 2010, ASX announced changes to its cash equities trading execution fees and rebates.
o Price discounts in cash market equities trading: (i) headline trading prices cut from 0.28bp to 0.15bp per
side; (ii) on-market crossing fees from 0.15bp to 0.1bp; and (iii) off-market crossing fees from 0.75bp to
0.05bp.
o Rebates for large participants in cash market equities were terminated, whilst rebates for futures customers
remained.
We expect minimal further downside on cash equities pricing given ASX is more competitively priced than many
European exchanges (eg. Spain’s BME and Germany’s Deutsche Boerse and UK’s LSE range from 0.71% to
1.39%) and is only slightly above US exchanges (NYSE 0.13% and Nasdaq 0.13%).
 Price increases
Price increases in uncontested revenue lines highlight ASX’s pricing power in certain segments. A pricing
review in Derivatives is soon to be announced. Increases include:
o Annual listing fees–increased from 1 July 2012
o ~23% price increase for companies with a market cap of greater than $10bn
o ~26% increase for a market cap between $1bn-$10bn.
o Secondary raising fee increases of ~10% from July 2012.
o Cash equities settlement fees increased by between 9 – 50% from Feb 2012.
o Registry services fees (CHESS) increased +10% from $1 to $1.10 from April 2012, for the first time in 7
years.
o Market connectivity fees increased for the first time since Oct 2006 for equities and Jan 2003 for futures
from June 2010.
12
Growth options
We describe below 9 growth options ASX is currently developing.
 International securities
The ASX CEO has said the quoting of international securities (such as BP, Royal Dutch Shell or HSBC) is a key
strategic goal over the next year. ASX could either: (i) attract primary listings from other jurisdictions; or (ii)
form cross-listing alliances with other exchanges. ASX is currently in talks with the LSE about a cross-listing
alliance.
By July 2012, subject to ASIC approval, ASX plans to offer depositary receipts in Xstrata, BHP, Rio Tinto and
HSBC, with other depositary receipts issued on demand. Richard Murphy, ASX GM Equity Markets, says this is a
“game changer for the shape of the Australian market”.
 Exchange Traded Funds (ETFs)
BetaShares estimates that there are ~75 listed ETFs, with the market cap increasing $51m to $5.2bn in Feb
2012 (~$9m of new listings), compared to 60 listed ETFs in Feb 2012. Blackrock’s iShares and Russell
Investments recently launched the first 6 fixed-interest ETFs on the ASX. Vanguard and State Street have also
indicated they intend to release products in the first half of the year 2012.
 Commonwealth Government Securities (CGS)
Retail CGS listing is targeted for FY13.
 Enhancing capital raising flexibility
ASX proposes listed companies with market cap of less than $300m be able to issue up to 25% of its value,
comprising 15% without shareholder approval and an additional 10% at a maximum discount of 25% within 12
months of gaining investor consent. This expands the existing position which restricts raisings to a maximum of
15%. This measure would bring the ASX in line with Canada’s existing 25% limit and NY and HK’s 20% limits.
 Expanded trading times
ASX intends to increase its relevance to Perth and mining stocks. Of the 2200 ASX listed companies, 830 are
WA-based of which 614 (28% of total listed stocks) are resources stocks.
Perth is supposed to be a gateway to Asia, but the ASX closes at Asia’s lunchtime. ASX is considering extending
operating hours by two hours.
 Flow-through share scheme
A flow-through enables the transfer of tax deductions of individual small exploration companies to individual
investors, which arguably facilitates equity funding for miners. ASX is discussing this proposal with the
Government but expects it is a 3-5 year project given Budgetary constraints. Flow-through share schemes
would harmonise ASX capital raising rules with HK, Toronto, London and Singapore exchanges.
 Managed Fund Service
ASX is looking to use existing technology to allow investors to apply for and redeem unlisted managed funds,
with a launch date targeted in FY13.
 OTC clearing
ASX plans to develop OTC clearing facilities: (i) OTC equity derivative clearing “on track” to go live in 2H12;
and (ii) OTC interest rate swap clearing dependant on regulatory framework.
13
 ASX Data Centre
Expected for completion in 2Q 2012, this facility will accommodate co-location of customers’ IT infrastructure
with ASX for the purposes of increasing execution speed.
Product innovation
 CentrePoint
CentrePoint is a new order crossing type aimed at reducing market impact costs (by allowing order entry at the
mid-point of quoted bid-ask spreads).
 Equity options liberalisation
OTC Equity Clear will be launched in May 2012, allowing institutional investors to trade equity options with
any expiry date and electable strike price without any ISDA requirements.
ASX hopes Australian institutional investors will embrace equity options to the same extent as their American
peers. In the US in 2000, total option volume was ~60% individual investors/40% institutional. In 2012, this
has reversed to 60% institutional/40% individual. In Australia, the mix is ~25% institutional/75% retail.
 Derivatives
Electricity derivatives are targeted for 2H12; equity index derivatives expected 1H13; exchange traded option
enhancements due FY13; and carbon trading is expected in FY13.
Key competitor overview
Dark pools
“Dark pools” allow funds managers to execute block trades with minimal price/volume disclosure away from
primary exchanges. Dark pool operators include: (i) Major stockbroking firms’ in-house dark pools; (ii) Liquidnet;
and (iii) Instinet.
Approx. ~10% of equities is traded via dark pools. ASIC recently suggested dark pool market share should be
capped at 20%. In April 2015, ASIC will consider imposition of a minimum $50k per trade value in dark pools. ASX
wants immediate introduction of the $50k dark pool minimum whilst the broking industry body Australian Financial
Markets Association (AFMA) proposes ASIC only limit trading on a stock by stock basis, with only those stocks
exhibiting share price volatility be banned from dark pools.
Chi-X
Chi-X offers a “lit” execution venue for ASX200 stocks, with operating hours (945am to 430pm) slightly longer
(10am to 4pm) than the ASX, targeting high frequency traders. It commenced trading Australian equities on 4 May
2011 and currently has ~2% share. Participants expect it will capture ~15% within 6 months as confidence in its
reliability grows.
Chi-X is adopting liquidity based differential pricing strategies to attract liquidity suppliers to the market,
which means participants who initially place a buy or sell order (“liquidity providers”) pay the lower fee of 0.06bp
whilst liquidity sellers pay 0.12bp.
It is owned by Chi-X Global, which also operates Chi-X Canada and Chi-X Japan. Until recently Chi-X Global was
wholly owned by the Nomura Group. However, a minority stake has now been taken by BofA Merrill Lynch,
Goldman Sachs, Morgan Stanley, GETCO and Quantlab.
14
4. COMPANY OVERVIEW
Business overview
ASX Limited (ASX) was formed by the merger of the Australian Stock Exchange (ASX) and the Sydney Futures
Exchange (SFE) in July 2006. It performs four types of services:
(i) Market Services (primary, secondary and derivative market trading services);
(ii) Clearing Services for both equities and derivatives;
(iii) Settlement Services for equities (ASX Settlement), derivatives (ASX Clear (Futures)) and fixed
income (Austraclear); and
(iv) Compliance Services which include ongoing monitoring and enforcement of compliance with the
market operating rules (ASX Compliance brand).
Table 4 summarises revenue trends across ASX’s 7 revenue lines. Table 5 summarises key revenue drivers and the
revenue model per segment. We analyse key segment trends below.
TABLE 4: DIVISIONAL REVENUE TREND ANALYSIS
Revenue
% 1H08
total
1H08 2H08 1H09 2H09 1H10 2H10 1H11 2H11 1H12
% 1H12
total
%
segment
mix
CAGR
since
1H09 (%)
Derivatives
Derivatives 13.1 12.4 15.1 16.5 15.1 15.4 14.8 4.7% 15.3% 4.3%
Futures & Options 56.9 51.4 57.0 58.6 67.4 74.7 81.8 26.0% 84.7% 12.9%
Subtotal - Derivatives 26.4% 83.1 83.8 70.1 63.6 71.9 75.9 82.4 89.8 96.6 30.7% 100.0% 11.3%
Derivatives -5.0% 21.7% 9.1% -8.2% 1.8% -4.0%
Futures & Options -9.6% 10.9% 2.9% 15.0% 10.8% 9.6%
Subtotal - Derivatives -9.3% 13.0% 5.5% 8.6% 9.0% 7.6%
Listings and Issuer Services
Annual listing fees 24.1 25.2 23.4 23.6 26.3 26.6 28.8 29.0 30.2 9.6% 44.0% 8.9%
Secondary raising fees 24.9 21.2 26.2 21.8 32.7 17.6 23.9 20.7 17.7 5.6% 25.8% -12.3%
Registry service fees 16.0 13.1 13.3 10.9 16.8 13.8 15.6 12.7 12.4 3.9% 18.1% -2.4%
Warrants fees 7.3 5.6 4.5 2.2 2.9 3.2 3.0 3.6 4.6 1.5% 6.7% 0.7%
Initial listing fees 10.3 1.6 1.8 0.6 3.4 2.9 8.2 4.9 3.7 1.2% 5.4% 27.1%
Subtotal - L & I Services 26.3% 82.6 66.8 69.2 59.1 82.1 64.0 79.5 70.9 68.6 21.8% 100.0% -0.3%
Annual listing fees 4.6% -7.1% 0.9% 11.4% 1.1% 8.3% 0.7% 4.1%
Secondary raising fees -14.9% 23.6% -16.8% 50.0% -46.2% 35.8% -13.4% -14.5%
Registry service fees -18.2% 1.6% -18.2% 54.2% -18.2% 13.0% -18.2% -2.6%
Initial listing fees -84.5% 12.5% -66.7% 466.7% -14.7% 182.8% -40.2% -24.5%
Warrants fees -22.3% -20.2% -51.8% 31.9% 10.5% -5.2% 18.4% 29.5%
Subtotal - L & I Services -19.2% 3.7% -14.7% 38.9% -22.0% 24.1% -10.8% -3.2%
Cash market
Clearing 25.0 24.6 25.1 8.0% 37.5%
Settlement 22.2 23.3 22.2 7.0% 33.2%
Trading 19.5 19.2 19.6 6.2% 29.3%
Subtotal - Cash market 25.5% 80.2 79.4 75.9 62.9 77.5 73.3 66.8 67.1 66.9 21.2% 100.0% -4.1%
Clearing -1.7% 1.9%
Settlement 4.9% -4.7%
Trading -1.8% 2.2%
Subtotal - Cash market 0.5% -0.3%
Information services 10.6% 33.3 34.7 37.0 34.1 35.3 33.4 35.2 35.7 34.6 11.0% -2.2%
% growth 4.1% 6.6% -7.9% 3.7% -5.3% 5.1% 1.6% -3.2%
Technical services 4.2% 13.2 14.5 14.4 14.2 14.7 15.2 18.9 21.4 22.6 7.2% 16.3%
% growth 9.5% -0.6% -0.9% 3.0% 3.4% 24.7% 13.3% 5.4%
Austraclear services 3.5% 11.0 10.9 11.8 12.9 14.8 16.4 16.9 16.9 17.8 5.6% 14.8%
% growth -1.5% 8.3% 10.0% 14.6% 10.6% 3.2% -0.3% 5.6%
Other 3.6% 11.2 10.1 7.9 5.3 6.4 7.2 8.4 7.7 8.0 2.5% 0.5%
% growth -10.0% -21.9% -32.4% 21.1% 12.0% 16.2% -7.9% 3.5%
Total operating revenue 100.0% 314.7 300.0 286.3 252.1 302.8 285.5 308.1 309.6 315.1 100.0% 3.2%
% growth -4.7% -4.6% -11.9% 20.1% -5.7% 7.9% 0.5% 1.8%
Source: ASX Reports, EAP
15
TABLE 5: DIVISIONAL REVENUE CONTRIBUTION, SERVICES, REVENUE MODEL
Segment
% 1H12
revenue
Services Drivers and revenue model Trends
Derivatives 30.7%  Trading of exchange
traded equity options
(ETOs), futures and index
options.
 Futures and options
(F&O) trading.
 Contract volumes
 Fixed $ fee for each side of a
trade.
Derivatives (ETOs)
revenues are down on
higher volumes but
lower margins. Plans
for new products.
F&O revenue grew with
increased pricing
offsetting declining
volume.
Listings &
Issuer
Services
21.8%  Securities lodgement,
holding statement
production, registry
updates and
amendments etc
Five segments:
 Annual listing fees - % of market
cap on regressive sliding scale
 Secondary raising fees - % of
value raised on regressive sliding
scale
 Registry service fees - flat fee
per request
 Initial listing fees - % of market
cap on regressive sliding scale
 Warrants fees - Charge per new
series + annual fixed fee plus %
of value.
Annual listing fee
increased in March
2012.
Secondary capital
raised declining since
the 1H10 peak during
the post-GFC
recapitalization
IPO value remains
depressed
Cash Market 21.2%  Secondary equity market
trading, clearing and
settlements services.
Three segments:
 Clearing - % value traded.
 Settlement - Fixed charge per
request.
 Trading - % value traded
(0.15% standard) capped at $75
per trade.
Cash market trading
impacted by
competition, but only
6.0% 1H12 revenue.
Information
Services
11.0%  Access to products and
market data from ASX’s
equities and derivatives
trading systems, live
access to company
releases and other
related fundamental
information
Revenues are driven by the total
number of terminal connections.
Professional data usage
was stable, but retail
data usage (including
day traders) was down.
Technical
Services
7.2%  Provides trade execution
and data services
businesses including ASX
Net (high speed fibre
optic communication
network) and ASX Best.
 ASX Data Centre,
expected for completion
in 2Q 2012, which will
greatly increase hosting
and connectivity services.
Fees are charged per workstation,
open interface and network used to
access both the cash and derivatives
markets.
ASX Data Centre a
growth option
Austraclear 5.6%  Depository, settlement
and registry services for
fixed income securities.
Revenue driven by settlement
volume & securities holdings
Listing of CGS a growth
option.
Other
revenue
2.5%  Fees on delayed
settlements
 ASX and Austraclear
participation fees.
Fee per delay; fee per participant Revenues have
remained flat since the
cyclical low of 1H09
Source: EAP
16
Segmental overview
The current impact of competition is minimal, with only cash equities trading (6.2% of 1H12 revenue) being
currently contested. However, EAP’s base case assumes new entrants in: Derivatives (from 2H14), clearing (from
1H14) and settlements (from 1H14).
Segment 1 – Derivatives
Derivatives has been a strong segment, up from 26.4% total revenue in 1H08 to 30.7% in 1H12. Chart 11.
Group Derivatives comprises two segments:
(i) Derivatives (ETOs and index options); and
(ii) Futures & Options (F&O).
Group Derivatives revenues have increased 37.7% since 2H09, a 3 year CAGR of 11.3%, with F&O
being the key growth driver.
o Derivatives (ETOs and index options) revenues are down on higher volumes but lower margins.
The key driver of 18.2% hoh growth in 1H12 total derivatives volume was index options growth of +61%.
However, the decline in average fee per contract has driven 1H12 revenue down $0.6m to $14.8m. Charts
11-12.
o F&O revenue grew with increased average pricing offsetting declining volume. Average fee per
contract was up 15.1% to $1.60 in 1H12 whilst daily average contracts declined 6.3%. Chart 13.
CHART 11: GROUP DERIVATIVES REVENUE
56.9
51.4
57.0 58.6
67.4
74.7
81.8
13.1
12.4
15.1 16.5
15.1
15.4
14.8
0.0
20.0
40.0
60.0
80.0
100.0
1H 09 2H 09 1H 10 2H 10 1H 11 2H 11 1H 12
Derivatives Revenue Futures & Options Revenue
$m
Source: ASX Reports, EAP
CHART 12: DERIVATIVES (ETOs and INDEX Options) CHART 13: FUTURES & OPTIONS
$0.40
$0.60
$0.80
$1.00
$1.20
$1.40
$1.60
0
20
40
60
80
100
120
Derivative Average Daily Contracts Derivatives AverageFee per Contract
Source: ASX Reports, EAP
000's
$0.10
$0.30
$0.50
$0.70
$0.90
$1.10
$1.30
$1.50
$1.70
$1.90
0
50
100
150
200
250
300
350
400
450
Average DailyContracts Average Fee per Contract
Source: ASX Reports, EAP
000's
17
Segment 2 - Listings & Issuer Services
ASX’s second largest segment, it generates revenue from five separate segments:
(i) Annual listing fees (44.0% of segment revenues);
(ii) Secondary raising fees (25.8% segment);
(iii) Registry services fees (18.1% of segment);
(iv) Initial listing fees (5.4% segment); and
(v) Warrants fees (6.7% segment).
L&I Group Revenue has been mostly flat since 1H09, with growth in annual listing fees and warrants
fees offsetting declines in secondary raising fees. Earnings cyclicality is evident in Chart 14.
CHART 14: LISTINGS & ISSUER SERVICES REVENUES
0.0
10.0
20.0
30.0
40.0
50.0
60.0
70.0
80.0
0.0
10.0
20.0
30.0
40.0
50.0
60.0
70.0
80.0
90.0
1H 08 2H 08 1H 09 2H 09 1H 10 2H 10 1H 11 2H 11 1H 12
Registry service fees
Warrants & Debt
Secondary Listing Fees
Initial Listing Fees
Annual Listing Fees
Total Capital Raised (RHS)
Source:ASX Reports, EAP
$m $m
 Annual Listing Fees
Annual Listing Fees are driven by: (i) the number of listed entities; and (ii) total market capitalization, with fees
charges as a % of market cap on a regressive sliding scale. Group L&I Services revenues have been flat since
2H09, with a constant number of listed entities since Mar 08 and a declining market index offset by increased fees.
Key trends are:
o New listing numbers declined 32.1% from 84 in 1H11 to 57 in 1H12. Table 6.
o The number of de-listings has accelerated in 1H12 to 82. Table 6.
o Total Listings have increased slightly in 2H12, though the trend over the year to February 2012 is largely
flat.
CHART 15: NUMBER OF LISTED ENTITIES CHART 16: ASX 200 INDEX LEVEL
1,450
1,550
1,650
1,750
1,850
1,950
2,050
2,150
2,250
2,350
Source: ASX Reports, EAP
1,450
2,450
3,450
4,450
5,450
6,450
7,450
Source: IRESS, EAP
Points
TABLE 6: ASX LISTINGS
Listings 1H 09 2H 09 1H 10 2H 10 1H 11 2H 11 1H 12
Domestic Market Cap $bn $969 $1,098 $1,403 $1,254 $1,419 $1,349 $1,136
Listings - Opening Balance 2226 2223 2198 2181 2192 2216 2247
Number of New Listings 34 11 50 43 84 76 57
Nuber of Delistings -37 -36 -67 -32 -60 -45 -82
Listings at end 2223 2198 2181 2192 2216 2247 2222
Growth -0.1% -1.1% -0.8% 0.5% 1.1% 1.4% -1.1%
Source: ASX Reports, EAP
18
 Secondary Listing Fees
Secondary Listing Fees are driven by the value of
secondary capital and dividend reinvestment plans
(DRPs) raised, with fees charged as a % of the dollar
value raised on a regressive sliding scale. Table 5.
Secondary raising fees have been declining since the
1H10 peak of $32.7m during the post-GFC
recapitalization to $17.7m in 1H12.
CHART 17: SECONDARY CAPITAL RAISED & ASX
FEES
0.0
7.5
15.0
22.5
30.0
37.5
45.0
0
10,000
20,000
30,000
40,000
50,000
60,000
SecondaryCapitalRaised A$m (LHS) SecondaryListing Fees(RHS)
Source: ASX Reports, EAP
$m $m
 Registry Service Fees
Registry Service Fees are driven by the number of listed securities, with services charged per request. Volumes
generally move in line with the broader L&I Services Group.
 Warrants Fees
Warrants Fees are driven by the number of new series
listed & value of the series, with fees charged per new
series listed & an annual fee. Warrants is a growing
segment, up 112% from $2.2m in 2H09 to $4.6m in
1H12. Chart 18.
CHART 18: WARRANTS & ASX FEES
1.5
2.0
2.5
3.0
3.5
4.0
4.5
5.0
5.5
6.0
0
500
1,000
1,500
2,000
2,500
3,000
3,500
4,000
4,500
Number of New WarrantsSeries ASXStructured Products FeesA$m (RHS)
Source: ASX Reports, EAP
 Initial Listing Fees
Initial Listing Fees are the smallest revenue contributor to the L&I Services segment (1.2% segment total), with
revenues driven by IPO value and fees are charged as a % of the IPO value. IPO capital raised is highly cyclical,
and most recently is down 70.4% in FY12 to A$6,791m. However, the previous corresponding period included QRN
($6.2bn) & WRT ($8.4bn). Chart 19.
CHART 19: INITIAL CAPITAL RAISED & ASX FEES
0.0
2.0
4.0
6.0
8.0
10.0
12.0
0
5,000
10,000
15,000
20,000
25,000
Initial CapitalRaised A$m (LHS) Initial Listing Fees(RHS)
Source: ASX Reports, EAP
$m $m
19
Segment 3 – Cash Market
ASX’s third second largest segment, driven by volume and value traded, it generates revenue from three separate
segments:
o Clearing (37.5% of segment revenues; 8.0% Group revenues);
o Settlement (33.2% segment; 7.0% Group revenues); and
o Trading (29.3% segment; 6.2% Group revenues).
Revenues are down 19.9% since 1H08 peak of $80.2m to $66.9m in 1H12, with a -4.1% CAGR since
1H09.
 Clearing
Clearing revenues are a % of the executed trade value. Clearing revenues have remained flat since 1H11 at
~$25.1m.
 Settlement
Revenue is driven by volume traded, with revenue generated as a fixed charge payable per settlement request.
 Trading
This segment has been directly impacted by loss of market share, lower margins and slowing cyclical volumes.
Revenue is generated as a percentage of the traded value with a maximum cap per trade of $75. Average daily
traded value has been flat at ~$5bn since 1H10, whilst revenues have steadily declined since 1H10 then
remained stable since 1H11. Chart 20. The number of daily trades has increased from ~117k in Jan 06 to ~633k in
Feb 12, whilst the value per trade has declined from ~$28k to ~$7.6k, driven by high frequency and algorithmic
trading. Chart 21.
CHART 20: DAILY VALUE TRADED & CASH MARKET FEES
0.0
15.0
30.0
45.0
60.0
75.0
90.0
105.0
0.0
1.0
2.0
3.0
4.0
5.0
6.0
7.0
Average Dailyvalue traded $m (LHS) Cash Market Fees (RHS)
Source: ASX Reports, EAP
$bn $m
CHART 21: AVERAGE DAILY TRADING (A$b) CHART 22: MARKET CAP& VELOCITY (VAL/MKT CAP)
0
5,000
10,000
15,000
20,000
25,000
30,000
35,000
0
100
200
300
400
500
600
700
800
900
Average DailyTransactionsLHS ('000s) Value per trade RHS($)
Source: ASX Reports, EAP
85%
90%
95%
100%
105%
110%
115%
120%
0.0
200.0
400.0
600.0
800.0
1,000.0
1,200.0
1,400.0
1,600.0
Market Capitalisation LHS ($bn) Trading VelocityRHS (%)
Source: ASX Reports, EAP
$bn %
20
Segment 4 - Information Services
This segment provides access to products and market data from ASX’s equities and derivatives trading systems,
live access to company releases and other related fundamental information. Revenues are driven by the total
number of terminal connections, with ~84% of revenue related to cash market and equity options trading and
~16% relating to futures and options trading.
In 1H12, ASX observed that professional data usage was stable, but retail data usage (including day traders) was
down. The number of ASX terminals declined 13% in 1H12, reducing revenues by 3.2%. Chart 23.
CHART 23: INFORMATION SERVICES
16.0
20.0
24.0
28.0
32.0
36.0
40.0
0
20,000
40,000
60,000
80,000
100,000
120,000
ASX& SFE Terminals LHS Information ServicesRevenue RHS($m)
Source: ASX Reports, EAP
Segment 5 - Technical Services
This segment provides trade execution and data services:
o Connectivity fees are charged on workstations, open interfaces and networks used to access the cash and
derivatives markets.
o Co-location hosting services are also offered, allowing ASX members to place their infrastructure within the
same physical data centre as the ASX primary matching engines.
This segment has been growing steadily, with a CAGR of 16.3% since 1H09. The number of devices installed with
customers has increased steadily since 2H09, up 18.5% to 1H12, driven by increased demand for terminals as well
as new products, including ASX Net commissioned during FY11. Growth options include the ASX Data Centre,
expected for completion in 2Q 2012, which will greatly increase hosting and connectivity services.
CHART 24: TECHNICAL SERVICES
0.0
5.0
10.0
15.0
20.0
25.0
2,200
2,300
2,400
2,500
2,600
2,700
2,800
2,900
3,000
Total devicesLHS Technical Services Fee Revenue RHS ($m)
Source: ASX Reports, EAP
21
Segment 6 - Austraclear
Austraclear provides depository, settlement and registry services for fixed income securities. It is a growing
segment, up 14.8% CAGR since 2H09, with both volumes and revenue increasing. 1H12 revenues were 5.6%
higher hoh, with transaction volumes +5.6% and holding balances on average +8.7% higher than 2H11. Charts
25-26.
CHART 25: SETTLEMENT VOLUMES, FEEREVENUE CHART 26: AUSTRACLEAR HOLDING BALANCES
0.0
3.0
6.0
9.0
12.0
15.0
18.0
21.0
24.0
4,800
5,000
5,200
5,400
5,600
5,800
6,000
6,200
6,400
Average daily settlement volume LHS Austraclear Fee Revenue RHS ($m)
Source: ASX Reports, EAP
-2.0%
0.0%
2.0%
4.0%
6.0%
8.0%
10.0%
600
700
800
900
1,000
1,100
1,200
1,300
1,400
Holdings($bn)LHS Growth (%) RHS
Source: ASX Reports, EAP
Segment 7 - Other Revenue
Other revenues include (i) fees on delayed settlements and (ii) ASX and Austraclear participation fees. Revenues
have remained flat since the cyclical low of 1H09.
Sector consolidation
Sector consolidation is being driven by exchange incumbents’ market share loss, margin decline and rising IT capex
spend. As the cash equities trading segment is becoming a competitive, low-margin commodity service, one
possible response is seeking acquisitions to increase operating leverage.
ASX as acquirer
The new CEO is yet to articulate his M&A agenda. However, as an acquirer, ASX has a wide range of options
including: (i) smaller offshore exchanges; (ii) bolt-on acquisitions to complement existing revenue lines; (iii) larger
acquisitions such as Computershare (registry business) or IRESS (market information services, 18.9% owned by
ASX); and (iv) expansion into adjacent segments such as investor relations advisory or the wider range of
businesses within the CPU portfolio.
ASX as target
In our view, a takeover of the ASX is unlikely for at least the next 2 years. However, the CFR’s March
2012 recommendations are incrementally creating the conditions for ASX to become a longer-term
target.
On 8 April 2011, SGX’s proposed acquisition of ASX was rejected due to (i) national interest grounds; and (ii)
concern regarding local market integrity during a systemic crisis. This prompted the Government to review the
applicable regulatory framework. The CFR’s recommendations for mandatory domestic location of markets
infrastructure and step-in rights during a systemic risk event could provide appropriate safeguards
even if the ASX were foreign-owned. The remaining obstacle for ASX as a target would be political
support.
22
International consolidation
Currently, there is resistance to international mergers of national incumbent exchanges, driven by a combination
of: (i) parochial interests; (ii) anti-trust concerns; and (iii) fear of further international integration post-GFC.
However, we expect consolidation pressures will re-emerge as (i) GFC memories fade; (ii) global corporations push
for global equity capital markets solutions as debt capital becomes scarcer in a de-leveraging, Basel 3 world; and
(iii) incumbent exchanges become less relevant as new entrants capture market share and develop regional or
global platforms.
Several intra-national exchange mergers have occurred including: (i) Micex and RTS (Russia); (ii) US exchanges
(CME, CBOT and NYMEX; Nasdaq and Philadelphia Exchange; NYSE and American Stock Exchange); and (iii)
European exchanges (eg. Euronext; NOREX).
Some international mergers have occurred: (i) Nasdaq OMX (Stockholm); and (ii) NYSE Euronext (Frankfurt, Paris,
Brussels exchanges). However, international consolidation has mostly been resisted including:
o ASX’s proposed merger with NZX in 2001 was rejected by NZX.
o Deustche Borse and NYSE Euronext proposed’s Feb 2012 merger was blocked by the European Commission
on fears it would create a monopoly in derivatives and clearing.
o SGX and ASX was blocked on fears of systemic risk in the event of a financial crisis.
o London Stock Exchange (LSE)’s proposed merger in 2011 with Canada’s TMX Group was abandoned after a
negative domestic reaction.
o LSE rejected bids by Deutsche Borse in 1999 and 2000 and then Nasdaq in 2006 and 2007.
o Nasdaq OMX and Intercontintental Exchange’s hostile bid in 2011 for NYSE Euronext was stopped by the US
Justice Department.
23
5. KEY RISKS
Regulatory Risk
Best execution
ASIC has introduced new Market Integrity Rules which require brokers to deliver “best execution” for their clients.
Given Chi-X's main selling point is its cheaper pricing, for retail orders “best execution” may mean retail brokers
would be compelled to join Chi-X.
However, ASIC recently announced (i) a delay to introduction of mandatory “best execution” from 1 October 2012
to 1 March 2013; and (ii) brokers may avoid alternative trading platforms altogether if it would not provide a better
result for clients.
The risks of mandatory “best execution” to ASX are mitigated by the fact that ASX’s cash equities trading business
only contributed 6.2% of 1H12 revenues.
OTC Derivatives clearing
Global regulatory change, such as the US’s Dodd-Frank Act and Europe’s market infrastructure regulation, is driving
over-the-counter (OTC) derivatives onto electronic platforms that will have to be cleared by central counterparties.
Central clearing of OTC derivatives is an upside risk for ASX, particularly considering the CFR’s recommendation of
mandatory onshore infrastructure raises barriers to entry .
Cyclical risks
A 10% increase in the total listed equity market cap translates to ~ 9.1% FY13F EPS increase for ASX
(and vice versa). Key drivers are futures & options, daily cash equities, CHESS statements and terminals. Table
5.
Competition
We have included the arrival of competition in derivatives, settlements and clearing into our base case valuation,
even though there is no current competitor in these segments.
24
FINANCIAL SUMMARY
ASX ASX
As at: 12/04/2012 Recommendation: Positive Share Price $31.33
Year end June 2011A 2012E 2013E 2014E
INCOME STATEMENT
Sales Revenue $m 618 634 708 733
Consolidated EBITDA $m 482 488 550 570
D&A $m (23) (28) (36) (44)
Consolidated EBIT $m 459 460 515 525
Net Interest $m 38 44 44 44
Tax Expense $m 150 152 168 171
Associates/Minorities $m 0 0 0 0
Adj NPAT $m 357 362 401 409
NRIs $m (4) 0 0 0
Reported NPAT $m 352 362 401 409
Shares on Issue (end period) m 175 175 175 175
EFPOWA m 175 175 175 175
EPS ¢ 204.0 206.4 228.9 233.3
DPS ¢ 183.2 185.7 205.9 209.8
Franking % 100% 100% 100% 100%
GROWTH/PROFITABILITY RATIOS
Sales Growth % 5.0% 2.7% 11.6% 3.6%
EBITDA Growth % 6.2% 1.2% 12.8% 3.5%
EBIT Growth % 5.4% 0.2% 11.9% 2.1%
EPS Growth % 5.7% 1.2% 10.9% 1.9%
EBITDA/Sales % 78.1% 76.9% 77.8% 77.7%
EBIT/Sales % 74.3% 72.5% 72.7% 71.6%
EBIT Interest Cover x (12.2) (10.5) (11.7) (11.9)
Tax Rate % 29.6% 29.6% 29.5% 29.5%
ROE % 12.0% 12.0% 13.2% 13.3%
ROFE % 28.2% 34.7% 38.2% 37.9%
CASH FLOW
EBITDA $m 482 488 550 570
Change in Working Capital $m 12 (12) 0 0
Other $m (17) 0 0 0
Gross Operating Cash Flow $m 477 475 550 570
Net Interest Paid $m 36 45 44 44
Tax Paid $m (142) (152) (168) (171)
Net Operating Cash Flow $m 371 368 427 443
Maintenance Capex $m
Free Cash Flow $m 371 368 427 443
Dividends Paid $m (304) (325) (361) (361)
Expansionary Capex $m (47) (54) (69) (86)
Acquisitions $m
Asset Sales $m 0 0 0 0
Dividends Received $m 10 10 10 10
Shares Issues/Buybacks $m 45 0 0 0
Other $m (474) 0 0 0
Increase in Net Cash/(Debt) $m (398) (1) 7 7
GOCF/EBITDA % 99% 97% 100% 100%
Total Capex/Sales % 7.6% 8.5% 9.7% 11.7%
Total Capex/Depreciation x 2.0 1.9 1.9 1.9
Year end June 2011A 2012E 2013E 2014E
VALUATION METRICS
PER x 15.4 15.2 13.7 13.4
P/EG (2YR) x 1.3 1.2
Dividend Yield % 5.8% 5.9% 6.6% 6.7%
EV/EBITDA x 7.9 7.8 6.9 6.7
EV/EBIT x 8.3 8.3 7.4 7.2
P/FCF x 14.8 14.9 12.9 12.4
P/BV x 1.8 1.8 1.8 1.8
BALANCE SHEET
Assets
Cash $m 1,952 1,937 1,944 1,944
Working Capital $m 267 133 133 133
PP&E $m 57 81 114 156
Intangibles $m 2,318 2,316 2,316 2,316
Investments $m 1,581 2,073 2,073 2,073
Other $m 8 10 10 10
Total Assets $m 6,182 6,550 6,590 6,631
Liabilities
Debt $m 250 250 250 250
Working Capital $m 258 104 104 104
Other $m 2,532 3,096 3,096 3,096
Total Liabilities $m 3,161 3,532 3,532 3,532
Equity $m 3,021 3,018 3,058 3,099
Capital Employed $m 1,319 1,332 1,365 1,406
Net Debt/(Cash) $m (1,702) (1,687) (1,694) (1,694)
Net Debt/Equity % (56.3%) (55.9%) (55.4%) (54.6%)
Net Debt/Debt+Equity % (129)% (127)% (124)% (120)%
Net Debt/EBITDA x (3.5) (3.5) (3.1) (3.0)
Working Capital/Sales % 1.4% 4.6% 4.1% 4.0%
D&A/PP&E % 40.8% 34.4% 31.1% 28.5%
DCF VALUATION $m $/share
Risk Free Rate 5.5% Equity Value 5,504 $31.42
Market Risk Premium 5.5% (Net Debt)/Cash 552 $3.15
Beta 1.00 Franking Credits $
WACC 11.0% DCF Valuation $34.58
Listings & Issuer Services $m 150 140 167 179
Cash Market $m 134 131 134 116
Derivatives $m 172 194 213 227
Information Services $m 71 71 86 95
Technical Services $m 40 47 52 57
Group Revenue $m 618 634 708 733
DIVISIONAL SUMMARY
69%
71%
73%
75%
77%
79%
81%
2010 2011 2012 2013 2014
Margin Trends
EBITDA/Sales EBIT/Sales
-16
-15
-14
-13
-12
-11
-10
-135%
-120%
-105%
-90%
-75%
-60%
-45%
2010 2011 2012 2013 2014
Gearing & Interest Cover
Net Debt/Net Debt+Equity (%) EBIT Interest Cover (x)
4%
10%
16%
22%
28%
34%
40%
2010 2011 2012 2013 2014
Return Trends
ROE ROA ROFE - Reported
25
RESEARCH RECOMMENDATION DEFINITIONS
Positive Stock is expected to outperform the S&P/ASX 200 over the coming 24 months
Neutral Stock expected to perform in line with the S&P/ASX 200 over the coming 24 months
Negative Stock is expected to underperform the S&P/ASX 200 over the coming 24 months
Speculative Stock has limited history from which to derive a fundamental investment view or its prospects
are highly dependent on event risk, eg. Successful exploration, scientific breakthrough, high
commodity prices, regulatory change, etc.
Suspended Stock is temporarily suspended due to compliance with applicable regulatory and/or Evans &
Partners policies in circumstances where Evans & Partners is acting in an advisory capacity.
Not Rated Stock is not included in our investment research universe.
Research Criteria Definitions
Recommendations are primarily determined with reference to how a stock ranks relative to the S&P/ASX 200 on
the following criteria:
Valuation Rolling 12 month prospective multiples (composite of Price-to-Earnings Ratio, Dividend
Yield and EV/EBITDA), or long-term NPV for resource stocks.
Earnings Outlook Forecast 2 year EPS growth.
Earnings Momentum Percentage change in the current consensus EPS estimate for the stock (rolling 1 year
forward basis) over the consensus EPS estimate for the stock 3 months ago.
Shareholder Returns Composite of forecast ROE (rolling 1 year forward basis) and the percentage change in
ROE over 2 years.
Debt Servicing Capacity Rolling 12 month EBIT Interest Cover ratio.
Cyclical Risk Qualitative assessment of the 2 year outlook for a stock/industry’s profit cycle.
Industry Quality Qualitative assessment of an industry’s growth/returns potential and company specific
management capability.
Financial Transparency If we don’t understand it, we won’t recommend it.
For stocks where Evans & Partners does not generate its own forecasts, Bloomberg consensus data is used.
Analysts can introduce other factors when determining their recommendation, with any material factors stated in
the written research where appropriate.
26
GENERAL RESEARCH DISCLAIMER, WARNING & DISCLOSURES
This document is provided by Evans and Partners ABN 85 125 338 785, holder of AFSL 318075.
The information is general advice only and does not take into consideration an investor’s objectives, financial situation or needs. Before acting on
the advice, investors should consider the appropriateness of the advice, having regard to the investor’s objectives, financial situation and needs. If
the advice relates to a financial product that is the subject of a Product Disclosure Statement (e.g. unlisted managed funds) investors should obtain
the PDS and consider it before making any decision about whether to acquire the product.
The material contained in this document is for information purposes only and does not constitute an offer, solicitation or recommendation with
respect to the purchase or sale of securities. It should not be regarded by recipients as a substitute for the exercise of their own judgment.
Investors should be aware that past performance is not an infallible indicator of future performance and future returns are not guaranteed.
Any opinions and/or recommendations expressed in this material are subject to change without notice and Evans and Partners is not under any
obligation to update or keep current the information contained herein. References made to third parties are based on information believed to be
reliable but are not guaranteed as being accurate.
This document is provided to the recipient only and is not to be distributed to third parties without the prior consent of Evans and Partners.
EVANS AND PARTNERS DISCLOSURE OF INTERESTS
Evans and Partners and its respective officers and associates may have an interest in the securities or derivatives of any entities referred to in this
material.
Evans and Partners does, and seeks to do, business with companies that are the subject of its research reports.
EVANS AND PARTNERS CORPORATE RELATIONSHIP DISCLOSURE
AFI: Evans and Partners have arranged, managed or co-managed a public offering of the company or its affiliates in the past 12 months.
AYUHA: Evans and Partners have arranged, managed or co-managed a public offering of the company or its affiliates in the past 12 months.
BHP: A director of Evans and Partners Pty Ltd Advisory Board is a director of BHP Billiton Ltd.
BSL: A director of Evans and Partners Pty Ltd Advisory Board is a director of BlueScope Steel Ltd.
BOQ, BOQPA, BOQPC: A director of Evans and Partners Pty Ltd Advisory Board is a director of Bank of Queensland.
CBA: Evans and Partners managed or co-managed a public offering of securities of the company or its affiliates in the past 12 months.
CBAHA: Evans and Partners managed or co-managed a public offering of securities of the company or its affiliates in the past 12 months.
CNGHA: Evans and Partners managed or co-managed a public offering of securities of the company or its affiliates in the past 12 months.
HHY: Evans and Partners has been appointed by the Issuer as Broker to an on-market buy-back. Accordingly, Evans and Partners is unable to give
Sellers advice in respect to a sale of this security.
LLC: A director of Evans and Partners Pty Ltd Advisory Board is a director of Lend Lease Corporation Ltd.
MEF: Evans and Partners has been appointed by the Issuer as Broker to an on-market buy-back. Accordingly, Evans and Partners is unable to give
Sellers advice in respect to a sale of this security.
MQG: MQCPA: A director of Evans and Partners Pty Ltd Advisory Board is a director of Macquarie Group Ltd.
ORG: A director of Evans and Partners Pty Ltd Advisory Board is a director of Origin Energy Ltd.
PPC: Evans and Partners managed or co-managed a public offering of securities of the company or its affiliates in the past 12 months.
OOH: Evans and Partners have arranged, managed or co-managed a public offering of the company or its affiliates in the past 12 months.
SAR: Evans and Partners managed or co-managed a public offering of securities of the company or its affiliates in the past 12 months.
SPT: Evans and Partners acted in an advisory capacity for the bidder in relation to the proposed offer made to Spotless Group as announced 9 May
2011.
TOX: Evans and Partners managed or co-managed a public offering of securities of the company or its affiliates in the past 12 months.
RESEARCH ANALYST CERTIFICATION
I, George Gabriel, CFA, hereby certify that all the views expressed in this report accurately reflect my personal views about the subject investment
theme &/or company securities. I also certify that no part of my compensation was, is, or will be, directly or indirectly, related to the specific
recommendations or views expressed in this report.
RESEARCH ANALYST DISCLOSURE OF INTEREST
I, George Gabriel, CFA, &/or entities in which I have a pecuniary interest, have an exposure to the following securities &/or managed products: TGA.
DISCLAIMER
Except for any liability which cannot be excluded, Evans & Partners, its directors, employees & agents accept no liability or responsibility whatsoever
for any loss or damage of any kind, direct or indirect, arising out of the use of all or any part of this material. All information is correct at the time
of publication; additional information may be available upon request.

More Related Content

What's hot

Goldcorp Offer Needs to be Bumped
Goldcorp Offer Needs to be BumpedGoldcorp Offer Needs to be Bumped
Goldcorp Offer Needs to be BumpedBrent Walker
 
Transaction analysis goldcorp and osisko
Transaction analysis   goldcorp and osiskoTransaction analysis   goldcorp and osisko
Transaction analysis goldcorp and osiskoBrent Walker
 
Invest in Edelweiss Balanced Advantage Fund - Sept'21 | Edelweiss MF
Invest in Edelweiss Balanced Advantage Fund - Sept'21 | Edelweiss MFInvest in Edelweiss Balanced Advantage Fund - Sept'21 | Edelweiss MF
Invest in Edelweiss Balanced Advantage Fund - Sept'21 | Edelweiss MFJuneRobert1
 
SBI Dynamic Asset Allocation Fund: An Open-ended Dynamic Asset Allocation Sch...
SBI Dynamic Asset Allocation Fund: An Open-ended Dynamic Asset Allocation Sch...SBI Dynamic Asset Allocation Fund: An Open-ended Dynamic Asset Allocation Sch...
SBI Dynamic Asset Allocation Fund: An Open-ended Dynamic Asset Allocation Sch...SBI Mutual Fund
 
KB Star Funds - Factsheet (20160630)
KB Star Funds - Factsheet (20160630)KB Star Funds - Factsheet (20160630)
KB Star Funds - Factsheet (20160630)kbasset
 
IDFC Focused Equity Fund _Fund presentation
IDFC Focused Equity Fund _Fund presentationIDFC Focused Equity Fund _Fund presentation
IDFC Focused Equity Fund _Fund presentationJubiIDFCEquity
 
SBI Magnum Balanced Fund: An Open-ended Balanced Scheme - Sep 16
SBI Magnum Balanced Fund: An Open-ended Balanced Scheme - Sep 16SBI Magnum Balanced Fund: An Open-ended Balanced Scheme - Sep 16
SBI Magnum Balanced Fund: An Open-ended Balanced Scheme - Sep 16SBI Mutual Fund
 
KB Star Funds - Presentation Material (201606)
KB Star Funds - Presentation Material (201606)KB Star Funds - Presentation Material (201606)
KB Star Funds - Presentation Material (201606)kbasset
 
Kb value focus korea equity
Kb value focus korea equityKb value focus korea equity
Kb value focus korea equitykbasset
 
Presentation On Dsp Merril Lynch Mutual Fund
Presentation On Dsp Merril Lynch Mutual FundPresentation On Dsp Merril Lynch Mutual Fund
Presentation On Dsp Merril Lynch Mutual Fundkaps_makkar
 
Due diligence document
Due diligence documentDue diligence document
Due diligence documentkbasset
 
Dsp floater fund nfo presentation
Dsp floater fund nfo presentationDsp floater fund nfo presentation
Dsp floater fund nfo presentationDSP Mutual Fund
 
ICICI Prudential Equity Savings Fund Series 1- Presentation
ICICI Prudential Equity Savings Fund Series 1- PresentationICICI Prudential Equity Savings Fund Series 1- Presentation
ICICI Prudential Equity Savings Fund Series 1- Presentationiciciprumf
 
Indus Motors Toyota Pakistan Financial Ratio Analysis
Indus Motors Toyota Pakistan Financial Ratio AnalysisIndus Motors Toyota Pakistan Financial Ratio Analysis
Indus Motors Toyota Pakistan Financial Ratio AnalysisMuhammad Zahid
 
Slides of my investment strategy (updated @ March '18)
Slides of my investment strategy (updated @ March '18)Slides of my investment strategy (updated @ March '18)
Slides of my investment strategy (updated @ March '18)Giuseppe Piazzolla
 
Marketing materials presentation material kb value focus korea equity_20151211
Marketing materials presentation material kb value focus korea equity_20151211Marketing materials presentation material kb value focus korea equity_20151211
Marketing materials presentation material kb value focus korea equity_20151211kbasset
 
Importance of Asset Allocation
Importance of Asset AllocationImportance of Asset Allocation
Importance of Asset Allocationaditya72
 
Marketing materials factsheet
Marketing materials factsheetMarketing materials factsheet
Marketing materials factsheetkbasset
 

What's hot (19)

Goldcorp Offer Needs to be Bumped
Goldcorp Offer Needs to be BumpedGoldcorp Offer Needs to be Bumped
Goldcorp Offer Needs to be Bumped
 
Transaction analysis goldcorp and osisko
Transaction analysis   goldcorp and osiskoTransaction analysis   goldcorp and osisko
Transaction analysis goldcorp and osisko
 
DSP Tax Saver Fund
DSP Tax Saver FundDSP Tax Saver Fund
DSP Tax Saver Fund
 
Invest in Edelweiss Balanced Advantage Fund - Sept'21 | Edelweiss MF
Invest in Edelweiss Balanced Advantage Fund - Sept'21 | Edelweiss MFInvest in Edelweiss Balanced Advantage Fund - Sept'21 | Edelweiss MF
Invest in Edelweiss Balanced Advantage Fund - Sept'21 | Edelweiss MF
 
SBI Dynamic Asset Allocation Fund: An Open-ended Dynamic Asset Allocation Sch...
SBI Dynamic Asset Allocation Fund: An Open-ended Dynamic Asset Allocation Sch...SBI Dynamic Asset Allocation Fund: An Open-ended Dynamic Asset Allocation Sch...
SBI Dynamic Asset Allocation Fund: An Open-ended Dynamic Asset Allocation Sch...
 
KB Star Funds - Factsheet (20160630)
KB Star Funds - Factsheet (20160630)KB Star Funds - Factsheet (20160630)
KB Star Funds - Factsheet (20160630)
 
IDFC Focused Equity Fund _Fund presentation
IDFC Focused Equity Fund _Fund presentationIDFC Focused Equity Fund _Fund presentation
IDFC Focused Equity Fund _Fund presentation
 
SBI Magnum Balanced Fund: An Open-ended Balanced Scheme - Sep 16
SBI Magnum Balanced Fund: An Open-ended Balanced Scheme - Sep 16SBI Magnum Balanced Fund: An Open-ended Balanced Scheme - Sep 16
SBI Magnum Balanced Fund: An Open-ended Balanced Scheme - Sep 16
 
KB Star Funds - Presentation Material (201606)
KB Star Funds - Presentation Material (201606)KB Star Funds - Presentation Material (201606)
KB Star Funds - Presentation Material (201606)
 
Kb value focus korea equity
Kb value focus korea equityKb value focus korea equity
Kb value focus korea equity
 
Presentation On Dsp Merril Lynch Mutual Fund
Presentation On Dsp Merril Lynch Mutual FundPresentation On Dsp Merril Lynch Mutual Fund
Presentation On Dsp Merril Lynch Mutual Fund
 
Due diligence document
Due diligence documentDue diligence document
Due diligence document
 
Dsp floater fund nfo presentation
Dsp floater fund nfo presentationDsp floater fund nfo presentation
Dsp floater fund nfo presentation
 
ICICI Prudential Equity Savings Fund Series 1- Presentation
ICICI Prudential Equity Savings Fund Series 1- PresentationICICI Prudential Equity Savings Fund Series 1- Presentation
ICICI Prudential Equity Savings Fund Series 1- Presentation
 
Indus Motors Toyota Pakistan Financial Ratio Analysis
Indus Motors Toyota Pakistan Financial Ratio AnalysisIndus Motors Toyota Pakistan Financial Ratio Analysis
Indus Motors Toyota Pakistan Financial Ratio Analysis
 
Slides of my investment strategy (updated @ March '18)
Slides of my investment strategy (updated @ March '18)Slides of my investment strategy (updated @ March '18)
Slides of my investment strategy (updated @ March '18)
 
Marketing materials presentation material kb value focus korea equity_20151211
Marketing materials presentation material kb value focus korea equity_20151211Marketing materials presentation material kb value focus korea equity_20151211
Marketing materials presentation material kb value focus korea equity_20151211
 
Importance of Asset Allocation
Importance of Asset AllocationImportance of Asset Allocation
Importance of Asset Allocation
 
Marketing materials factsheet
Marketing materials factsheetMarketing materials factsheet
Marketing materials factsheet
 

Viewers also liked

Ensayo de bonos y acciones
Ensayo de bonos y accionesEnsayo de bonos y acciones
Ensayo de bonos y accionesedgladysmora
 
Aula de Engenharia Genética sobre Enzimas de restrição
Aula de Engenharia Genética sobre Enzimas de restriçãoAula de Engenharia Genética sobre Enzimas de restrição
Aula de Engenharia Genética sobre Enzimas de restriçãoJaqueline Almeida
 
Flexigroup (FXL) - initiation report
Flexigroup (FXL) - initiation report   Flexigroup (FXL) - initiation report
Flexigroup (FXL) - initiation report George Gabriel
 
SKAKI πανελληνια πρωταθληματα μαθητων μαθητριων 2017
SKAKI πανελληνια πρωταθληματα μαθητων μαθητριων 2017SKAKI πανελληνια πρωταθληματα μαθητων μαθητριων 2017
SKAKI πανελληνια πρωταθληματα μαθητων μαθητριων 2017Lia Papapetrou-2nd Geniko Lykeio Echedorou
 
Henderson Group (HGG) - initiation report
Henderson Group (HGG) - initiation report   Henderson Group (HGG) - initiation report
Henderson Group (HGG) - initiation report George Gabriel
 
Japara (JHC) equity research initiation report - riding the silver tsunami -...
Japara (JHC) equity research initiation report  - riding the silver tsunami -...Japara (JHC) equity research initiation report  - riding the silver tsunami -...
Japara (JHC) equity research initiation report - riding the silver tsunami -...George Gabriel
 
Citadel Group (CGL) - initiation report - latent value in a trusted it servic...
Citadel Group (CGL) - initiation report - latent value in a trusted it servic...Citadel Group (CGL) - initiation report - latent value in a trusted it servic...
Citadel Group (CGL) - initiation report - latent value in a trusted it servic...George Gabriel
 
Credit Corp - turnaround in performance
Credit Corp - turnaround in performance Credit Corp - turnaround in performance
Credit Corp - turnaround in performance George Gabriel
 
Credit Corp (CCP) - leading indicators in consumer debt recovery sector
Credit Corp (CCP) - leading indicators in consumer debt recovery sector Credit Corp (CCP) - leading indicators in consumer debt recovery sector
Credit Corp (CCP) - leading indicators in consumer debt recovery sector George Gabriel
 
Credit Corp (CCP) - corporate turnaround road map
Credit Corp (CCP) - corporate turnaround road mapCredit Corp (CCP) - corporate turnaround road map
Credit Corp (CCP) - corporate turnaround road mapGeorge Gabriel
 
Bitconnect coin
Bitconnect coinBitconnect coin
Bitconnect coinNurul Huda
 
Digital Disruptors Conference - an investment framework for online stock inve...
Digital Disruptors Conference - an investment framework for online stock inve...Digital Disruptors Conference - an investment framework for online stock inve...
Digital Disruptors Conference - an investment framework for online stock inve...George Gabriel
 
Computershare (CPU) initiation report - well-priced quality franchise with fr...
Computershare (CPU) initiation report - well-priced quality franchise with fr...Computershare (CPU) initiation report - well-priced quality franchise with fr...
Computershare (CPU) initiation report - well-priced quality franchise with fr...George Gabriel
 

Viewers also liked (20)

Ensayo de bonos y acciones
Ensayo de bonos y accionesEnsayo de bonos y acciones
Ensayo de bonos y acciones
 
Ethernet tutorial
Ethernet tutorialEthernet tutorial
Ethernet tutorial
 
Aula de Engenharia Genética sobre Enzimas de restrição
Aula de Engenharia Genética sobre Enzimas de restriçãoAula de Engenharia Genética sobre Enzimas de restrição
Aula de Engenharia Genética sobre Enzimas de restrição
 
Silabo actividad2.1
Silabo actividad2.1Silabo actividad2.1
Silabo actividad2.1
 
Flexigroup (FXL) - initiation report
Flexigroup (FXL) - initiation report   Flexigroup (FXL) - initiation report
Flexigroup (FXL) - initiation report
 
SKAKI πανελληνια πρωταθληματα μαθητων μαθητριων 2017
SKAKI πανελληνια πρωταθληματα μαθητων μαθητριων 2017SKAKI πανελληνια πρωταθληματα μαθητων μαθητριων 2017
SKAKI πανελληνια πρωταθληματα μαθητων μαθητριων 2017
 
Cardiology apps 2013
Cardiology apps 2013Cardiology apps 2013
Cardiology apps 2013
 
Henderson Group (HGG) - initiation report
Henderson Group (HGG) - initiation report   Henderson Group (HGG) - initiation report
Henderson Group (HGG) - initiation report
 
Japara (JHC) equity research initiation report - riding the silver tsunami -...
Japara (JHC) equity research initiation report  - riding the silver tsunami -...Japara (JHC) equity research initiation report  - riding the silver tsunami -...
Japara (JHC) equity research initiation report - riding the silver tsunami -...
 
smoking
smokingsmoking
smoking
 
Citadel Group (CGL) - initiation report - latent value in a trusted it servic...
Citadel Group (CGL) - initiation report - latent value in a trusted it servic...Citadel Group (CGL) - initiation report - latent value in a trusted it servic...
Citadel Group (CGL) - initiation report - latent value in a trusted it servic...
 
Credit Corp - turnaround in performance
Credit Corp - turnaround in performance Credit Corp - turnaround in performance
Credit Corp - turnaround in performance
 
Credit Corp (CCP) - leading indicators in consumer debt recovery sector
Credit Corp (CCP) - leading indicators in consumer debt recovery sector Credit Corp (CCP) - leading indicators in consumer debt recovery sector
Credit Corp (CCP) - leading indicators in consumer debt recovery sector
 
Redes industriales
Redes industrialesRedes industriales
Redes industriales
 
Credit Corp (CCP) - corporate turnaround road map
Credit Corp (CCP) - corporate turnaround road mapCredit Corp (CCP) - corporate turnaround road map
Credit Corp (CCP) - corporate turnaround road map
 
Negocios electronicos
Negocios electronicosNegocios electronicos
Negocios electronicos
 
Hugo folgado doutorado
Hugo folgado doutoradoHugo folgado doutorado
Hugo folgado doutorado
 
Bitconnect coin
Bitconnect coinBitconnect coin
Bitconnect coin
 
Digital Disruptors Conference - an investment framework for online stock inve...
Digital Disruptors Conference - an investment framework for online stock inve...Digital Disruptors Conference - an investment framework for online stock inve...
Digital Disruptors Conference - an investment framework for online stock inve...
 
Computershare (CPU) initiation report - well-priced quality franchise with fr...
Computershare (CPU) initiation report - well-priced quality franchise with fr...Computershare (CPU) initiation report - well-priced quality franchise with fr...
Computershare (CPU) initiation report - well-priced quality franchise with fr...
 

Similar to ASX Limited (ASX) - initiation report

ShenZhen-HongKong Connect - Another milestone achieved
ShenZhen-HongKong Connect - Another milestone achievedShenZhen-HongKong Connect - Another milestone achieved
ShenZhen-HongKong Connect - Another milestone achievedNan BAI,CFA
 
Sage Fact Sheet Jun 2015
Sage Fact Sheet Jun 2015Sage Fact Sheet Jun 2015
Sage Fact Sheet Jun 2015Alan Chu
 
IDFC Focused Equity Fund_Fund presentation
IDFC Focused Equity Fund_Fund presentationIDFC Focused Equity Fund_Fund presentation
IDFC Focused Equity Fund_Fund presentationIDFCJUBI
 
Mercer Capital's Portfolio Valuation: Private Equity Marks and Trends | Q1 2016
Mercer Capital's Portfolio Valuation: Private Equity Marks and Trends | Q1 2016Mercer Capital's Portfolio Valuation: Private Equity Marks and Trends | Q1 2016
Mercer Capital's Portfolio Valuation: Private Equity Marks and Trends | Q1 2016Mercer Capital
 
Oshkosh Activist Situation Report
Oshkosh Activist Situation ReportOshkosh Activist Situation Report
Oshkosh Activist Situation ReportAlliance Advisors
 
IDFC Large Cap Fund_Fund presentation
IDFC Large Cap Fund_Fund presentationIDFC Large Cap Fund_Fund presentation
IDFC Large Cap Fund_Fund presentationIDFCJUBI
 
IDFC Focused Equity Fund_Fund presentation
IDFC Focused Equity Fund_Fund presentationIDFC Focused Equity Fund_Fund presentation
IDFC Focused Equity Fund_Fund presentationRahulpathak154
 
2012 what drives value tilt portfolios overperformance
2012 what drives value tilt portfolios overperformance2012 what drives value tilt portfolios overperformance
2012 what drives value tilt portfolios overperformanceFrederic Jamet
 
Seattle University CFA Final Report
Seattle University CFA Final ReportSeattle University CFA Final Report
Seattle University CFA Final ReportYichen Fan
 
Alinta Ltd (AAN) -Scheme Proposal recommendation
Alinta Ltd (AAN) -Scheme Proposal recommendationAlinta Ltd (AAN) -Scheme Proposal recommendation
Alinta Ltd (AAN) -Scheme Proposal recommendationWILBUR TONG
 
SBI Dynamic Asset Allocation Fund: An Open-ended Dynamic Asset Allocation Sch...
SBI Dynamic Asset Allocation Fund: An Open-ended Dynamic Asset Allocation Sch...SBI Dynamic Asset Allocation Fund: An Open-ended Dynamic Asset Allocation Sch...
SBI Dynamic Asset Allocation Fund: An Open-ended Dynamic Asset Allocation Sch...SBI Mutual Fund
 
Kb star 2019.03 factsheet
Kb star 2019.03 factsheetKb star 2019.03 factsheet
Kb star 2019.03 factsheetkbasset
 
Kb star 2019.03 factsheet
Kb star 2019.03 factsheetKb star 2019.03 factsheet
Kb star 2019.03 factsheetkbasset
 
Global Equity Fund 2018 Annual Report
Global Equity Fund 2018 Annual ReportGlobal Equity Fund 2018 Annual Report
Global Equity Fund 2018 Annual ReportTrevorFellsPMP
 
SBI Dynamic Asset Allocation Fund: A Hybrid Mutual Fund Scheme - Aug 16
SBI Dynamic Asset Allocation Fund: A Hybrid Mutual Fund Scheme - Aug 16SBI Dynamic Asset Allocation Fund: A Hybrid Mutual Fund Scheme - Aug 16
SBI Dynamic Asset Allocation Fund: A Hybrid Mutual Fund Scheme - Aug 16SBI Mutual Fund
 
Prospect Capital Corporation (NASDAQ: PSEC) Overview July 2013
Prospect Capital Corporation (NASDAQ: PSEC) Overview July 2013Prospect Capital Corporation (NASDAQ: PSEC) Overview July 2013
Prospect Capital Corporation (NASDAQ: PSEC) Overview July 2013ClaudetteOledimmah
 
15 hartford funds the active advantage
15 hartford funds the active advantage15 hartford funds the active advantage
15 hartford funds the active advantage123jumpad
 
Computershare (CPU) initiation report - well-priced quality franchise with fr...
Computershare (CPU) initiation report - well-priced quality franchise with fr...Computershare (CPU) initiation report - well-priced quality franchise with fr...
Computershare (CPU) initiation report - well-priced quality franchise with fr...George Gabriel
 

Similar to ASX Limited (ASX) - initiation report (20)

ShenZhen-HongKong Connect - Another milestone achieved
ShenZhen-HongKong Connect - Another milestone achievedShenZhen-HongKong Connect - Another milestone achieved
ShenZhen-HongKong Connect - Another milestone achieved
 
Sage Fact Sheet Jun 2015
Sage Fact Sheet Jun 2015Sage Fact Sheet Jun 2015
Sage Fact Sheet Jun 2015
 
IDFC Focused Equity Fund_Fund presentation
IDFC Focused Equity Fund_Fund presentationIDFC Focused Equity Fund_Fund presentation
IDFC Focused Equity Fund_Fund presentation
 
DSP BlackRock A.C.E. Fund
DSP BlackRock A.C.E. FundDSP BlackRock A.C.E. Fund
DSP BlackRock A.C.E. Fund
 
Mercer Capital's Portfolio Valuation: Private Equity Marks and Trends | Q1 2016
Mercer Capital's Portfolio Valuation: Private Equity Marks and Trends | Q1 2016Mercer Capital's Portfolio Valuation: Private Equity Marks and Trends | Q1 2016
Mercer Capital's Portfolio Valuation: Private Equity Marks and Trends | Q1 2016
 
Oshkosh Activist Situation Report
Oshkosh Activist Situation ReportOshkosh Activist Situation Report
Oshkosh Activist Situation Report
 
IDFC Large Cap Fund_Fund presentation
IDFC Large Cap Fund_Fund presentationIDFC Large Cap Fund_Fund presentation
IDFC Large Cap Fund_Fund presentation
 
IDFC Focused Equity Fund_Fund presentation
IDFC Focused Equity Fund_Fund presentationIDFC Focused Equity Fund_Fund presentation
IDFC Focused Equity Fund_Fund presentation
 
2012 what drives value tilt portfolios overperformance
2012 what drives value tilt portfolios overperformance2012 what drives value tilt portfolios overperformance
2012 what drives value tilt portfolios overperformance
 
Seattle University CFA Final Report
Seattle University CFA Final ReportSeattle University CFA Final Report
Seattle University CFA Final Report
 
Alinta Ltd (AAN) -Scheme Proposal recommendation
Alinta Ltd (AAN) -Scheme Proposal recommendationAlinta Ltd (AAN) -Scheme Proposal recommendation
Alinta Ltd (AAN) -Scheme Proposal recommendation
 
Listing and Capital Raising in Australia
Listing and Capital Raising in AustraliaListing and Capital Raising in Australia
Listing and Capital Raising in Australia
 
SBI Dynamic Asset Allocation Fund: An Open-ended Dynamic Asset Allocation Sch...
SBI Dynamic Asset Allocation Fund: An Open-ended Dynamic Asset Allocation Sch...SBI Dynamic Asset Allocation Fund: An Open-ended Dynamic Asset Allocation Sch...
SBI Dynamic Asset Allocation Fund: An Open-ended Dynamic Asset Allocation Sch...
 
Kb star 2019.03 factsheet
Kb star 2019.03 factsheetKb star 2019.03 factsheet
Kb star 2019.03 factsheet
 
Kb star 2019.03 factsheet
Kb star 2019.03 factsheetKb star 2019.03 factsheet
Kb star 2019.03 factsheet
 
Global Equity Fund 2018 Annual Report
Global Equity Fund 2018 Annual ReportGlobal Equity Fund 2018 Annual Report
Global Equity Fund 2018 Annual Report
 
SBI Dynamic Asset Allocation Fund: A Hybrid Mutual Fund Scheme - Aug 16
SBI Dynamic Asset Allocation Fund: A Hybrid Mutual Fund Scheme - Aug 16SBI Dynamic Asset Allocation Fund: A Hybrid Mutual Fund Scheme - Aug 16
SBI Dynamic Asset Allocation Fund: A Hybrid Mutual Fund Scheme - Aug 16
 
Prospect Capital Corporation (NASDAQ: PSEC) Overview July 2013
Prospect Capital Corporation (NASDAQ: PSEC) Overview July 2013Prospect Capital Corporation (NASDAQ: PSEC) Overview July 2013
Prospect Capital Corporation (NASDAQ: PSEC) Overview July 2013
 
15 hartford funds the active advantage
15 hartford funds the active advantage15 hartford funds the active advantage
15 hartford funds the active advantage
 
Computershare (CPU) initiation report - well-priced quality franchise with fr...
Computershare (CPU) initiation report - well-priced quality franchise with fr...Computershare (CPU) initiation report - well-priced quality franchise with fr...
Computershare (CPU) initiation report - well-priced quality franchise with fr...
 

More from George Gabriel

Adveritas (AV1) - Is Adveritas the next Dubber (DUB)
Adveritas (AV1) - Is Adveritas the next Dubber (DUB) Adveritas (AV1) - Is Adveritas the next Dubber (DUB)
Adveritas (AV1) - Is Adveritas the next Dubber (DUB) George Gabriel
 
Adveritas (AV1) - ARR Growth Tracker
Adveritas (AV1) - ARR Growth Tracker Adveritas (AV1) - ARR Growth Tracker
Adveritas (AV1) - ARR Growth Tracker George Gabriel
 
STOCK SNAPSHOT - De.mem Limited - Water treatment tech with growing recurring...
STOCK SNAPSHOT - De.mem Limited - Water treatment tech with growing recurring...STOCK SNAPSHOT - De.mem Limited - Water treatment tech with growing recurring...
STOCK SNAPSHOT - De.mem Limited - Water treatment tech with growing recurring...George Gabriel
 
Wilsons Aged care, Health services and Retirement villages conference monda...
Wilsons Aged care, Health services and Retirement villages conference   monda...Wilsons Aged care, Health services and Retirement villages conference   monda...
Wilsons Aged care, Health services and Retirement villages conference monda...George Gabriel
 
LatAm Autos (LAA) - Investor Presentation - 24 October 2017
LatAm Autos (LAA) -  Investor Presentation - 24 October 2017LatAm Autos (LAA) -  Investor Presentation - 24 October 2017
LatAm Autos (LAA) - Investor Presentation - 24 October 2017George Gabriel
 
Henderson Global Group (HGG) - equity research initiation report
Henderson Global Group (HGG) - equity research initiation reportHenderson Global Group (HGG) - equity research initiation report
Henderson Global Group (HGG) - equity research initiation reportGeorge Gabriel
 
BT Funds Management - bigger, better, bolder BT - 20130501
BT Funds Management - bigger, better, bolder BT - 20130501BT Funds Management - bigger, better, bolder BT - 20130501
BT Funds Management - bigger, better, bolder BT - 20130501George Gabriel
 
Aged care sector - reviewing the investment case - 190215
Aged care sector - reviewing the investment case - 190215  Aged care sector - reviewing the investment case - 190215
Aged care sector - reviewing the investment case - 190215 George Gabriel
 
More Bank for your Buck - NAB
More Bank for your Buck - NAB More Bank for your Buck - NAB
More Bank for your Buck - NAB George Gabriel
 
Tech Mpire (TMP) Business Overview - August 2017
Tech Mpire (TMP) Business Overview - August 2017 Tech Mpire (TMP) Business Overview - August 2017
Tech Mpire (TMP) Business Overview - August 2017 George Gabriel
 
Tech Mpire (TMP) - Product Presentation - July 2017
Tech Mpire (TMP) - Product Presentation - July 2017 Tech Mpire (TMP) - Product Presentation - July 2017
Tech Mpire (TMP) - Product Presentation - July 2017 George Gabriel
 
Evolution of value investing - all roads lead to Graham and Doddsville
Evolution of value investing - all roads lead to Graham and DoddsvilleEvolution of value investing - all roads lead to Graham and Doddsville
Evolution of value investing - all roads lead to Graham and DoddsvilleGeorge Gabriel
 
MONEY IN THE BANK - bank sector outlook
MONEY IN THE BANK - bank sector outlook MONEY IN THE BANK - bank sector outlook
MONEY IN THE BANK - bank sector outlook George Gabriel
 
10 reasons we recommend NAB
10 reasons we recommend NAB 10 reasons we recommend NAB
10 reasons we recommend NAB George Gabriel
 
Bendigo Bank (EBN) - finding an earnings base
Bendigo Bank (EBN) - finding an earnings base Bendigo Bank (EBN) - finding an earnings base
Bendigo Bank (EBN) - finding an earnings base George Gabriel
 
George Gabriel presentation - Digital Disruptors Conference 2015
George Gabriel presentation - Digital Disruptors Conference 2015 George Gabriel presentation - Digital Disruptors Conference 2015
George Gabriel presentation - Digital Disruptors Conference 2015 George Gabriel
 
MMS - earnings implications of management equity incentives
MMS - earnings implications of management equity incentivesMMS - earnings implications of management equity incentives
MMS - earnings implications of management equity incentivesGeorge Gabriel
 
3PL - equity research - initiation report
3PL - equity research - initiation report3PL - equity research - initiation report
3PL - equity research - initiation reportGeorge Gabriel
 
FSA - equity research initiation report
FSA - equity research initiation reportFSA - equity research initiation report
FSA - equity research initiation reportGeorge Gabriel
 

More from George Gabriel (20)

Adveritas (AV1) - Is Adveritas the next Dubber (DUB)
Adveritas (AV1) - Is Adveritas the next Dubber (DUB) Adveritas (AV1) - Is Adveritas the next Dubber (DUB)
Adveritas (AV1) - Is Adveritas the next Dubber (DUB)
 
Adveritas (AV1) - ARR Growth Tracker
Adveritas (AV1) - ARR Growth Tracker Adveritas (AV1) - ARR Growth Tracker
Adveritas (AV1) - ARR Growth Tracker
 
STOCK SNAPSHOT - De.mem Limited - Water treatment tech with growing recurring...
STOCK SNAPSHOT - De.mem Limited - Water treatment tech with growing recurring...STOCK SNAPSHOT - De.mem Limited - Water treatment tech with growing recurring...
STOCK SNAPSHOT - De.mem Limited - Water treatment tech with growing recurring...
 
Wilsons Aged care, Health services and Retirement villages conference monda...
Wilsons Aged care, Health services and Retirement villages conference   monda...Wilsons Aged care, Health services and Retirement villages conference   monda...
Wilsons Aged care, Health services and Retirement villages conference monda...
 
LatAm Autos (LAA) - Investor Presentation - 24 October 2017
LatAm Autos (LAA) -  Investor Presentation - 24 October 2017LatAm Autos (LAA) -  Investor Presentation - 24 October 2017
LatAm Autos (LAA) - Investor Presentation - 24 October 2017
 
Henderson Global Group (HGG) - equity research initiation report
Henderson Global Group (HGG) - equity research initiation reportHenderson Global Group (HGG) - equity research initiation report
Henderson Global Group (HGG) - equity research initiation report
 
BT Funds Management - bigger, better, bolder BT - 20130501
BT Funds Management - bigger, better, bolder BT - 20130501BT Funds Management - bigger, better, bolder BT - 20130501
BT Funds Management - bigger, better, bolder BT - 20130501
 
Aged care sector - reviewing the investment case - 190215
Aged care sector - reviewing the investment case - 190215  Aged care sector - reviewing the investment case - 190215
Aged care sector - reviewing the investment case - 190215
 
More Bank for your Buck - NAB
More Bank for your Buck - NAB More Bank for your Buck - NAB
More Bank for your Buck - NAB
 
Tech Mpire (TMP) Business Overview - August 2017
Tech Mpire (TMP) Business Overview - August 2017 Tech Mpire (TMP) Business Overview - August 2017
Tech Mpire (TMP) Business Overview - August 2017
 
Tech Mpire (TMP) - Product Presentation - July 2017
Tech Mpire (TMP) - Product Presentation - July 2017 Tech Mpire (TMP) - Product Presentation - July 2017
Tech Mpire (TMP) - Product Presentation - July 2017
 
Evolution of value investing - all roads lead to Graham and Doddsville
Evolution of value investing - all roads lead to Graham and DoddsvilleEvolution of value investing - all roads lead to Graham and Doddsville
Evolution of value investing - all roads lead to Graham and Doddsville
 
MONEY IN THE BANK - bank sector outlook
MONEY IN THE BANK - bank sector outlook MONEY IN THE BANK - bank sector outlook
MONEY IN THE BANK - bank sector outlook
 
10 reasons we recommend NAB
10 reasons we recommend NAB 10 reasons we recommend NAB
10 reasons we recommend NAB
 
Bendigo Bank (EBN) - finding an earnings base
Bendigo Bank (EBN) - finding an earnings base Bendigo Bank (EBN) - finding an earnings base
Bendigo Bank (EBN) - finding an earnings base
 
George Gabriel presentation - Digital Disruptors Conference 2015
George Gabriel presentation - Digital Disruptors Conference 2015 George Gabriel presentation - Digital Disruptors Conference 2015
George Gabriel presentation - Digital Disruptors Conference 2015
 
MMS - earnings implications of management equity incentives
MMS - earnings implications of management equity incentivesMMS - earnings implications of management equity incentives
MMS - earnings implications of management equity incentives
 
3PL - equity research - initiation report
3PL - equity research - initiation report3PL - equity research - initiation report
3PL - equity research - initiation report
 
FSA - equity research initiation report
FSA - equity research initiation reportFSA - equity research initiation report
FSA - equity research initiation report
 
BUY Australian Banks
BUY Australian BanksBUY Australian Banks
BUY Australian Banks
 

Recently uploaded

《加州大学圣克鲁兹分校学位证书复制》Q微信741003700美国学历疑难问题指南|挂科被加州大学圣克鲁兹分校劝退没有毕业证怎么办?《UCSC毕业证购买|加...
《加州大学圣克鲁兹分校学位证书复制》Q微信741003700美国学历疑难问题指南|挂科被加州大学圣克鲁兹分校劝退没有毕业证怎么办?《UCSC毕业证购买|加...《加州大学圣克鲁兹分校学位证书复制》Q微信741003700美国学历疑难问题指南|挂科被加州大学圣克鲁兹分校劝退没有毕业证怎么办?《UCSC毕业证购买|加...
《加州大学圣克鲁兹分校学位证书复制》Q微信741003700美国学历疑难问题指南|挂科被加州大学圣克鲁兹分校劝退没有毕业证怎么办?《UCSC毕业证购买|加...wyqazy
 
Malad Escorts, (Pooja 09892124323), Malad Call Girls Service
Malad Escorts, (Pooja 09892124323), Malad Call Girls ServiceMalad Escorts, (Pooja 09892124323), Malad Call Girls Service
Malad Escorts, (Pooja 09892124323), Malad Call Girls ServicePooja Nehwal
 
VIP Kolkata Call Girl Rishra 👉 8250192130 Available With Room
VIP Kolkata Call Girl Rishra 👉 8250192130  Available With RoomVIP Kolkata Call Girl Rishra 👉 8250192130  Available With Room
VIP Kolkata Call Girl Rishra 👉 8250192130 Available With Roomdivyansh0kumar0
 
VIP Kolkata Call Girls Bidhannagar 8250192130 Available With Room
VIP Kolkata Call Girls Bidhannagar 8250192130 Available With RoomVIP Kolkata Call Girls Bidhannagar 8250192130 Available With Room
VIP Kolkata Call Girls Bidhannagar 8250192130 Available With Roomrran7532
 
如何办理圣何塞州立大学毕业证(文凭)SJSU学位证书
如何办理圣何塞州立大学毕业证(文凭)SJSU学位证书如何办理圣何塞州立大学毕业证(文凭)SJSU学位证书
如何办理圣何塞州立大学毕业证(文凭)SJSU学位证书Fir La
 
High Profile Call Girls Kolkata Trisha 🤌 8250192130 🚀 Vip Call Girls Kolkata
High Profile Call Girls Kolkata Trisha 🤌  8250192130 🚀 Vip Call Girls KolkataHigh Profile Call Girls Kolkata Trisha 🤌  8250192130 🚀 Vip Call Girls Kolkata
High Profile Call Girls Kolkata Trisha 🤌 8250192130 🚀 Vip Call Girls Kolkataanamikaraghav4
 
Methanex Investor Presentation (April 2024)
Methanex Investor Presentation (April 2024)Methanex Investor Presentation (April 2024)
Methanex Investor Presentation (April 2024)Methanex Corporation
 
Osisko Gold Royalties Ltd - Corporate Presentation, April 23, 2024
Osisko Gold Royalties Ltd - Corporate Presentation, April 23, 2024Osisko Gold Royalties Ltd - Corporate Presentation, April 23, 2024
Osisko Gold Royalties Ltd - Corporate Presentation, April 23, 2024Osisko Gold Royalties Ltd
 
VIP 7001035870 Find & Meet Hyderabad Call Girls Miyapur high-profile Call Girl
VIP 7001035870 Find & Meet Hyderabad Call Girls Miyapur high-profile Call GirlVIP 7001035870 Find & Meet Hyderabad Call Girls Miyapur high-profile Call Girl
VIP 7001035870 Find & Meet Hyderabad Call Girls Miyapur high-profile Call Girladitipandeya
 
Short-, Mid-, and Long-term gxxoals.pptx
Short-, Mid-, and Long-term gxxoals.pptxShort-, Mid-, and Long-term gxxoals.pptx
Short-, Mid-, and Long-term gxxoals.pptxHenryBriggs2
 
High Profile Call Girls Kolkata Gayatri 🤌 8250192130 🚀 Vip Call Girls Kolkata
High Profile Call Girls Kolkata Gayatri 🤌  8250192130 🚀 Vip Call Girls KolkataHigh Profile Call Girls Kolkata Gayatri 🤌  8250192130 🚀 Vip Call Girls Kolkata
High Profile Call Girls Kolkata Gayatri 🤌 8250192130 🚀 Vip Call Girls Kolkataanamikaraghav4
 
No 1 AMil Baba In Islamabad No 1 Amil Baba In Lahore No 1 Amil Baba In Faisl...
No 1 AMil Baba In Islamabad  No 1 Amil Baba In Lahore No 1 Amil Baba In Faisl...No 1 AMil Baba In Islamabad  No 1 Amil Baba In Lahore No 1 Amil Baba In Faisl...
No 1 AMil Baba In Islamabad No 1 Amil Baba In Lahore No 1 Amil Baba In Faisl...First NO1 World Amil baba in Faisalabad
 
The Concept of Humanity in Islam and its effects at future of humanity
The Concept of Humanity in Islam and its effects at future of humanityThe Concept of Humanity in Islam and its effects at future of humanity
The Concept of Humanity in Islam and its effects at future of humanityJohanAspro
 
VIP 7001035870 Find & Meet Hyderabad Call Girls Banjara Hills high-profile Ca...
VIP 7001035870 Find & Meet Hyderabad Call Girls Banjara Hills high-profile Ca...VIP 7001035870 Find & Meet Hyderabad Call Girls Banjara Hills high-profile Ca...
VIP 7001035870 Find & Meet Hyderabad Call Girls Banjara Hills high-profile Ca...aditipandeya
 
Russian Call Girls Kolkata Indira 🤌 8250192130 🚀 Vip Call Girls Kolkata
Russian Call Girls Kolkata Indira 🤌  8250192130 🚀 Vip Call Girls KolkataRussian Call Girls Kolkata Indira 🤌  8250192130 🚀 Vip Call Girls Kolkata
Russian Call Girls Kolkata Indira 🤌 8250192130 🚀 Vip Call Girls Kolkataanamikaraghav4
 
9654467111 Call Girls In Katwaria Sarai Short 1500 Night 6000
9654467111 Call Girls In Katwaria Sarai Short 1500 Night 60009654467111 Call Girls In Katwaria Sarai Short 1500 Night 6000
9654467111 Call Girls In Katwaria Sarai Short 1500 Night 6000Sapana Sha
 
VIP Kolkata Call Girl Entally 👉 8250192130 Available With Room
VIP Kolkata Call Girl Entally 👉 8250192130  Available With RoomVIP Kolkata Call Girl Entally 👉 8250192130  Available With Room
VIP Kolkata Call Girl Entally 👉 8250192130 Available With Roomdivyansh0kumar0
 

Recently uploaded (20)

《加州大学圣克鲁兹分校学位证书复制》Q微信741003700美国学历疑难问题指南|挂科被加州大学圣克鲁兹分校劝退没有毕业证怎么办?《UCSC毕业证购买|加...
《加州大学圣克鲁兹分校学位证书复制》Q微信741003700美国学历疑难问题指南|挂科被加州大学圣克鲁兹分校劝退没有毕业证怎么办?《UCSC毕业证购买|加...《加州大学圣克鲁兹分校学位证书复制》Q微信741003700美国学历疑难问题指南|挂科被加州大学圣克鲁兹分校劝退没有毕业证怎么办?《UCSC毕业证购买|加...
《加州大学圣克鲁兹分校学位证书复制》Q微信741003700美国学历疑难问题指南|挂科被加州大学圣克鲁兹分校劝退没有毕业证怎么办?《UCSC毕业证购买|加...
 
Malad Escorts, (Pooja 09892124323), Malad Call Girls Service
Malad Escorts, (Pooja 09892124323), Malad Call Girls ServiceMalad Escorts, (Pooja 09892124323), Malad Call Girls Service
Malad Escorts, (Pooja 09892124323), Malad Call Girls Service
 
VIP Kolkata Call Girl Rishra 👉 8250192130 Available With Room
VIP Kolkata Call Girl Rishra 👉 8250192130  Available With RoomVIP Kolkata Call Girl Rishra 👉 8250192130  Available With Room
VIP Kolkata Call Girl Rishra 👉 8250192130 Available With Room
 
VIP Kolkata Call Girls Bidhannagar 8250192130 Available With Room
VIP Kolkata Call Girls Bidhannagar 8250192130 Available With RoomVIP Kolkata Call Girls Bidhannagar 8250192130 Available With Room
VIP Kolkata Call Girls Bidhannagar 8250192130 Available With Room
 
如何办理圣何塞州立大学毕业证(文凭)SJSU学位证书
如何办理圣何塞州立大学毕业证(文凭)SJSU学位证书如何办理圣何塞州立大学毕业证(文凭)SJSU学位证书
如何办理圣何塞州立大学毕业证(文凭)SJSU学位证书
 
High Profile Call Girls Kolkata Trisha 🤌 8250192130 🚀 Vip Call Girls Kolkata
High Profile Call Girls Kolkata Trisha 🤌  8250192130 🚀 Vip Call Girls KolkataHigh Profile Call Girls Kolkata Trisha 🤌  8250192130 🚀 Vip Call Girls Kolkata
High Profile Call Girls Kolkata Trisha 🤌 8250192130 🚀 Vip Call Girls Kolkata
 
Call Girls 🫤 Nehru Place ➡️ 9999965857 ➡️ Delhi 🫦 Russian Escorts FULL ENJOY
Call Girls 🫤 Nehru Place ➡️ 9999965857  ➡️ Delhi 🫦  Russian Escorts FULL ENJOYCall Girls 🫤 Nehru Place ➡️ 9999965857  ➡️ Delhi 🫦  Russian Escorts FULL ENJOY
Call Girls 🫤 Nehru Place ➡️ 9999965857 ➡️ Delhi 🫦 Russian Escorts FULL ENJOY
 
Methanex Investor Presentation (April 2024)
Methanex Investor Presentation (April 2024)Methanex Investor Presentation (April 2024)
Methanex Investor Presentation (April 2024)
 
Osisko Gold Royalties Ltd - Corporate Presentation, April 23, 2024
Osisko Gold Royalties Ltd - Corporate Presentation, April 23, 2024Osisko Gold Royalties Ltd - Corporate Presentation, April 23, 2024
Osisko Gold Royalties Ltd - Corporate Presentation, April 23, 2024
 
Model Call Girl in Uttam Nagar Delhi reach out to us at 🔝9953056974🔝
Model Call Girl in Uttam Nagar Delhi reach out to us at 🔝9953056974🔝Model Call Girl in Uttam Nagar Delhi reach out to us at 🔝9953056974🔝
Model Call Girl in Uttam Nagar Delhi reach out to us at 🔝9953056974🔝
 
Model Call Girl in Udyog Vihar Delhi reach out to us at 🔝9953056974🔝
Model Call Girl in Udyog Vihar Delhi reach out to us at 🔝9953056974🔝Model Call Girl in Udyog Vihar Delhi reach out to us at 🔝9953056974🔝
Model Call Girl in Udyog Vihar Delhi reach out to us at 🔝9953056974🔝
 
VIP 7001035870 Find & Meet Hyderabad Call Girls Miyapur high-profile Call Girl
VIP 7001035870 Find & Meet Hyderabad Call Girls Miyapur high-profile Call GirlVIP 7001035870 Find & Meet Hyderabad Call Girls Miyapur high-profile Call Girl
VIP 7001035870 Find & Meet Hyderabad Call Girls Miyapur high-profile Call Girl
 
Short-, Mid-, and Long-term gxxoals.pptx
Short-, Mid-, and Long-term gxxoals.pptxShort-, Mid-, and Long-term gxxoals.pptx
Short-, Mid-, and Long-term gxxoals.pptx
 
High Profile Call Girls Kolkata Gayatri 🤌 8250192130 🚀 Vip Call Girls Kolkata
High Profile Call Girls Kolkata Gayatri 🤌  8250192130 🚀 Vip Call Girls KolkataHigh Profile Call Girls Kolkata Gayatri 🤌  8250192130 🚀 Vip Call Girls Kolkata
High Profile Call Girls Kolkata Gayatri 🤌 8250192130 🚀 Vip Call Girls Kolkata
 
No 1 AMil Baba In Islamabad No 1 Amil Baba In Lahore No 1 Amil Baba In Faisl...
No 1 AMil Baba In Islamabad  No 1 Amil Baba In Lahore No 1 Amil Baba In Faisl...No 1 AMil Baba In Islamabad  No 1 Amil Baba In Lahore No 1 Amil Baba In Faisl...
No 1 AMil Baba In Islamabad No 1 Amil Baba In Lahore No 1 Amil Baba In Faisl...
 
The Concept of Humanity in Islam and its effects at future of humanity
The Concept of Humanity in Islam and its effects at future of humanityThe Concept of Humanity in Islam and its effects at future of humanity
The Concept of Humanity in Islam and its effects at future of humanity
 
VIP 7001035870 Find & Meet Hyderabad Call Girls Banjara Hills high-profile Ca...
VIP 7001035870 Find & Meet Hyderabad Call Girls Banjara Hills high-profile Ca...VIP 7001035870 Find & Meet Hyderabad Call Girls Banjara Hills high-profile Ca...
VIP 7001035870 Find & Meet Hyderabad Call Girls Banjara Hills high-profile Ca...
 
Russian Call Girls Kolkata Indira 🤌 8250192130 🚀 Vip Call Girls Kolkata
Russian Call Girls Kolkata Indira 🤌  8250192130 🚀 Vip Call Girls KolkataRussian Call Girls Kolkata Indira 🤌  8250192130 🚀 Vip Call Girls Kolkata
Russian Call Girls Kolkata Indira 🤌 8250192130 🚀 Vip Call Girls Kolkata
 
9654467111 Call Girls In Katwaria Sarai Short 1500 Night 6000
9654467111 Call Girls In Katwaria Sarai Short 1500 Night 60009654467111 Call Girls In Katwaria Sarai Short 1500 Night 6000
9654467111 Call Girls In Katwaria Sarai Short 1500 Night 6000
 
VIP Kolkata Call Girl Entally 👉 8250192130 Available With Room
VIP Kolkata Call Girl Entally 👉 8250192130  Available With RoomVIP Kolkata Call Girl Entally 👉 8250192130  Available With Room
VIP Kolkata Call Girl Entally 👉 8250192130 Available With Room
 

ASX Limited (ASX) - initiation report

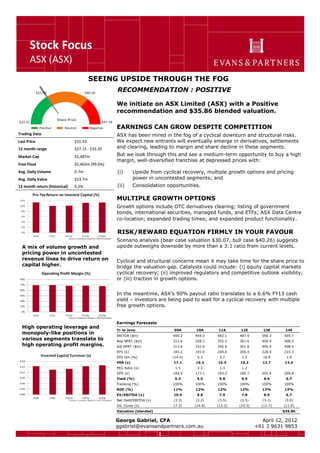
  • 1. Stock Focus ASX (ASX) 1 SEEING UPSIDE THROUGH THE FOG RECOMMENDATION : POSITIVE We initiate on ASX Limited (ASX) with a Positive recommendation and $35.86 blended valuation. EARNINGS CAN GROW DESPITE COMPETITION ASX has been mired in the fog of a cyclical downturn and structural risks. We expect new entrants will eventually emerge in derivatives, settlements and clearing, leading to margin and share decline in these segments. But we look through this and see a medium-term opportunity to buy a high margin, well-diversified franchise at depressed prices with: (i) Upside from cyclical recovery, multiple growth options and pricing power in uncontested segments; and (ii) Consolidation opportunities. MULTIPLE GROWTH OPTIONS Growth options include OTC derivatives clearing; listing of government bonds, international securities, managed funds, and ETFs; ASX Data Centre co-location; expanded trading times; and expanded product functionality. RISK/REWARD EQUATION FIRMLY IN YOUR FAVOUR Scenario analysis (bear case valuation $30.07, bull case $40.26) suggests upside outweighs downside by more than a 3:1 ratio from current levels. Cyclical and structural concerns mean it may take time for the share price to bridge the valuation gap. Catalysts could include: (i) equity capital markets cyclical recovery; (ii) improved regulatory and competitive outlook visibility; or (iii) traction in growth options. In the meantime, ASX’s 90% payout ratio translates to a 6.6% FY13 cash yield – investors are being paid to wait for a cyclical recovery with multiple free growth options. Trading Data Last Price $31.33 12 month range $27.15 - $33.20 Market Cap $5,487m Free Float $5,465m (99.6%) Avg. Daily Volume 0.7m Avg. Daily Value $23.7m 12 month return (historical) 0.2% A mix of volume growth and pricing power in uncontested revenue lines to drive return on capital higher. High operating leverage and monopoly-like positions in various segments translate to high operating profit margins. Earnings Forecasts Yr to June 09A 10A 11A 12E 13E 14E EBITDA ($m) 400.2 454.0 482.1 487.9 550.3 569.7 Rep NPAT ($m) 313.6 328.1 352.3 361.6 400.9 408.5 Adj NPAT ($m) 313.6 332.6 356.6 361.6 400.9 408.5 EPS (¢) 183.2 193.0 204.0 206.4 228.9 233.3 EPS Gth (%) (14.4) 5.3 5.7 1.2 10.9 1.9 PER (x) 17.1 16.2 15.4 15.2 13.7 13.4 PEG Ratio (x) 1.5 2.3 1.3 1.2 DPS (¢) 164.9 173.1 183.2 185.7 205.9 209.8 Yield (%) 5.3 5.5 5.8 5.9 6.6 6.7 Franking (%) 100% 100% 100% 100% 100% 100% ROE (%) 11% 12% 12% 12% 13% 13% EV/EBITDA (x) 10.4 9.9 7.9 7.8 6.9 6.7 Net Debt/EBITDA (x) (3.3) (2.2) (3.5) (3.5) (3.1) (3.0) Int. Cover (x) (7.3) (14.8) (12.2) (10.5) (11.7) (11.9) Valuation (blended) $35.86 George Gabriel, CFA ggabriel@evansandpartners.com.au April 12, 2012 +61 3 9631 9853
  • 2. 2 CONTENTS 1 SUMMARY INVESTMENT CONSIDERATIONS 3 2. VALUATION 5  EAP valuation  Key value drivers  Bear/Base/Bull cases  Historical valuation perspectives  Global comparables 3. COMPETITION 10  Contested revenue lines o Equities trading o Clearing o Settlements o Derivatives  Competitive response o ASX alternative trading facilities o Pricing strategies o Growth options  Key competitor overview 4. COMPANY OVERVIEW 14  Business overview  Segmental overview o Derivatives o Listing and Issuer Services o Cash Market o Information Services o Technical Services o Austraclear o Other revenue  Sector consolidation o ASX as acquirer o ASX as target o International consolidation 5. KEY RISKS 23  Regulatory risk o “Best execution” o OTC Derivatives clearing  Cyclical outlook  Competition 6. FINANCIAL SUMMARY 24
  • 3. 3 1. SUMMARY INVESTMENT CONSIDERATIONS ASX is currently trading on bottom-of-cycle FY13F PE of 13.7x, with a 6.6% fully franked yield, offering cyclical recovery upside and multiple free growth options. 1. Undemanding valuation reflects uncertain regulatory, competitive and cyclical outlooks. a. PE discount. ASX is trading at a discount to its average PE since 2000 of ~18x. Chart 3. b. Domestic peer-relative discount. ASX is trading at a discount relative to the ASX Industrials, compared to its premium from Mar 2005. Chart 4. c. Global peer-relative discount. ASX’s PE is in line with European and North American peers, who are already post-competition, which supports the view that ASX’s share price already discounts the impact of competition. Chart 7-8. 2. Positive risk/reward ratio a. ASX offers a positive risk/reward ratio of 3.3x (assuming a $31.50 purchase price). b. Our valuation scenarios quantify a range of key drivers: market value; market share loss; pricing discounts (ie. margin decline) and price increases in uncontested segments. c. Table 1 summarises our bear, bull and base cases. Our $30.07 bear case valuation factors in low market cap growth, market share loss (in derivatives, clearing, settlement and cash market trading), pricing discount in competed segments and price increases in uncontested segments. 3. Effective pricing strategies a. Pricing power exercised in uncontested segments. Prices have increased for annual listings; secondary raisings; cash equities settlement and registry services. b. Derivatives and market data pricing reviews are soon to be announced. c. Price discounting in cash equities trading. In June 2010, ASX pre-emptively reduced cash equities trading fees in anticipation of the arrival of competition. We do not expect further material price reductions given ASX is already pricing is at the lower end of international exchange pricing. d. Annual pricing reviews. ASX has committed to at least an annual review of pricing across its business portfolio. 4. High sensitivity to cyclical recovery a. A 10% increase in the total listed equity market cap translates to ~ 9.1% FY13F EPS increase for ASX. Key drivers are futures & options, daily cash equities, CHESS statements and terminals. Table 5. 5. Multiple growth options mitigate headwinds in a post-monopoly competitive environment. a. Competition is currently only in cash equities trading, comprising 6.2% of 1H12 revenues. b. Our base case assumes new entrants in derivatives, settlement and clearing by FY15. c. Medium-term growth options exist including OTC derivatives clearing; listing of government bonds, international securities, managed funds, and ETFs; ASX Data Centre co-location; expanded trading times; and expanded product functionality.
  • 4. 4 6. Consolidation options. a. As an acquirer, ASX has a wide range of options including: (i) smaller offshore exchanges; (ii) bolt-on acquisitions in its various revenue lines; or (iii) a larger acquisition such as the purchase of Computershare (registry business), IRESS (market information services, 18.9% owned by ASX) etc.. The new CEO is yet to articulate his M&A agenda. b. A takeover/merger with the ASX is unlikely in the short-medium term. On 8 April 2011, SGX’s acquisition of ASX was rejected on national interest grounds. The existing 15% shareholder cap requires political consent for removal, which is currently unlikely. c. However, the Council of Financial Regulators’ (CFR) recommendations are potentially creating the conditions for long-term consolidation. The recommendations of step-in rights and mandatory onshore location of clearing and settlement infrastructure address some of the concerns highlighted in consideration of the proposed SGX-ASX takeover. 7. What’s next? a. Council of Financial Regulators (CFR) report due “shortly” on whether clearing and settlement should be opened up to competition. b. ASX Data Centre expected for completion in 2Q 2012. This facility will accommodate co-location of customers’ IT infrastructure with ASX for the purposes of increasing execution speed. c. OTC Equity Clear will be launched in May 2012, allowing institutional investors to trade equity options with any expiry date and electable strike price without any ISDA requirements. d. OTC equity derivatives clearing on track to go live in 2H12. e. OTC interest rate swap clearing subject to evolving regulatory framework. f. Listing international depositary receipts by July 2012, subject to ASIC approval. ASX plans to offer depositary receipts in Xstrata, BHP Billiton, Rio Tinto, HSBC Holdings, with other depositary receipts issued on demand. g. New product launches (electricity derivatives targeted 2H12; equity index derivatives expected 1H13; exchange traded option enhancements due FY13; carbon trading end of FY13). h. Mandatory “best execution” review in March 2013. ASIC will decide whether “best execution” effectively compels all brokers to sign up with Chi-X. i. Managed fund trading service from FY13. ASX is looking to use existing technology to allow investors to apply for and redeem unlisted managed funds. j. Review “dark pool” minimum order size in April 2015. If dark pool market share becomes excessive, ASIC will increase the minimum order size to $50k (compared to ASX average of ~$7.6k per trade). ASX wants immediate introduction of the $50k dark pool minimum trade size.
  • 5. 5 2. VALUATION EAP Valuation Our base case blended valuation of $35.86 is comprised as set out in Table 1: TABLE 1: EAP BLENDED VALUATION Methodology Key Inputs Value ($ps) Discounted Cash Flow 11.0% WACC $34.58 Capitalisation of Earnings 3-yr EV/EBITDA average $37.34 Market Relative 3-yr average PE $35.66 Average $35.86 Source: EAP Research estimates Key Value Drivers The key drivers of ASX shareholder value are: (i) Market value growth; (ii) Market share loss to new entrants; (iii) Product pricing; and (iv) Growth options. Base Case Our base case assumptions for each value driver are summarised below. (i) Market Value We assume cross-cycle market index value growth of 7.0% pa, in line with the 6.8% 20-year average. Chart 2. CHART 1: ASX200 INDEX LEVEL CHART 2: ANNUAL CHANGE IN ASX200 (ii) Market Share Loss We expect that ASX will eventually lose market share to new entrants in Derivatives, Clearing and Settlements (even though there are no current competitors). See Sections 3 and 4 of this report for a comprehensive discussion of competitive threats & an overview of each segment, respectively.  Derivatives – 10% market share loss by 1H15. o We believe Derivatives is less susceptible than other segments to competition given the challenge of drawing liquidity to a new entrant (network effect), greater perceived counter-party risk (given longer contract terms) and cash margining requirements.
  • 6. 6  Clearing – 20% share loss by 1H15. o LCH Clearnet has expressed an interest in entering the local market. o The regulator is expected to release a policy report “shortly”. With the Council for Financial Regulators recommending mandatory onshore clearing infrastructure, barriers for new entrants are being elevated.  Settlement – 30% market share loss by 1H15. o We believe cash equities settlement is the most commoditised segment and so faces the greatest volume and margin risk.  Cash Market Trading – 30% market share loss by 1H14. o Market share loss is the sum of both dark pools and Chi-X market share gains. o Currently, Chi-X has ~2% market share and dark pools ~10%. o We note that in Canada (the most comparable market to Australia), Chi-X only gained ~10% share, implying some upside risk to EAP’s base case. (iii) Product Pricing Beyond already announced near-term price increases (see Section 3 of this report for a summary), our base case assumes 4% pa price increases in uncontested segments and price declines of between 10% (trading, clearing, derivatives) and 30% (settlement) in segments which we believe will ultimately face competition. (iv) Growth Options Our base case does not include growth options, providing a key source of upside risk (refer Section 3 “Growth options”).
  • 7. 7 Bear and Bull cases In our view, the bear case valuation of $30.07 discounts a highly pessimistic scenario. Buyers of ASX stock at around $30 will enjoy a significant margin of safety. Whilst the $40.26 bull case valuation is possible, the share price is unlikely to reach these levels until there is some visibility on the competitive outlook for Derivatives, Clearing and Settlements. TABLE 2: BEAR AND BULL CASE SUMMARY Driver Description Bear case Base case Bull case Comments Market value Annual market index growth from 1H14 4% 7% 10% Market value growth is a key revenue driver for a number of segments including Listings & Capital Raisings, Cash Market Trading Value, Information & Technical Services. Market share loss Derivatives – market share loss by 1H15 30% 10% 0% Clearing – market share loss by 1H15 40% 20% 10% Settlement – market share loss by 1H15 50% 30% 20% Cash market trading – market share loss by 1H14 50% 30% 15% Pricing discounts Trading – additional price discount in 1H13 30% 10% 0% Clearing – price discount in 1H14. 20% 10% 0% Settlement – price discount in FY14 as competition commoditises this service 50% 30% 0% Derivatives –price discount in 1H15 25% 10% 0% Price increases Annual price increases in all other segments 3% 4% 5% Our base case includes announced price increases in certain segments. We also assume uncontested segments will increase prices over time. Blended valuation $30.07 $35.86 $40.26 Source: EAP Our base case sees market share losses in 4 segments: derivatives, clearing, settlements and cash market equities. Our base case also includes price discounting in segments which we believe will ultimately face competition.
  • 8. 8 Historical valuation perspectives ASX’s depressed valuation reflects the overhang of cyclical and structural concerns. We note the following valuation trends: o PE declining from 25x to ~14.0x FY13F. Chart 3. o PE discount to the ASX Industrials. Chart 4. o Price/book valuation multiple of ~1.6x at bottom of historical range. Chart 5. o EV/EBITDA multiple of 10.0x at bottom of historical range. Chart 6. CHART 3: 12 MONTH FORWARD PE RATIO CHART 4: PER RELATIVE TO ASX INDUSTRIALS 12.5 15.0 17.5 20.0 22.5 25.0 27.5 Source:Bloomberg 0.6 0.8 1.0 1.2 1.4 1.6 1.8 Source: Bloomberg, EAP CHART 5: P/B VALUE (POST SFE MERGER) CHART 6: EV TO EBITDA 1.0 1.5 2.0 2.5 3.0 3.5 4.0 Jul-06 Jul-07 Jul-08 Jul-09 Jul-10 Jul-11 Source: Factset, EAP Global comparables ASX’s PE is in line with European and North American exchanges which are already post-competition. Charts 7-8. Table 3. However, it is not clear that ASX will suffer the same degree of market share loss as its North American and European exchange incumbents given: o ASX is more broadly diversified. o ASX retains multiple growth options. o ASX could capture growing Asian capital flows through a strategic alliance or international listings. o ASX’s pre-emptive competitive responses may mitigate share loss (refer Section 3 “Competitive response” below). o Rising barriers to entry in clearing and settlement decrease the likelihood of new entrants.
  • 9. 9 CHART 7: PER RELATIVE TO GLOBAL COMPS CHART 8: PER RELATIVE TO GLOBAL COMPS HKExch&Clearing BursaMalaysia SingaporeExchange BolsaMexicana NZX IntercontintenalExch CBOE BM&FBovespa CME ASX WarsawSE JohanesburgSE BolsasyME TMXGroup NYSEEuronext DeustcheBorse LSE NasdaqOMX 0.0 5.0 10.0 15.0 20.0 25.0 30.0 Source: Factset TABLE 3: GLOBAL COMPARABLES 2012 2013 2012 2013 2012 2013 2012 2013 2012 2013 Asia-Pac Australian Stock Exchange AUD 31.33 5487 4851 15.2 13.7 8.3 7.4 5.9 6.6 1.2 10.9 12.0 13.2 HK Exchanges and Clearing HKD 128.5 138768 93530 25.8 23.4 15.1 13.5 3.5 3.9 5.7 10.4 56.5 57.3 Singapore Exchange SGD 6.74 7223 6530 23.4 21.1 17.7 15.8 3.9 4.3 -3.0 11.1 37.0 39.9 Bursa Malaysia MYR 7.06 3755 3221 24.8 21.9 15.6 13.7 4.8 5.4 4.4 13.0 17.4 19.5 Osaka Securities Exchange JPY 459000 123930 82288 NZX NZD 2.78 336 323 18.9 16.4 13.4 11.8 4.4 4.9 22.5 15.6 25.3 27.0 Average Asia-Pac 23.2 20.7 15.4 13.7 4.2 4.6 7.4 12.5 34.1 35.9 Americas CME USD 282.09 18742 19759 16.1 13.9 9.3 8.1 4.2 4.3 2.4 15.3 5.4 6.0 BM&F Bovespa BRL 11.13 22037 21016 13.5 11.9 16.1 14.0 4.5 5.5 3.2 13.2 7.1 7.9 NYSE Euronext USD 27.48 7098 8741 11.2 9.2 8.7 7.4 4.5 4.6 -1.5 22.2 9.2 10.1 Intercontintenal exchange USD 132.18 9595 9660 16.5 14.7 10.8 9.4 0.0 0.0 14.5 12.0 17.5 17.6 Nasdaq OMX USD 24.59 4264 5596 9.1 8.0 7.1 6.3 0.0 0.3 7.8 13.5 9.4 10.2 TMX Group CAD 44.2 3301 3240 11.5 10.5 8.3 7.6 3.7 3.8 4.4 9.7 21.8 20.7 CBOE USD 27 2397 2262 16.4 14.3 8.3 7.2 1.9 2.1 5.9 14.7 54.9 45.0 Bolsa Mexicana MXN 25.94 15382 13339 20.3 16.6 12.4 9.8 4.5 5.5 12.3 21.9 14.4 17.1 Average Americas 14.3 12.4 10.1 8.7 2.9 3.3 6.1 15.3 17.4 16.8 Europe Deustche Borse EUR 49.135 9483 10035 10.4 9.6 8.0 7.5 4.9 5.2 2.9 8.6 24.9 23.7 London Stock Exchange GBp 1023 277344 277576 11.4 11.4 6.9 7.2 2.9 3.1 38.9 0.2 20.1 17.4 Warsaw Stock Exchange PLN 39.2 1054 876 13.5 12.1 6.3 5.6 5.4 6.2 -9.8 12.0 23.1 24.2 Bolsas y Mercados Espanoles EUR 18.3 1530 1174 10.5 10.6 5.8 5.7 9.1 8.8 -3.3 -0.9 32.3 31.5 Oslo Bors NOK 66 2838 1945 Average Europe 11.5 10.9 6.7 6.5 5.6 5.8 7.2 5.0 25.1 24.2 Other Dubai Financial Market AED 1.21 9680 9018 80.7 43.2 162.6 48.9 1.3 2.2 400.0 86.7 1.4 2.8 Johanesburg Stock Exchange ZAr 8000 695021 694006 13.5 12.2 11.6 10.7 4.0 4.9 6.7 10.4 31.8 29.8 Average other 47.1 27.7 87.1 29.8 2.7 3.5 203.4 48.5 16.6 16.3 Source: EAP, Bloomberg ASX global comparable companies ROE (%) Crncy Share price Mkt cap Ent. Value P/E RATIO EV/EBIT (x) YIELD EPS GROWTH (%)
  • 10. 10 3. COMPETITION Contested Revenue Lines Currently, only Cash Equities Trading faces competition from a new entrant, Chi-X. However, our base case assumes competition will progressively arrive over time to FY15F in Equities Clearing, Equities Settlements and Derivatives. We consider each of these segments below. (i) Cash Equities Trading This segment is now less relevant to ASX given it contributed only 6.2% of 1H12 revenues. Table 4. Our base case assumes an additional 10% price decline in 1H13 and 30% share loss by 1H14 comprising: (i) dark pool market share of 15% (currently ~10%); and (ii) Chi-X share of 15% (currently ~2%). There is an upside risk that ASX retains greater market share than our base case because: o ASX pre-emptively cut its pricing such that it is now priced at the bottom end of international peers (refer section 3 “Pricing strategies”). o ASX’s vertically integrated trading, clearing and settlement offers customers a convenient “one-stop-shop” trading solution. o Incurring capex to adopt new trading platforms makes less sense when equities trading prices are already declining. o It is unclear whether brokers will be mandatorily required to adopt new entrant trading platforms. ASIC appears to be moving towards the view that “best execution” does not dictate that brokers must mandatorily adopt new entrants’ trading platforms (refer section 5 “Regulatory Change”).  Equities Trading – international experience of new entrants New entrants have captured as little as 3% share (Tokyo) and as high as 36% (FTSE100). o London. Within the first 12 months, Chi-X Europe/BATS captured 20%+ of FTSE100 share and currently has ~36%. o Toronto. The Toronto Stock Exchange lost ~ 35% share to new trading venues. o Tokyo. After its debut last year, Chi-X’s market share remains less than 3%. However, Japanese regulation prevents new entrants from exceeding 10% share, which may have limited the interest of market participants. (ii) Clearing Although ASX Clear is currently the monopoly clearing house, our base case view assumes (i) 5% share loss in 1H14 which stabilises at 20% share in 1H15; and (ii) 10% price decline in 1H14. Price decline is mitigated by the fact that clearing requires counter-party risk acceptance and so clearers will likely price for their perceived financial stability. We expect that clearing houses with global ambitions such as European Multilateral Clearing Facility (EMCF) and LCH Clearnet will eventually enter the Australian market. However, smaller players such as LSE’s Turquoise, Six-x- clear, EuroCCP, Nasdaq OMX and Burgundy Exchange are increasingly less likely to do so as the CFR’s regulatory entry barriers are raised. Regionally, BNP Paribas offers clearing and custody solutions in India, Hong Kong and Singapore. It already offers third-party clearing for listed derivatives in Australia and hopes to offer third-party clearing services for cash equities in Australia by end of 2012, subject to regulatory approval.  Council of Financial Regulators (CFR) recommendations In March 2012, the Australian Consumer and Competition Commission (ACCC) and the CFR (comprising the Reserve Bank of Australia, Treasury, APRA and ASIC) proposed significant changes to Australia’s financial market infrastructure regulation: (i) Clearing and settlement infrastructure must be physically located in Australia; (ii) Regulator’s “step in” powers to take control of systemically important financial institutions such as the ASX in the event of a systemic crisis.
  • 11. 11 The next stage of the CFR’s review is to consider whether clearing and settlement should be opened up to competition – a report is close to being finalised. (iii) Settlements Our base case view is: (i) 30% cash equities settlements share loss by 1H15; and (ii) 30% price declines in FY14 as this segment becomes commoditised. (iv) Derivatives Our base case view is: (i) 10% market share loss; and (ii) 10% price decline by 1H15. Share loss is mitigated by: (i) the network effect of incumbent exchange’s liquidity maintaining share; and (ii) derivatives are seen to have greater counterparty risk due to longer contract duration and margining requirements. Competitive Responses ASX’s competitive responses include the following: (i) launching Alternative Trading Facilities; (ii) pricing strategies; (iii) creating growth options; and (iv) product innovations. ASX Alternative Trading Facilities (ATF) ASX has launched two ATFs: (i) VolumeMatch - an anonymous large order execution venue; (ii) PureMatch - an execution venue aimed at high frequency traders to compete directly with Chi-X for HFT order flow. Neither ATF has gained traction and both are being reviewed. Pricing strategies ASX is adopting an effective range of pricing strategies to simultaneously pre-empt competition, retain volumes and maximise profitability across its business portfolio. Pricing strategies include: (i) price discounting in contested revenue lines; (ii) exercising pricing power in uncontested revenue lines; and (iii) rebates. It has committed to annual pricing reviews across its business portfolio.  Price discounts In June 2010, ASX announced changes to its cash equities trading execution fees and rebates. o Price discounts in cash market equities trading: (i) headline trading prices cut from 0.28bp to 0.15bp per side; (ii) on-market crossing fees from 0.15bp to 0.1bp; and (iii) off-market crossing fees from 0.75bp to 0.05bp. o Rebates for large participants in cash market equities were terminated, whilst rebates for futures customers remained. We expect minimal further downside on cash equities pricing given ASX is more competitively priced than many European exchanges (eg. Spain’s BME and Germany’s Deutsche Boerse and UK’s LSE range from 0.71% to 1.39%) and is only slightly above US exchanges (NYSE 0.13% and Nasdaq 0.13%).  Price increases Price increases in uncontested revenue lines highlight ASX’s pricing power in certain segments. A pricing review in Derivatives is soon to be announced. Increases include: o Annual listing fees–increased from 1 July 2012 o ~23% price increase for companies with a market cap of greater than $10bn o ~26% increase for a market cap between $1bn-$10bn. o Secondary raising fee increases of ~10% from July 2012. o Cash equities settlement fees increased by between 9 – 50% from Feb 2012. o Registry services fees (CHESS) increased +10% from $1 to $1.10 from April 2012, for the first time in 7 years. o Market connectivity fees increased for the first time since Oct 2006 for equities and Jan 2003 for futures from June 2010.
  • 12. 12 Growth options We describe below 9 growth options ASX is currently developing.  International securities The ASX CEO has said the quoting of international securities (such as BP, Royal Dutch Shell or HSBC) is a key strategic goal over the next year. ASX could either: (i) attract primary listings from other jurisdictions; or (ii) form cross-listing alliances with other exchanges. ASX is currently in talks with the LSE about a cross-listing alliance. By July 2012, subject to ASIC approval, ASX plans to offer depositary receipts in Xstrata, BHP, Rio Tinto and HSBC, with other depositary receipts issued on demand. Richard Murphy, ASX GM Equity Markets, says this is a “game changer for the shape of the Australian market”.  Exchange Traded Funds (ETFs) BetaShares estimates that there are ~75 listed ETFs, with the market cap increasing $51m to $5.2bn in Feb 2012 (~$9m of new listings), compared to 60 listed ETFs in Feb 2012. Blackrock’s iShares and Russell Investments recently launched the first 6 fixed-interest ETFs on the ASX. Vanguard and State Street have also indicated they intend to release products in the first half of the year 2012.  Commonwealth Government Securities (CGS) Retail CGS listing is targeted for FY13.  Enhancing capital raising flexibility ASX proposes listed companies with market cap of less than $300m be able to issue up to 25% of its value, comprising 15% without shareholder approval and an additional 10% at a maximum discount of 25% within 12 months of gaining investor consent. This expands the existing position which restricts raisings to a maximum of 15%. This measure would bring the ASX in line with Canada’s existing 25% limit and NY and HK’s 20% limits.  Expanded trading times ASX intends to increase its relevance to Perth and mining stocks. Of the 2200 ASX listed companies, 830 are WA-based of which 614 (28% of total listed stocks) are resources stocks. Perth is supposed to be a gateway to Asia, but the ASX closes at Asia’s lunchtime. ASX is considering extending operating hours by two hours.  Flow-through share scheme A flow-through enables the transfer of tax deductions of individual small exploration companies to individual investors, which arguably facilitates equity funding for miners. ASX is discussing this proposal with the Government but expects it is a 3-5 year project given Budgetary constraints. Flow-through share schemes would harmonise ASX capital raising rules with HK, Toronto, London and Singapore exchanges.  Managed Fund Service ASX is looking to use existing technology to allow investors to apply for and redeem unlisted managed funds, with a launch date targeted in FY13.  OTC clearing ASX plans to develop OTC clearing facilities: (i) OTC equity derivative clearing “on track” to go live in 2H12; and (ii) OTC interest rate swap clearing dependant on regulatory framework.
  • 13. 13  ASX Data Centre Expected for completion in 2Q 2012, this facility will accommodate co-location of customers’ IT infrastructure with ASX for the purposes of increasing execution speed. Product innovation  CentrePoint CentrePoint is a new order crossing type aimed at reducing market impact costs (by allowing order entry at the mid-point of quoted bid-ask spreads).  Equity options liberalisation OTC Equity Clear will be launched in May 2012, allowing institutional investors to trade equity options with any expiry date and electable strike price without any ISDA requirements. ASX hopes Australian institutional investors will embrace equity options to the same extent as their American peers. In the US in 2000, total option volume was ~60% individual investors/40% institutional. In 2012, this has reversed to 60% institutional/40% individual. In Australia, the mix is ~25% institutional/75% retail.  Derivatives Electricity derivatives are targeted for 2H12; equity index derivatives expected 1H13; exchange traded option enhancements due FY13; and carbon trading is expected in FY13. Key competitor overview Dark pools “Dark pools” allow funds managers to execute block trades with minimal price/volume disclosure away from primary exchanges. Dark pool operators include: (i) Major stockbroking firms’ in-house dark pools; (ii) Liquidnet; and (iii) Instinet. Approx. ~10% of equities is traded via dark pools. ASIC recently suggested dark pool market share should be capped at 20%. In April 2015, ASIC will consider imposition of a minimum $50k per trade value in dark pools. ASX wants immediate introduction of the $50k dark pool minimum whilst the broking industry body Australian Financial Markets Association (AFMA) proposes ASIC only limit trading on a stock by stock basis, with only those stocks exhibiting share price volatility be banned from dark pools. Chi-X Chi-X offers a “lit” execution venue for ASX200 stocks, with operating hours (945am to 430pm) slightly longer (10am to 4pm) than the ASX, targeting high frequency traders. It commenced trading Australian equities on 4 May 2011 and currently has ~2% share. Participants expect it will capture ~15% within 6 months as confidence in its reliability grows. Chi-X is adopting liquidity based differential pricing strategies to attract liquidity suppliers to the market, which means participants who initially place a buy or sell order (“liquidity providers”) pay the lower fee of 0.06bp whilst liquidity sellers pay 0.12bp. It is owned by Chi-X Global, which also operates Chi-X Canada and Chi-X Japan. Until recently Chi-X Global was wholly owned by the Nomura Group. However, a minority stake has now been taken by BofA Merrill Lynch, Goldman Sachs, Morgan Stanley, GETCO and Quantlab.
  • 14. 14 4. COMPANY OVERVIEW Business overview ASX Limited (ASX) was formed by the merger of the Australian Stock Exchange (ASX) and the Sydney Futures Exchange (SFE) in July 2006. It performs four types of services: (i) Market Services (primary, secondary and derivative market trading services); (ii) Clearing Services for both equities and derivatives; (iii) Settlement Services for equities (ASX Settlement), derivatives (ASX Clear (Futures)) and fixed income (Austraclear); and (iv) Compliance Services which include ongoing monitoring and enforcement of compliance with the market operating rules (ASX Compliance brand). Table 4 summarises revenue trends across ASX’s 7 revenue lines. Table 5 summarises key revenue drivers and the revenue model per segment. We analyse key segment trends below. TABLE 4: DIVISIONAL REVENUE TREND ANALYSIS Revenue % 1H08 total 1H08 2H08 1H09 2H09 1H10 2H10 1H11 2H11 1H12 % 1H12 total % segment mix CAGR since 1H09 (%) Derivatives Derivatives 13.1 12.4 15.1 16.5 15.1 15.4 14.8 4.7% 15.3% 4.3% Futures & Options 56.9 51.4 57.0 58.6 67.4 74.7 81.8 26.0% 84.7% 12.9% Subtotal - Derivatives 26.4% 83.1 83.8 70.1 63.6 71.9 75.9 82.4 89.8 96.6 30.7% 100.0% 11.3% Derivatives -5.0% 21.7% 9.1% -8.2% 1.8% -4.0% Futures & Options -9.6% 10.9% 2.9% 15.0% 10.8% 9.6% Subtotal - Derivatives -9.3% 13.0% 5.5% 8.6% 9.0% 7.6% Listings and Issuer Services Annual listing fees 24.1 25.2 23.4 23.6 26.3 26.6 28.8 29.0 30.2 9.6% 44.0% 8.9% Secondary raising fees 24.9 21.2 26.2 21.8 32.7 17.6 23.9 20.7 17.7 5.6% 25.8% -12.3% Registry service fees 16.0 13.1 13.3 10.9 16.8 13.8 15.6 12.7 12.4 3.9% 18.1% -2.4% Warrants fees 7.3 5.6 4.5 2.2 2.9 3.2 3.0 3.6 4.6 1.5% 6.7% 0.7% Initial listing fees 10.3 1.6 1.8 0.6 3.4 2.9 8.2 4.9 3.7 1.2% 5.4% 27.1% Subtotal - L & I Services 26.3% 82.6 66.8 69.2 59.1 82.1 64.0 79.5 70.9 68.6 21.8% 100.0% -0.3% Annual listing fees 4.6% -7.1% 0.9% 11.4% 1.1% 8.3% 0.7% 4.1% Secondary raising fees -14.9% 23.6% -16.8% 50.0% -46.2% 35.8% -13.4% -14.5% Registry service fees -18.2% 1.6% -18.2% 54.2% -18.2% 13.0% -18.2% -2.6% Initial listing fees -84.5% 12.5% -66.7% 466.7% -14.7% 182.8% -40.2% -24.5% Warrants fees -22.3% -20.2% -51.8% 31.9% 10.5% -5.2% 18.4% 29.5% Subtotal - L & I Services -19.2% 3.7% -14.7% 38.9% -22.0% 24.1% -10.8% -3.2% Cash market Clearing 25.0 24.6 25.1 8.0% 37.5% Settlement 22.2 23.3 22.2 7.0% 33.2% Trading 19.5 19.2 19.6 6.2% 29.3% Subtotal - Cash market 25.5% 80.2 79.4 75.9 62.9 77.5 73.3 66.8 67.1 66.9 21.2% 100.0% -4.1% Clearing -1.7% 1.9% Settlement 4.9% -4.7% Trading -1.8% 2.2% Subtotal - Cash market 0.5% -0.3% Information services 10.6% 33.3 34.7 37.0 34.1 35.3 33.4 35.2 35.7 34.6 11.0% -2.2% % growth 4.1% 6.6% -7.9% 3.7% -5.3% 5.1% 1.6% -3.2% Technical services 4.2% 13.2 14.5 14.4 14.2 14.7 15.2 18.9 21.4 22.6 7.2% 16.3% % growth 9.5% -0.6% -0.9% 3.0% 3.4% 24.7% 13.3% 5.4% Austraclear services 3.5% 11.0 10.9 11.8 12.9 14.8 16.4 16.9 16.9 17.8 5.6% 14.8% % growth -1.5% 8.3% 10.0% 14.6% 10.6% 3.2% -0.3% 5.6% Other 3.6% 11.2 10.1 7.9 5.3 6.4 7.2 8.4 7.7 8.0 2.5% 0.5% % growth -10.0% -21.9% -32.4% 21.1% 12.0% 16.2% -7.9% 3.5% Total operating revenue 100.0% 314.7 300.0 286.3 252.1 302.8 285.5 308.1 309.6 315.1 100.0% 3.2% % growth -4.7% -4.6% -11.9% 20.1% -5.7% 7.9% 0.5% 1.8% Source: ASX Reports, EAP
  • 15. 15 TABLE 5: DIVISIONAL REVENUE CONTRIBUTION, SERVICES, REVENUE MODEL Segment % 1H12 revenue Services Drivers and revenue model Trends Derivatives 30.7%  Trading of exchange traded equity options (ETOs), futures and index options.  Futures and options (F&O) trading.  Contract volumes  Fixed $ fee for each side of a trade. Derivatives (ETOs) revenues are down on higher volumes but lower margins. Plans for new products. F&O revenue grew with increased pricing offsetting declining volume. Listings & Issuer Services 21.8%  Securities lodgement, holding statement production, registry updates and amendments etc Five segments:  Annual listing fees - % of market cap on regressive sliding scale  Secondary raising fees - % of value raised on regressive sliding scale  Registry service fees - flat fee per request  Initial listing fees - % of market cap on regressive sliding scale  Warrants fees - Charge per new series + annual fixed fee plus % of value. Annual listing fee increased in March 2012. Secondary capital raised declining since the 1H10 peak during the post-GFC recapitalization IPO value remains depressed Cash Market 21.2%  Secondary equity market trading, clearing and settlements services. Three segments:  Clearing - % value traded.  Settlement - Fixed charge per request.  Trading - % value traded (0.15% standard) capped at $75 per trade. Cash market trading impacted by competition, but only 6.0% 1H12 revenue. Information Services 11.0%  Access to products and market data from ASX’s equities and derivatives trading systems, live access to company releases and other related fundamental information Revenues are driven by the total number of terminal connections. Professional data usage was stable, but retail data usage (including day traders) was down. Technical Services 7.2%  Provides trade execution and data services businesses including ASX Net (high speed fibre optic communication network) and ASX Best.  ASX Data Centre, expected for completion in 2Q 2012, which will greatly increase hosting and connectivity services. Fees are charged per workstation, open interface and network used to access both the cash and derivatives markets. ASX Data Centre a growth option Austraclear 5.6%  Depository, settlement and registry services for fixed income securities. Revenue driven by settlement volume & securities holdings Listing of CGS a growth option. Other revenue 2.5%  Fees on delayed settlements  ASX and Austraclear participation fees. Fee per delay; fee per participant Revenues have remained flat since the cyclical low of 1H09 Source: EAP
  • 16. 16 Segmental overview The current impact of competition is minimal, with only cash equities trading (6.2% of 1H12 revenue) being currently contested. However, EAP’s base case assumes new entrants in: Derivatives (from 2H14), clearing (from 1H14) and settlements (from 1H14). Segment 1 – Derivatives Derivatives has been a strong segment, up from 26.4% total revenue in 1H08 to 30.7% in 1H12. Chart 11. Group Derivatives comprises two segments: (i) Derivatives (ETOs and index options); and (ii) Futures & Options (F&O). Group Derivatives revenues have increased 37.7% since 2H09, a 3 year CAGR of 11.3%, with F&O being the key growth driver. o Derivatives (ETOs and index options) revenues are down on higher volumes but lower margins. The key driver of 18.2% hoh growth in 1H12 total derivatives volume was index options growth of +61%. However, the decline in average fee per contract has driven 1H12 revenue down $0.6m to $14.8m. Charts 11-12. o F&O revenue grew with increased average pricing offsetting declining volume. Average fee per contract was up 15.1% to $1.60 in 1H12 whilst daily average contracts declined 6.3%. Chart 13. CHART 11: GROUP DERIVATIVES REVENUE 56.9 51.4 57.0 58.6 67.4 74.7 81.8 13.1 12.4 15.1 16.5 15.1 15.4 14.8 0.0 20.0 40.0 60.0 80.0 100.0 1H 09 2H 09 1H 10 2H 10 1H 11 2H 11 1H 12 Derivatives Revenue Futures & Options Revenue $m Source: ASX Reports, EAP CHART 12: DERIVATIVES (ETOs and INDEX Options) CHART 13: FUTURES & OPTIONS $0.40 $0.60 $0.80 $1.00 $1.20 $1.40 $1.60 0 20 40 60 80 100 120 Derivative Average Daily Contracts Derivatives AverageFee per Contract Source: ASX Reports, EAP 000's $0.10 $0.30 $0.50 $0.70 $0.90 $1.10 $1.30 $1.50 $1.70 $1.90 0 50 100 150 200 250 300 350 400 450 Average DailyContracts Average Fee per Contract Source: ASX Reports, EAP 000's
  • 17. 17 Segment 2 - Listings & Issuer Services ASX’s second largest segment, it generates revenue from five separate segments: (i) Annual listing fees (44.0% of segment revenues); (ii) Secondary raising fees (25.8% segment); (iii) Registry services fees (18.1% of segment); (iv) Initial listing fees (5.4% segment); and (v) Warrants fees (6.7% segment). L&I Group Revenue has been mostly flat since 1H09, with growth in annual listing fees and warrants fees offsetting declines in secondary raising fees. Earnings cyclicality is evident in Chart 14. CHART 14: LISTINGS & ISSUER SERVICES REVENUES 0.0 10.0 20.0 30.0 40.0 50.0 60.0 70.0 80.0 0.0 10.0 20.0 30.0 40.0 50.0 60.0 70.0 80.0 90.0 1H 08 2H 08 1H 09 2H 09 1H 10 2H 10 1H 11 2H 11 1H 12 Registry service fees Warrants & Debt Secondary Listing Fees Initial Listing Fees Annual Listing Fees Total Capital Raised (RHS) Source:ASX Reports, EAP $m $m  Annual Listing Fees Annual Listing Fees are driven by: (i) the number of listed entities; and (ii) total market capitalization, with fees charges as a % of market cap on a regressive sliding scale. Group L&I Services revenues have been flat since 2H09, with a constant number of listed entities since Mar 08 and a declining market index offset by increased fees. Key trends are: o New listing numbers declined 32.1% from 84 in 1H11 to 57 in 1H12. Table 6. o The number of de-listings has accelerated in 1H12 to 82. Table 6. o Total Listings have increased slightly in 2H12, though the trend over the year to February 2012 is largely flat. CHART 15: NUMBER OF LISTED ENTITIES CHART 16: ASX 200 INDEX LEVEL 1,450 1,550 1,650 1,750 1,850 1,950 2,050 2,150 2,250 2,350 Source: ASX Reports, EAP 1,450 2,450 3,450 4,450 5,450 6,450 7,450 Source: IRESS, EAP Points TABLE 6: ASX LISTINGS Listings 1H 09 2H 09 1H 10 2H 10 1H 11 2H 11 1H 12 Domestic Market Cap $bn $969 $1,098 $1,403 $1,254 $1,419 $1,349 $1,136 Listings - Opening Balance 2226 2223 2198 2181 2192 2216 2247 Number of New Listings 34 11 50 43 84 76 57 Nuber of Delistings -37 -36 -67 -32 -60 -45 -82 Listings at end 2223 2198 2181 2192 2216 2247 2222 Growth -0.1% -1.1% -0.8% 0.5% 1.1% 1.4% -1.1% Source: ASX Reports, EAP
  • 18. 18  Secondary Listing Fees Secondary Listing Fees are driven by the value of secondary capital and dividend reinvestment plans (DRPs) raised, with fees charged as a % of the dollar value raised on a regressive sliding scale. Table 5. Secondary raising fees have been declining since the 1H10 peak of $32.7m during the post-GFC recapitalization to $17.7m in 1H12. CHART 17: SECONDARY CAPITAL RAISED & ASX FEES 0.0 7.5 15.0 22.5 30.0 37.5 45.0 0 10,000 20,000 30,000 40,000 50,000 60,000 SecondaryCapitalRaised A$m (LHS) SecondaryListing Fees(RHS) Source: ASX Reports, EAP $m $m  Registry Service Fees Registry Service Fees are driven by the number of listed securities, with services charged per request. Volumes generally move in line with the broader L&I Services Group.  Warrants Fees Warrants Fees are driven by the number of new series listed & value of the series, with fees charged per new series listed & an annual fee. Warrants is a growing segment, up 112% from $2.2m in 2H09 to $4.6m in 1H12. Chart 18. CHART 18: WARRANTS & ASX FEES 1.5 2.0 2.5 3.0 3.5 4.0 4.5 5.0 5.5 6.0 0 500 1,000 1,500 2,000 2,500 3,000 3,500 4,000 4,500 Number of New WarrantsSeries ASXStructured Products FeesA$m (RHS) Source: ASX Reports, EAP  Initial Listing Fees Initial Listing Fees are the smallest revenue contributor to the L&I Services segment (1.2% segment total), with revenues driven by IPO value and fees are charged as a % of the IPO value. IPO capital raised is highly cyclical, and most recently is down 70.4% in FY12 to A$6,791m. However, the previous corresponding period included QRN ($6.2bn) & WRT ($8.4bn). Chart 19. CHART 19: INITIAL CAPITAL RAISED & ASX FEES 0.0 2.0 4.0 6.0 8.0 10.0 12.0 0 5,000 10,000 15,000 20,000 25,000 Initial CapitalRaised A$m (LHS) Initial Listing Fees(RHS) Source: ASX Reports, EAP $m $m
  • 19. 19 Segment 3 – Cash Market ASX’s third second largest segment, driven by volume and value traded, it generates revenue from three separate segments: o Clearing (37.5% of segment revenues; 8.0% Group revenues); o Settlement (33.2% segment; 7.0% Group revenues); and o Trading (29.3% segment; 6.2% Group revenues). Revenues are down 19.9% since 1H08 peak of $80.2m to $66.9m in 1H12, with a -4.1% CAGR since 1H09.  Clearing Clearing revenues are a % of the executed trade value. Clearing revenues have remained flat since 1H11 at ~$25.1m.  Settlement Revenue is driven by volume traded, with revenue generated as a fixed charge payable per settlement request.  Trading This segment has been directly impacted by loss of market share, lower margins and slowing cyclical volumes. Revenue is generated as a percentage of the traded value with a maximum cap per trade of $75. Average daily traded value has been flat at ~$5bn since 1H10, whilst revenues have steadily declined since 1H10 then remained stable since 1H11. Chart 20. The number of daily trades has increased from ~117k in Jan 06 to ~633k in Feb 12, whilst the value per trade has declined from ~$28k to ~$7.6k, driven by high frequency and algorithmic trading. Chart 21. CHART 20: DAILY VALUE TRADED & CASH MARKET FEES 0.0 15.0 30.0 45.0 60.0 75.0 90.0 105.0 0.0 1.0 2.0 3.0 4.0 5.0 6.0 7.0 Average Dailyvalue traded $m (LHS) Cash Market Fees (RHS) Source: ASX Reports, EAP $bn $m CHART 21: AVERAGE DAILY TRADING (A$b) CHART 22: MARKET CAP& VELOCITY (VAL/MKT CAP) 0 5,000 10,000 15,000 20,000 25,000 30,000 35,000 0 100 200 300 400 500 600 700 800 900 Average DailyTransactionsLHS ('000s) Value per trade RHS($) Source: ASX Reports, EAP 85% 90% 95% 100% 105% 110% 115% 120% 0.0 200.0 400.0 600.0 800.0 1,000.0 1,200.0 1,400.0 1,600.0 Market Capitalisation LHS ($bn) Trading VelocityRHS (%) Source: ASX Reports, EAP $bn %
  • 20. 20 Segment 4 - Information Services This segment provides access to products and market data from ASX’s equities and derivatives trading systems, live access to company releases and other related fundamental information. Revenues are driven by the total number of terminal connections, with ~84% of revenue related to cash market and equity options trading and ~16% relating to futures and options trading. In 1H12, ASX observed that professional data usage was stable, but retail data usage (including day traders) was down. The number of ASX terminals declined 13% in 1H12, reducing revenues by 3.2%. Chart 23. CHART 23: INFORMATION SERVICES 16.0 20.0 24.0 28.0 32.0 36.0 40.0 0 20,000 40,000 60,000 80,000 100,000 120,000 ASX& SFE Terminals LHS Information ServicesRevenue RHS($m) Source: ASX Reports, EAP Segment 5 - Technical Services This segment provides trade execution and data services: o Connectivity fees are charged on workstations, open interfaces and networks used to access the cash and derivatives markets. o Co-location hosting services are also offered, allowing ASX members to place their infrastructure within the same physical data centre as the ASX primary matching engines. This segment has been growing steadily, with a CAGR of 16.3% since 1H09. The number of devices installed with customers has increased steadily since 2H09, up 18.5% to 1H12, driven by increased demand for terminals as well as new products, including ASX Net commissioned during FY11. Growth options include the ASX Data Centre, expected for completion in 2Q 2012, which will greatly increase hosting and connectivity services. CHART 24: TECHNICAL SERVICES 0.0 5.0 10.0 15.0 20.0 25.0 2,200 2,300 2,400 2,500 2,600 2,700 2,800 2,900 3,000 Total devicesLHS Technical Services Fee Revenue RHS ($m) Source: ASX Reports, EAP
  • 21. 21 Segment 6 - Austraclear Austraclear provides depository, settlement and registry services for fixed income securities. It is a growing segment, up 14.8% CAGR since 2H09, with both volumes and revenue increasing. 1H12 revenues were 5.6% higher hoh, with transaction volumes +5.6% and holding balances on average +8.7% higher than 2H11. Charts 25-26. CHART 25: SETTLEMENT VOLUMES, FEEREVENUE CHART 26: AUSTRACLEAR HOLDING BALANCES 0.0 3.0 6.0 9.0 12.0 15.0 18.0 21.0 24.0 4,800 5,000 5,200 5,400 5,600 5,800 6,000 6,200 6,400 Average daily settlement volume LHS Austraclear Fee Revenue RHS ($m) Source: ASX Reports, EAP -2.0% 0.0% 2.0% 4.0% 6.0% 8.0% 10.0% 600 700 800 900 1,000 1,100 1,200 1,300 1,400 Holdings($bn)LHS Growth (%) RHS Source: ASX Reports, EAP Segment 7 - Other Revenue Other revenues include (i) fees on delayed settlements and (ii) ASX and Austraclear participation fees. Revenues have remained flat since the cyclical low of 1H09. Sector consolidation Sector consolidation is being driven by exchange incumbents’ market share loss, margin decline and rising IT capex spend. As the cash equities trading segment is becoming a competitive, low-margin commodity service, one possible response is seeking acquisitions to increase operating leverage. ASX as acquirer The new CEO is yet to articulate his M&A agenda. However, as an acquirer, ASX has a wide range of options including: (i) smaller offshore exchanges; (ii) bolt-on acquisitions to complement existing revenue lines; (iii) larger acquisitions such as Computershare (registry business) or IRESS (market information services, 18.9% owned by ASX); and (iv) expansion into adjacent segments such as investor relations advisory or the wider range of businesses within the CPU portfolio. ASX as target In our view, a takeover of the ASX is unlikely for at least the next 2 years. However, the CFR’s March 2012 recommendations are incrementally creating the conditions for ASX to become a longer-term target. On 8 April 2011, SGX’s proposed acquisition of ASX was rejected due to (i) national interest grounds; and (ii) concern regarding local market integrity during a systemic crisis. This prompted the Government to review the applicable regulatory framework. The CFR’s recommendations for mandatory domestic location of markets infrastructure and step-in rights during a systemic risk event could provide appropriate safeguards even if the ASX were foreign-owned. The remaining obstacle for ASX as a target would be political support.
  • 22. 22 International consolidation Currently, there is resistance to international mergers of national incumbent exchanges, driven by a combination of: (i) parochial interests; (ii) anti-trust concerns; and (iii) fear of further international integration post-GFC. However, we expect consolidation pressures will re-emerge as (i) GFC memories fade; (ii) global corporations push for global equity capital markets solutions as debt capital becomes scarcer in a de-leveraging, Basel 3 world; and (iii) incumbent exchanges become less relevant as new entrants capture market share and develop regional or global platforms. Several intra-national exchange mergers have occurred including: (i) Micex and RTS (Russia); (ii) US exchanges (CME, CBOT and NYMEX; Nasdaq and Philadelphia Exchange; NYSE and American Stock Exchange); and (iii) European exchanges (eg. Euronext; NOREX). Some international mergers have occurred: (i) Nasdaq OMX (Stockholm); and (ii) NYSE Euronext (Frankfurt, Paris, Brussels exchanges). However, international consolidation has mostly been resisted including: o ASX’s proposed merger with NZX in 2001 was rejected by NZX. o Deustche Borse and NYSE Euronext proposed’s Feb 2012 merger was blocked by the European Commission on fears it would create a monopoly in derivatives and clearing. o SGX and ASX was blocked on fears of systemic risk in the event of a financial crisis. o London Stock Exchange (LSE)’s proposed merger in 2011 with Canada’s TMX Group was abandoned after a negative domestic reaction. o LSE rejected bids by Deutsche Borse in 1999 and 2000 and then Nasdaq in 2006 and 2007. o Nasdaq OMX and Intercontintental Exchange’s hostile bid in 2011 for NYSE Euronext was stopped by the US Justice Department.
  • 23. 23 5. KEY RISKS Regulatory Risk Best execution ASIC has introduced new Market Integrity Rules which require brokers to deliver “best execution” for their clients. Given Chi-X's main selling point is its cheaper pricing, for retail orders “best execution” may mean retail brokers would be compelled to join Chi-X. However, ASIC recently announced (i) a delay to introduction of mandatory “best execution” from 1 October 2012 to 1 March 2013; and (ii) brokers may avoid alternative trading platforms altogether if it would not provide a better result for clients. The risks of mandatory “best execution” to ASX are mitigated by the fact that ASX’s cash equities trading business only contributed 6.2% of 1H12 revenues. OTC Derivatives clearing Global regulatory change, such as the US’s Dodd-Frank Act and Europe’s market infrastructure regulation, is driving over-the-counter (OTC) derivatives onto electronic platforms that will have to be cleared by central counterparties. Central clearing of OTC derivatives is an upside risk for ASX, particularly considering the CFR’s recommendation of mandatory onshore infrastructure raises barriers to entry . Cyclical risks A 10% increase in the total listed equity market cap translates to ~ 9.1% FY13F EPS increase for ASX (and vice versa). Key drivers are futures & options, daily cash equities, CHESS statements and terminals. Table 5. Competition We have included the arrival of competition in derivatives, settlements and clearing into our base case valuation, even though there is no current competitor in these segments.
  • 24. 24 FINANCIAL SUMMARY ASX ASX As at: 12/04/2012 Recommendation: Positive Share Price $31.33 Year end June 2011A 2012E 2013E 2014E INCOME STATEMENT Sales Revenue $m 618 634 708 733 Consolidated EBITDA $m 482 488 550 570 D&A $m (23) (28) (36) (44) Consolidated EBIT $m 459 460 515 525 Net Interest $m 38 44 44 44 Tax Expense $m 150 152 168 171 Associates/Minorities $m 0 0 0 0 Adj NPAT $m 357 362 401 409 NRIs $m (4) 0 0 0 Reported NPAT $m 352 362 401 409 Shares on Issue (end period) m 175 175 175 175 EFPOWA m 175 175 175 175 EPS ¢ 204.0 206.4 228.9 233.3 DPS ¢ 183.2 185.7 205.9 209.8 Franking % 100% 100% 100% 100% GROWTH/PROFITABILITY RATIOS Sales Growth % 5.0% 2.7% 11.6% 3.6% EBITDA Growth % 6.2% 1.2% 12.8% 3.5% EBIT Growth % 5.4% 0.2% 11.9% 2.1% EPS Growth % 5.7% 1.2% 10.9% 1.9% EBITDA/Sales % 78.1% 76.9% 77.8% 77.7% EBIT/Sales % 74.3% 72.5% 72.7% 71.6% EBIT Interest Cover x (12.2) (10.5) (11.7) (11.9) Tax Rate % 29.6% 29.6% 29.5% 29.5% ROE % 12.0% 12.0% 13.2% 13.3% ROFE % 28.2% 34.7% 38.2% 37.9% CASH FLOW EBITDA $m 482 488 550 570 Change in Working Capital $m 12 (12) 0 0 Other $m (17) 0 0 0 Gross Operating Cash Flow $m 477 475 550 570 Net Interest Paid $m 36 45 44 44 Tax Paid $m (142) (152) (168) (171) Net Operating Cash Flow $m 371 368 427 443 Maintenance Capex $m Free Cash Flow $m 371 368 427 443 Dividends Paid $m (304) (325) (361) (361) Expansionary Capex $m (47) (54) (69) (86) Acquisitions $m Asset Sales $m 0 0 0 0 Dividends Received $m 10 10 10 10 Shares Issues/Buybacks $m 45 0 0 0 Other $m (474) 0 0 0 Increase in Net Cash/(Debt) $m (398) (1) 7 7 GOCF/EBITDA % 99% 97% 100% 100% Total Capex/Sales % 7.6% 8.5% 9.7% 11.7% Total Capex/Depreciation x 2.0 1.9 1.9 1.9 Year end June 2011A 2012E 2013E 2014E VALUATION METRICS PER x 15.4 15.2 13.7 13.4 P/EG (2YR) x 1.3 1.2 Dividend Yield % 5.8% 5.9% 6.6% 6.7% EV/EBITDA x 7.9 7.8 6.9 6.7 EV/EBIT x 8.3 8.3 7.4 7.2 P/FCF x 14.8 14.9 12.9 12.4 P/BV x 1.8 1.8 1.8 1.8 BALANCE SHEET Assets Cash $m 1,952 1,937 1,944 1,944 Working Capital $m 267 133 133 133 PP&E $m 57 81 114 156 Intangibles $m 2,318 2,316 2,316 2,316 Investments $m 1,581 2,073 2,073 2,073 Other $m 8 10 10 10 Total Assets $m 6,182 6,550 6,590 6,631 Liabilities Debt $m 250 250 250 250 Working Capital $m 258 104 104 104 Other $m 2,532 3,096 3,096 3,096 Total Liabilities $m 3,161 3,532 3,532 3,532 Equity $m 3,021 3,018 3,058 3,099 Capital Employed $m 1,319 1,332 1,365 1,406 Net Debt/(Cash) $m (1,702) (1,687) (1,694) (1,694) Net Debt/Equity % (56.3%) (55.9%) (55.4%) (54.6%) Net Debt/Debt+Equity % (129)% (127)% (124)% (120)% Net Debt/EBITDA x (3.5) (3.5) (3.1) (3.0) Working Capital/Sales % 1.4% 4.6% 4.1% 4.0% D&A/PP&E % 40.8% 34.4% 31.1% 28.5% DCF VALUATION $m $/share Risk Free Rate 5.5% Equity Value 5,504 $31.42 Market Risk Premium 5.5% (Net Debt)/Cash 552 $3.15 Beta 1.00 Franking Credits $ WACC 11.0% DCF Valuation $34.58 Listings & Issuer Services $m 150 140 167 179 Cash Market $m 134 131 134 116 Derivatives $m 172 194 213 227 Information Services $m 71 71 86 95 Technical Services $m 40 47 52 57 Group Revenue $m 618 634 708 733 DIVISIONAL SUMMARY 69% 71% 73% 75% 77% 79% 81% 2010 2011 2012 2013 2014 Margin Trends EBITDA/Sales EBIT/Sales -16 -15 -14 -13 -12 -11 -10 -135% -120% -105% -90% -75% -60% -45% 2010 2011 2012 2013 2014 Gearing & Interest Cover Net Debt/Net Debt+Equity (%) EBIT Interest Cover (x) 4% 10% 16% 22% 28% 34% 40% 2010 2011 2012 2013 2014 Return Trends ROE ROA ROFE - Reported
  • 25. 25 RESEARCH RECOMMENDATION DEFINITIONS Positive Stock is expected to outperform the S&P/ASX 200 over the coming 24 months Neutral Stock expected to perform in line with the S&P/ASX 200 over the coming 24 months Negative Stock is expected to underperform the S&P/ASX 200 over the coming 24 months Speculative Stock has limited history from which to derive a fundamental investment view or its prospects are highly dependent on event risk, eg. Successful exploration, scientific breakthrough, high commodity prices, regulatory change, etc. Suspended Stock is temporarily suspended due to compliance with applicable regulatory and/or Evans & Partners policies in circumstances where Evans & Partners is acting in an advisory capacity. Not Rated Stock is not included in our investment research universe. Research Criteria Definitions Recommendations are primarily determined with reference to how a stock ranks relative to the S&P/ASX 200 on the following criteria: Valuation Rolling 12 month prospective multiples (composite of Price-to-Earnings Ratio, Dividend Yield and EV/EBITDA), or long-term NPV for resource stocks. Earnings Outlook Forecast 2 year EPS growth. Earnings Momentum Percentage change in the current consensus EPS estimate for the stock (rolling 1 year forward basis) over the consensus EPS estimate for the stock 3 months ago. Shareholder Returns Composite of forecast ROE (rolling 1 year forward basis) and the percentage change in ROE over 2 years. Debt Servicing Capacity Rolling 12 month EBIT Interest Cover ratio. Cyclical Risk Qualitative assessment of the 2 year outlook for a stock/industry’s profit cycle. Industry Quality Qualitative assessment of an industry’s growth/returns potential and company specific management capability. Financial Transparency If we don’t understand it, we won’t recommend it. For stocks where Evans & Partners does not generate its own forecasts, Bloomberg consensus data is used. Analysts can introduce other factors when determining their recommendation, with any material factors stated in the written research where appropriate.
  • 26. 26 GENERAL RESEARCH DISCLAIMER, WARNING & DISCLOSURES This document is provided by Evans and Partners ABN 85 125 338 785, holder of AFSL 318075. The information is general advice only and does not take into consideration an investor’s objectives, financial situation or needs. Before acting on the advice, investors should consider the appropriateness of the advice, having regard to the investor’s objectives, financial situation and needs. If the advice relates to a financial product that is the subject of a Product Disclosure Statement (e.g. unlisted managed funds) investors should obtain the PDS and consider it before making any decision about whether to acquire the product. The material contained in this document is for information purposes only and does not constitute an offer, solicitation or recommendation with respect to the purchase or sale of securities. It should not be regarded by recipients as a substitute for the exercise of their own judgment. Investors should be aware that past performance is not an infallible indicator of future performance and future returns are not guaranteed. Any opinions and/or recommendations expressed in this material are subject to change without notice and Evans and Partners is not under any obligation to update or keep current the information contained herein. References made to third parties are based on information believed to be reliable but are not guaranteed as being accurate. This document is provided to the recipient only and is not to be distributed to third parties without the prior consent of Evans and Partners. EVANS AND PARTNERS DISCLOSURE OF INTERESTS Evans and Partners and its respective officers and associates may have an interest in the securities or derivatives of any entities referred to in this material. Evans and Partners does, and seeks to do, business with companies that are the subject of its research reports. EVANS AND PARTNERS CORPORATE RELATIONSHIP DISCLOSURE AFI: Evans and Partners have arranged, managed or co-managed a public offering of the company or its affiliates in the past 12 months. AYUHA: Evans and Partners have arranged, managed or co-managed a public offering of the company or its affiliates in the past 12 months. BHP: A director of Evans and Partners Pty Ltd Advisory Board is a director of BHP Billiton Ltd. BSL: A director of Evans and Partners Pty Ltd Advisory Board is a director of BlueScope Steel Ltd. BOQ, BOQPA, BOQPC: A director of Evans and Partners Pty Ltd Advisory Board is a director of Bank of Queensland. CBA: Evans and Partners managed or co-managed a public offering of securities of the company or its affiliates in the past 12 months. CBAHA: Evans and Partners managed or co-managed a public offering of securities of the company or its affiliates in the past 12 months. CNGHA: Evans and Partners managed or co-managed a public offering of securities of the company or its affiliates in the past 12 months. HHY: Evans and Partners has been appointed by the Issuer as Broker to an on-market buy-back. Accordingly, Evans and Partners is unable to give Sellers advice in respect to a sale of this security. LLC: A director of Evans and Partners Pty Ltd Advisory Board is a director of Lend Lease Corporation Ltd. MEF: Evans and Partners has been appointed by the Issuer as Broker to an on-market buy-back. Accordingly, Evans and Partners is unable to give Sellers advice in respect to a sale of this security. MQG: MQCPA: A director of Evans and Partners Pty Ltd Advisory Board is a director of Macquarie Group Ltd. ORG: A director of Evans and Partners Pty Ltd Advisory Board is a director of Origin Energy Ltd. PPC: Evans and Partners managed or co-managed a public offering of securities of the company or its affiliates in the past 12 months. OOH: Evans and Partners have arranged, managed or co-managed a public offering of the company or its affiliates in the past 12 months. SAR: Evans and Partners managed or co-managed a public offering of securities of the company or its affiliates in the past 12 months. SPT: Evans and Partners acted in an advisory capacity for the bidder in relation to the proposed offer made to Spotless Group as announced 9 May 2011. TOX: Evans and Partners managed or co-managed a public offering of securities of the company or its affiliates in the past 12 months. RESEARCH ANALYST CERTIFICATION I, George Gabriel, CFA, hereby certify that all the views expressed in this report accurately reflect my personal views about the subject investment theme &/or company securities. I also certify that no part of my compensation was, is, or will be, directly or indirectly, related to the specific recommendations or views expressed in this report. RESEARCH ANALYST DISCLOSURE OF INTEREST I, George Gabriel, CFA, &/or entities in which I have a pecuniary interest, have an exposure to the following securities &/or managed products: TGA. DISCLAIMER Except for any liability which cannot be excluded, Evans & Partners, its directors, employees & agents accept no liability or responsibility whatsoever for any loss or damage of any kind, direct or indirect, arising out of the use of all or any part of this material. All information is correct at the time of publication; additional information may be available upon request.