SlideShare a Scribd company logo
1 of 36
Download to read offline
Stock Focus
Computershare (CPU)
1
CPU INITIATION: WELL-PRICED HIGH QUALITY BUSINESS FRANCHISE
WITH FREE GROWTH OPTIONS
.
$6.03
$7.64 $10.90
$12.52
Positive Neutral Negative
Share Price
RECOMMENDATION : POSITIVE
We initiate coverage with a Positive recommendation
and blended valuation of A$9.16 per share (DCF $9.27).
CPU’s risk/reward balance is very attractive, with
multiple free upside drivers but limited downside.
HIGH QUALITY BUSINESS FRANCHISE
• Strong balance sheet, with low gearing.
• Value-adding acquisition track record, with a 28.4% EPS CAGR since
2001.
• Scalable business model (high operational leverage) with low capex
and working capital requirements.
• High earnings to cash conversion ratio.
WELL-PRICED
• Downside stress tests indicate the current market price discounts an
overly pessimistic outlook. Refer MIGR analysis.
• Base case DCF valuation is $9.27 per share, 24.0% upside.
• Traditionally at a market premium, CPU now trades at the market
FY12 PER of 13.5x given the cyclical slowdown.
POISED FOR A CYCLICAL RECOVERY
• The US yield curve and US corporate balance sheet strength signal
potential for a cyclical recovery in corporate actions.
• The final remaining catalyst for a sustained recovery is equity
market stability (VIX index).
• We analyse yield curve, balance sheets and VIX and their historical
impact on corporate action volumes.
FREE GROWTH OPTIONS
The share price attributes zero value for the following growth options:
• 16% EPS upside in year 3 from proposed BNY Mellon acquisition.
• Cyclical recovery in corporate action volumes.
• AUDUSD decline - a key driver given 32% FY11 USD earnings.
• Interest rate increases which increase returns on cash held.
Trading Data
Last Price $7.48
12 month range $6.85 - $11.19
Market Cap $4,156m
Free Float $3,560m (86%)
Avg. Daily Volume 2.4m
Avg. Daily Value $22.6m
12 month return (historical) (19.5)%
Return on Invested Capital comfortably
exceeds CPU’s cost of capital.
We believe there is upside margin risk
given margins will expand with both
operational leverage and rising interest
rates.
Earnings Forecasts
Yr to June 09A 10A 11A 12E 13E 14E
EBITDA (US$m) 477.7 510.9 493.6 484.6 480.7 482.1
Rep NPAT (US$m) 255.7 294.8 264.1 283.1 286.8 293.9
Adj NPAT (US$m) 255.7 294.8 264.1 283.1 286.8 293.9
EPS (¢) 52.1 57.8 55.7 55.9 56.5 57.8
EPS Gth (%) N/A 10.9 (3.7) 0.4 1.2 2.3
PER (x) 14.6 13.2 13.7 13.6 13.5 13.2
PEG Ratio (x) 2.1 (4.0) 8.7 3.9
DPS (A¢) 22.0 28.0 28.0 28.0 31.0 34.0
Yield (%) 2.9 3.7 3.7 3.7 4.1 4.5
Franking (%) 45% 60% 60% 60% 60% 60%
ROE (%) 33% 29% 22% 21% 19% 18%
EV/EBITDA (x) 10.5 9.7 9.9 9.7 9.5 9.1
Net Debt/EBITDA (x) 1.7 1.4 1.3 1.0 0.7 0.3
Int. Cover (x) 12.0 19.2 12.6 12.8 17.4 26.6
Valuation (DCF) A$9.27
George Gabriel, CFA
ggabriel@evansandpartners.com.au
October 14, 2011
+61 3 9631 9853
2
1. KEY INVESTMENT CONSIDERATIONS
2. COMPANY OVERVIEW
• Background
• Revenue mix by geography
• Revenue mix by segment
3. KEY VALUE DRIVERS AND SENSITIVITIES
• Global corporate actions cycle – VIX, yield curve, balance sheet strength
• Global short term interest rates and cash balance
• Exchange rates
4. EARNINGS AND VALUATION SCENARIO ANALYSIS
• Blended valuation
• Base case
• Key driver sensitivity analysis
• Market implied growth rate (MIGR) analysis
5. HISTORICAL MARKET MULTIPLES
• Historical share price performance
• VIX and share price correlation
• PE, PEG and PE relative ratios
• EV/EBITDA
6. BNY MELLON ACQUISITION OVERVIEW
• Acquisition track record
• BNY Mellon acquisition overview
• Funding
• Regulatory overview
• What’s in the share price?
• Consensus EPS revisions
7. KEY FINANCIAL TRENDS
• Earnings per share (EPS)
• Dividends per share (DPS)
• Capital allocation
• Return on invested capital (ROIC)
• Du Pont analysis
• FY11 result overview
8. BALANCE SHEET AND CASHFLOW
• Cashflow generation
• Financial leverage
• Interest cover
• Asset efficiency
9. BOARD & MANAGEMENT
• Overview
• Register
10. KEY RISKS AND CATALYSTS
3
1. KEY INVESTMENT CONSIDERATIONS
CPU is a well-priced quality business franchise with multiple free growth options.
Well-priced
• Our analysis of share price implied growth (market implied growth rate analysis)
concludes that the market has discounted an overly pessimistic scenario of declining
cash margin balances, declining sales volumes, and declining EBITDA margins. Our
downside stress test results in a $7.64 discounted cash flow (DCF) valuation. Table 10.
• Our base case DCF valuation is $9.27 per share, 24% upside to the current share price.
Table 5.
• Traditionally valued at a premium to the market, CPU now trades at the market PE
multiple of 13.5x. Charts 11-13.
Quality business franchise
• High ROIC of over 12% comfortably exceeds CPU’s weighted average cost of capital.
Chart 22.
• Strong balance sheet, with low gearing (internal limit of 3x net debt/EBITDA) and high
interest cover (12x EBIT/interest). Chart 28-29.
• Value-adding acquisition track record, with a 28.4% CAGR in EPS since 2001. Chart 18.
• Scalable business model (high operational leverage) with low capex and working capital
requirements. Charts 30-31.
• High cash conversion ratio, from 85-100%. Chart 27.
Key value drivers
The current share price is not factoring in earnings upside from recovery of the 3 value
earnings drivers: (i) global corporate actions cycle; (ii) global short-term interest rates and
the cash margin balance; and (iii) exchange rates. For this reason, we believe the current
share price offers “free” growth options. Another key value driver is the proposed BNY
Mellon acquisition.
4
Free growth option no. 1: BNY Mellon acquisition
• CPU launched a friendly take-over bid for BNY Mellon on 28 April 2011. Since then, the
US anti-trust authority the Department of Justice (DoJ) has been reviewing the
acquisition.
• BNY Mellon has identified merger synergies of US$70m % by Year 3 which appear
achievable given: (i) synergies are mostly cost-out; and (ii) CPU’s strong merger
integration track record.
• US$70m of merger synergies (USD$2.5 post-tax) increases CPU’s EPS by
approx 16.3% in Year 3.
• The current share price offers a free option over the BNY Mellon acquisition.
• We have not included the BNY Mellon transaction in our base case.
• We have zero doubt that the equity market has not priced in any upside from the BNY
Mellon acquisition because:
o (i) Our downside stress test (MIGR analysis) results in a $7.64 share price
(approx. the current share price), and attributes zero to BNY Mellon.
o (ii) Equity analyst EPS revisions indicate initial upgrades post CPU’s bid for BNY
have been unwound. Chart 17.
o (iii) CPU’s share price has underperformed the market since the bid
announcement. Charts 15-16.
Free growth option no. 2: Cyclical recovery in corporate actions
• There are three key leading indicators of a cyclical recovery in the global corporate
actions cycle:
o (i) US yield curve;
o (ii) US corporate balance sheets; and
o (iii) VIX index (proxy for equity market volatility).
• Historically, a positive yield curve indicates that the M&A cycle is in its early stages. The
yield curve is currently positive. Chart 5.
• US corporate balance sheets are strong, with gearing at record low levels last seen in
1996. From 1996, M&A volumes increased to the cyclical peak of Jan 2000. Chart 6.
• Currently, the absent condition for M&A cyclical recovery is equity market stability.
History indicates that the VIX needs to stabilise before corporate action volumes
commence a sustained cyclical upswing. Chart 4. Table 2.
• A 1% increase in revenue growth in all segments in FY12F results in an
increase in FY12EPS of 2.0% (from 55.4cps to 56.5cps).
5
Free growth option no. 3: AUD decline relative to USD
• Valuation sensitivity to the AUDUSD is high. Every 1 cent increase in the AUDUSD
(ie. AUD appreciates) decreases CPU’s valuation by 1.2% (and vice versa).
Table 9.
• 32% of earnings are USD denominated (Table 1) and 30% of the non-hedged cash
margin balance is USD1.3bn (Chart 9).
• If we assume that the AUDUSD moves to 80cps in FY15 (base case: 85 cents) and
77cps in perpetuity (base case: 85 cents), then CPU’s DCF valuation increases to
$10.03.
• Our base case assumes the AUDUSD declines to $0.85 by 2015F. Table 8. Many equity
analysts have discounted AUDUSD of $1 parity in their model. Accordingly, there is
upside if equity analysts’ valuation models downgrade AUDUSD forecasts.
Free growth option no. 4: Rising interest rates and impact on cash balance
• CPU’s sensitivity to short-term interest rates is via its “margin balances” ie. the cash it
holds on behalf of corporate clients before dividend (or other capital) distributions.
• Sensitivity to rising interest rates is not very high. Although the cash margin balance is
USD10.2bn, only USD4.3bn is not hedged. Of this USD4.3bn, not all is invested in
short-term money markets, so it takes time for longer-dated fixed income investments
to roll off and the impact of higher short-term interest rates to flow through to the all of
the unhedged USD4.3bn cash management portfolio. Table 7.
• Every 10 basis points increase in cash margin balance yield increases earnings
by approx. US$4.3m, up 1.6% on a base FY11 net profit of US$264.1m.
6
2. COMPANY OVERVIEW
Background
• Computershare (CPU) is a leading global provider of investor services to funds and
listed companies. It manages share registers, employee equity plans, stakeholder
communications, proxy solicitation and transfer agency.
• Over the last decade, CPU has geographically diversified from its original Australian
share registry business to a globally diversified business model.
• CPU has strong market positions in Australia, United Kingdom (UK), New Zealand (NZ),
Hong Kong (HK), Russia, Ireland, South Africa, India, Canada and the transfer agent
space in the USA.
Revenue mix by geography
CPU discloses total segment revenue, EBITDA and total assets for its 6 operating segments
and the Tech Services cost centre. Geographic revenue mix (by declining contribution) is:
(i) United States of America (32.4% of FY11 revenue).
(ii) Australia and New Zealand (22.6% of FY11 revenue).
(iii) United Kingdom, Channel Islands, Ireland and Africa (UCIA) (18.8% of
FY11 revenue).
(iv) Canada (12.7% FY11 revenue).
(v) Asia comprising India, Hong Kong, China, Singapore and Japan (7.8% FY11
revenue).
(vi) Continental Europe comprising Germany, Russia and other European countries
(5.7% FY11 revenue).
(vii) Technology Services is a research and development function providing
software specialising in share registry, employee plans and financial services.
TABLE 1: REVENUE BY SEGMENT AND GEOGRPAHY
US$m
Aust &
NZ
Asia UCIA
Cont
Europe
USA Canada Total
Business
mix
Register Maintenance 145.6 51.4 104.7 49.8 262.2 84.8 698.5 43%
Corporate Actions 47.5 34.7 22.7 4.0 45.6 25.1 179.6 11%
Business Services 3.4 30.8 66.8 1.9 91.2 71.9 266.0 16%
Stakeholder R/ship Mgt 6.1 3.7 11.0 12.6 60.5 3.1 97.0 6%
Employee Share Plans 19.3 4.3 85.9 1.2 31.4 15.6 157.7 10%
Communication Services 131.4 0.0 4.3 17.6 15.5 3.5 172.3 11%
Tech & other 12.0 0.8 8.6 5.3 18.3 2.3 47.3 3%
Totals 365.3 125.7 304.0 92.4 524.7 206.3 1618.4 100%
Geographic mix 23% 8% 19% 6% 32% 13% 100%
Source: CPU Reports
7
CHART 1: GEOGRAPHIC REVENUE MIX CHART 2: SEGMENTAL REVENUE MIX
US$m US$m
Aust &
NZ,
$365.3 ,
23%
Asia,
$125.7 ,
8%
UCIA,
$304.0 ,
19%Cont
Europe,
$92.4 ,
6%
USA,
$524.7 ,
32%
Canada,
$206.3 ,
13%
Reg.
Maint,
$698.5,
43%
Corp.
Actions,
$179.6,
11%
Bus.
Services,
$266.0,
16%
Stake
holder
R/ship,
$97.0,
6%
Employee
Share
Plans,
$157.7,
10%
Comm.
Services,
$172.3,
11%
Tech &
other,
$47.3,
3%
Source: CPU Reports
Revenue mix by segment
CPU defines its core competencies as record keeping, communication and transfer agency. In
each of its 6 geographic segments, CPU offers the following core products:
• Investor Services – comprising
o (i) Register Maintenance (43.2% of FY11 revenue); and
o (ii) Corporate Actions (11.1% of FY11 revenue) including company meeting
logistics, payments and full contact centre and online services.
• (iii) Business Services (16.4% of FY11 revenue) comprise the provision of voucher
administration, bankruptcy administration services, interactive meeting services,
corporate trust services and other ancillary services. Refer “Base Case” section below
for more details.
• Plan Services – comprise the administration and management of:
o (iv) Communication Services (10.6% FY11 revenue), which provide laser
imaging, intelligent mailing, scanning and electronic communications delivery.
o (v) Employee Share and Option Plans (9.7% FY11 revenue).
• (vi) Stakeholder Relationship Management Services (6.0% of FY11 revenue)
comprise the provision of investor analysis, investor communication and management
information services to companies, shareholders and other capital markets participants.
Business segment revenues comprise 3 categories:
• Annuity-type revenues comprising 63.5% of FY11 revenue (Register Maintenance,
Employee Share and Option Plans and Communication Services).
• Transactional revenues comprising 17.1% of revenue (Corporate Actions and
Stakeholder Relationship Management).
• General Business Services comprising 16.4% of revenue.
8
CHART 3: FY11 REVENUE BY SEGMENT AND GEOGRPAHY
9
3. KEY VALUE DRIVERS AND SENSITIVITIES
CPU’s three key value drivers are:
(i) Global corporate actions cycle;
(ii) Global short-term interest rates and the cash margin balance; and
(iii) Exchange rates.
Global corporate actions cycle
Corporate actions include mergers and acquisitions, IPOs and capital management activity
(eg. buybacks, secondary raisings etc.). Corporate actions are driven by a range of
macroeconomic variables. We analyse below the following 3 drivers of corporate actions: (i)
equity market volatility; (ii) US yield curve; and (iii) US corporate balance sheet strength.
We conclude that the US yield curve and US corporate balance sheet strength signal
potential for a sustained cyclical upswing in corporate M&A volumes –equity market
stability (as measured by VIX) remains a key precondition for corporate action
recovery.
Key points are:
• The current positive US yield curve satisfies one key precondition for a cyclical recovery
in M&A volumes.
• US non-financial corporate debt to net cash flow is less than 4x, an indicator of financial
flexibility to fund acquisitions.
• However, VIX needs to sustainably decline below 30% for M&A activity to increase.
Equity market volatility (VIX)
At the time of writing, VIX is >35%.
The VIX is a proxy measure of equity market volatility. (Technically, it measures the implied
volatility of S&P 500 index options. VIX is quoted in percentage points and translates to the
expected annualised movement in the S&P 500 index over the next 30-day period).
We have analysed the historical relationship between VIX and M&A volumes. Chart 4. Table 2.
• Rising VIX off a low base tends not to have a material impact on M&A activity until the
VIX nears 30%. Point 1, 8.
• Where VIX > 30%, M&A subsequently declines materially. Points 1,3,5,7,9,11.
• M&A recovers quickly after VIX falls below 30% from a peak. Points 1-2, 3-4, 11-12.
• Longer periods of high volatility (>30% VIX) results in prolonged periods of M&A
weakness. Points 5-7 & 9-12.
• Extended periods of stability and/or falling VIX provide the conditions for a material
cyclical upswing in M&A activity. Point 7-8.
10
CHART 4: GLOBAL M&A vs VIX
TABLE 2: GLOBAL M&A vs VIX
Point Date VIX Movement^ VIX change
Months for
recovery (1)
Global M&A
Activity*
1-2 Nov 1997 – Mar 1998 Peak 31.9% - Trough 20.3% -11.6% 1 month +40%
3-4 Sep 1998 – Aug 2000 Peak 38.5% - Trough 18.0% -20.5% 1 month +67%
5-6 Sep 2001 – Mar 2002 Peak 35.5% - Trough 18.9% -16.6% >1 yr - 40%
7-8 Sep 2002 – Oct 2006 Peak 37.4% - Trough 11.3% -26.1% 1 month +408%
8-9 Oct 2006 - Nov 2008 Trough 11.3% - Peak 63.4% +52.1% -44%
9-10 Nov 2008 – Apr 2010 Peak 63.4% - Trough 17.6% -45.8% >1 yr -37%
11-12 May 2010 – Jan 2011 Peak 32.7% - Trough 17.3% -15.4% 1 month +55%
Source: Datastream, E&P estimates
Notes:
^measured as month average
*measured as the average of M&A activity for the 5 month period around the final data point (2 mths before, 2 mths after)
(1) Months for recovery: we observe how many months after VIX rebases to the downside before M&A volumes improve.
US yield curve
The slope of the US yield curve (10 year government bond yield less 90 day bank bill rate) is
an indicator of cyclical economic peaks (when positively sloped) or downturns (when
negatively sloped or flat). Chart 5 illustrates that:
• A negative (inverted) yield curve indicates the peak of the M&A cycle.
• A positive yield curve indicates the M&A cycle is in its early stages. But once the short
end of the yield curve increases and the yield curve flattens, the rising cost of debt
drives s a slowdown in M&A volumes.
The current positive yield is a key precondition to recovery in global corporate action volumes.
11
CHART 5: GLOBAL M&A vs SLOPE OF THE US YIELD CURVE
-1.0
0.0
1.0
2.0
3.0
4.00
100
200
300
400
500
600
Jan-96 Jan-98 Jan-00 Jan-02 Jan-04 Jan-06 Jan-08 Jan-10
Global M&A announced ($bn) (LHS) Inverted Slope of US Yield curve (%)* (RHS)
Source: Datastream
*Slope of US Yield curve = 10 Yr Yieldless 90 day bill rate
US corporate balance sheet strength
Currently, US corporate balance sheet strength is as strong as it has been for the last 20
years. Non-financial corporate debt to net cash flow is less than 4x, implying financial
flexibility to fund acquisitions.
CHART 6: US NON-FINANCIAL CORPORATE DEBT TO NET CASH FLOW
3.5x
4.0x
4.5x
5.0x
5.5x
6.0x
1990 1992 1994 1996 1998 2000 2002 2004 2006 2008 2010
Source : US Commerce Dept
12
Global short-term interest rates and cash margin balance
CPU typically retains the interest generated on cash deposits held in trust for corporate clients
prior to distribution to corporates’ shareholders (for dividends, takeovers etc). This cash
“margin balance” is currently US$10.2bn. The yield on this margin balance has declined as
global short term interest rates have declined. Chart 7.
We analyse this further in “Key driver sensitivity analysis” below.
CHART 7: FUND BALANCE & MARGIN INCOME
0.0%
0.5%
1.0%
1.5%
2.0%
2.5%
3.0%
0.0
2.0
4.0
6.0
8.0
10.0
12.0
1H06 2H06 1H07 2H07 1H08 2H08 1H09 2H09 1H10 2H10 1H11 2H11
Fund Balance (LHS) Margin Yield (RHS)
US$bn
Source:CPU Reports
Exchange rates
CPU does not employ any currency hedging. Table 1 details revenue mix by currency and
business segment. Table 3 below summarises the exchange rate exposures. AUDUSD is the
largest exposure by revenue contribution (32.4% FY11 total revenue).
We analyse exchange rates in further detail in “Key driver sensitivity analysis” below.
TABLE 3: REVENUE MIX BY REGION
Currency
% FY11 total
revenue
FY11
revenue
(US$m)
USA 32.4% 519.8
Australia and New Zealand 22.6% 362.6
United Kingdom, Channel Islands,
Ireland and Africa (UCIA)
18.8% 301.6
Canada 12.7% 203.7
Asia 7.8% 125.1
Continental Europe 5.7% 91.4
Total 100.0% 1604.2
Source: CPU reports
13
4. EARNINGS AND VALUATION SCENARIO ANALYSIS
Blended valuation
Our blended valuation is $9.16 per share. Table 4.
TABLE 4: BLENDED VALUATION
Base case
Our discounted cash flow (DCF) valuation base case valuation is A$9.27 per share. Our
assumptions are summarised in Tables 6 and 7. Our DCF model is structured as follows:
• Modelled explicitly by geographic region because CPU only discloses EBITDA by region.
• Within each region, we model revenue by business segment within each country.
• EBITDA for each country is estimated using the region margin. We assume FY11F
EBITDA margin for all business segments is carried forward.
Our key base case assumptions are:
• No inclusion of BNY Mellon in any way.
• Exchange rates.
o We convert all currencies to US$ based on EAP house forecasts and/or rates
implied by currency futures markets. Table 6.
• Interest rates. Table 6.
o Forecasts are based on futures market expectations.
• Revenue growth rate. Tables 4, 6.
o Determining an appropriate cross-cycle rate of revenue growth is challenging
because revenue growth has historically been driven by acquisitions. We believe
reasonable organic revenue growth benchmarks are the 1.8% in 2002 and 2.1%
in 2003, when acquisition rates were much lower. Accordingly, our long-term
organic revenue growth assumption is 2%. Table 6.
o We divide CPU’s segments into annuity-type or transactional revenues and apply
different growth rates for each.
o Annuity segments – 2% growth in perpetuity.
o Transactional segments – 1% growth in FY12F and FY13, then 2% growth in
perpetuity.
• EBITDA margin declines to 30.3% in FY12F and then recovers to 31.4% long-term
rate by FY16F. We believe there is upside margin risk given margins will expand with
both operational leverage and rising interest rates.
14
TABLE 5: REVENUE GROWTH
Date Revenue (US$m) Growth
2001 388.8
2002 395.9 1.8%
2003 404.1 2.1%
2004 619.2 53.2%
2005 795.7 28.5%
2006 1198.8 50.7%
2007 1404.2 17.1%
2008 1564 11.4%
2009 1495.8 -4.4%
2010 1599.6 6.9%
2011 1598.9 0.0%
Source: CPU Reports
TABLE 6: Base case valuation assumptions
TABLE 7: Base case sales growth assumptions
15
Our base case has been conservative in assuming that Business Services is transactional. In
reality, it encompasses a mixed range of businesses with different revenue characteristics:
• Computershare Voucher Services (CVS) – annuity type. CVS is the largest dedicated
childcare voucher provider in the UK for companies across sectors and industries. Each
month around 100,000 working parents request Childcare Vouchers through more than
12,000 organisations.
• Deposit Protection Service (DPS) management – annuity type. DPS manages trust
money on behalf of landlords and The Letting Protection Service.
• Funds Services– annuity type with markets cyclicality. This is a fully outsourced
managed funds administration service, including unit registry, investment
administration, fund accounting and regulatory reporting.
• IML – transactional. Established in the UK, IML manufactures the “Communicator” - a
sophisticated wireless keypad for audience participation and voting.
• Kurtzman Carson Consultants LLC (KCC) – transactional. KCC is a premier provider of
administrative support services for legal and finance professionals. KCC offers an
integrated suite of corporate restructuring, class action and legal document support
solutions based on industry expertise and proprietary technologies.
Key driver sensitivity analysis
Corporate actions volumes
CPU is leveraged to corporate action volume through the transactional style revenues of
Corporate Actions, Business Services and Stakeholder Relationship Management (33.5% of
FY11 revenue).
A 1% increase in revenue growth in all segments in FY12F only (relative to our base case in
Table 6) results in a DCF valuation of $9.38 (up 11cps).
A 1% increase in revenue growth in all segments in FY12F results in an increase in
FY12F EPS of 2.0% (from 55.4cps to 56.5cps).
Interest rates and cash margin balances
CPU’s sensitivity to interest rates is via its “margin balances” ie. the cash it holds on behalf of
corporate clients before dividend (or other capital) distributions.
The key sensitivity to interest rates is through the unhedged US$4.3bn (42%) of
CPU’s margin balance. Every 10 basis points increase in margin balance yield
translates to US$4.3m of additional earnings, up 1.6% on a base of FY11 net profit
of US$264.1m. We reach the same conclusion through our valuation model – by
increasing all margin balance interest rates by 10bp, the DCF valuation only
increases 1.8%. Table 9.
CPU’s average FY11 margin balance was US$10.2bn, on which it earnt US$171.5m, or 35% of
FY11 EBITDA of US$493.6m. Of the US$10.2bn average margin balance held at year end
FY11:
16
• 42% or US4.3bn is unhedged.
• 28% or US$2.8bn is naturally not exposed to interest rates either through not earning
margin income or receiving a fixed spread on these funds.
• 22% or US$2.2bn is hedged directly.
• 8% of US$0.9bn enjoys a natural hedge against CPU’s own floating rate debt. Table 8.
The global trend in short term interest rates and the overall yield on the margin balance have
been in decline since Jan 08. Charts 7-8. The margin balance yield peaked at 2.59% in FY07,
then fell to 1.68% in FY11. We forecast the yield will decline to 1.37% in FY12F and continue
its decline to 1.17% in FY14F as higher priced cash yields from earlier periods run-off and are
replaced with lower spot rates. We forecast the yield will eventually increase to 1.5% by
FY17F as interest rates increase over time.
CHART 8: 90 day bill rates
0.0
1.0
2.0
3.0
4.0
5.0
6.0
7.0
8.0
Jan-06 Jan-07 Jan-08 Jan-09 Jan-10 Jan-11
US UK Canada Australia
Source: Datastream
TABLE 8: INTEREST RATE EXPOSURE ON FUND BALANCE
Total client funds
% total US$bn equivalent US$bn
28% 2.8 No exposure to interest rates
2.8 Subtotal: no exposure to interest rates
22% 2.3 Effective hedging in place
8% 0.9 Naturally hedged against CPU's floating rate debt
42% 4.3 Non-hedged exposed funds
7.4 Subtotal: average exposed funds prior to hedging
101% 10.2 10.2 Total average client funds held in FY11
Source: p19 FY11 investor presentation
17
CHART 9: NON-HEDGED EXPOSED FUNDS
US$b,%
GBP,
$1.7,
40%
USD,
$1.3,
30%
Other,
$0.6,
14%
AUD,
$0.1,
2%
CAD,
$0.6,
14%
Source: CPU Reports
TABLE 9: INTEREST RATE SENSITIVITY
Source: E&P estimates
Exchange rates
CPU does not hedge currency exposures. Highest sensitivity is to AUDUSD cross-rate.
• 32.4% of FY11 revenue is USD denominated (ie. US$520M). Table 1.
• Table 10 shows that for every 1cps increase in the AUDUSD, CPU’s DCF
valuation decreases by 1.2% (and vice versa).
TABLE 10: CURRENCY SENSITIVITY
Cross Rate Sensitivity¹ DCF Valuation Impact
AUD/USD +/- 1c -1.2% / 1.2%
GBP/USD +/- 1p 0.1% / -0.1%
CAD/USD +/- 1c 0.2% / -0.2%
EUR/USD +/- 1c 0.0% / 0.0%
Source: E&P estimates. ¹Our sensitivity calculates the DCF valuation
impact when we add (subtract) 1c (or 1p) to our base case assumption
for the exchange rate in each financial year.
• Our base case assumes the AUDUSD declines to $0.85 by 2015F. Table 8. Many equity
analysts have discounted AUDUSD of $1 parity in their model. Accordingly, there is
upside if equity analysts’ valuation models downgrade AUDUSD forecasts.
18
• Assuming the AUDUSD moves to 80cps in FY15 and 77cps in perpetuity
thereafter (EAP house view, but not our base case), then CPU’s DCF valuation
rises to $10.03, highlighting the high sensitivity to the AUDUSD.
• GBP/USD: CPU’s third largest exposure, with ~15% of revenues (and 40% of margin
fund balance, or GBP1.7bn) coming from the UK.
• CAD/USD: ~13% of revenues are Canadian denominated.
• EURO/USD: Translation of earnings largely from Germany and Ireland have minimal
impact, accounting for ~4% of revenues.
Market implied growth rates (MIGR) analysis
Table 11 summarises the key assumptions which generate a $7.64 share price valuation. Our
MIGR analysis also assumes revenue growth in each segment of -2% in FY12F and -2% in
FY13F, followed by 1% growth in perpetuity.
MIGR analysis clearly indicates that the current share price is discounting an overly pessimistic
scenario, extrapolating forward for two years EBITDA margin decline, margin balance FUM
loss, no increase in interest rates and negative volume growth in FY12F and FY13F.
Given this analysis, we conclude that the current share price does not factor in any
of the 4 growth options listed at the start of this report.
TABLE 11: MARKET IMPLIED GROWTH RATE
19
5. HISTORICAL VALUATION MULTIPLES
Historical share price performance
CPU outperformed the market following the Global Financial Crisis, with clear outperformance
evident from the GFC bottom of Mar 09, driven partly by recapitalisations. However, as the
global equity outlook worsened, CPU has lost all of its relative outperformance to now trade in
line with the market.
CHART 9: HISTORICAL SHARE PRICE PERFORMANCE
4.00
5.00
6.00
7.00
8.00
9.00
10.00
11.00
12.00
13.00
14.00
Sep-08
Dec-08
Mar-09
Jun-09
Sep-09
Dec-09
Mar-10
Jun-10
Sep-10
Dec-10
Mar-11
Jun-11
Sep-11
CPU Share Price ASX200 Relative Performance
Source: IRESS
VIX and share price correlation
VIX is the Chicago Board Options Exchange Market Volatility Index, a popular measure of the
implied volatility of the S&P 500 index options. It represents one measure of the market’s
expectations of stock market volatility over the next 30 days. The VIX is quoted in percentage
points and translates approx. to the expected movement in the S&P 500 index over the next
30 days.
Historically, CPU’s share price has rallied in two circumstances:
• Stable VIX. VIX stability from April 2003 to June 07 allowed CPU to rally through this
period.
• Sharp VIX decline. As VIX declined from 70% in October 08 to 16% in April 2010,
CPU rallied sharply also. Chart 10.
20
CHART 10: CPU SHARE PRICE V VIX
-10%
0%
10%
20%
30%
40%
50%
60%
70%0
2
4
6
8
10
12
14
Sep-95 Sep-97 Sep-99 Sep-01 Sep-03 Sep-05 Sep-07 Sep-09
CPU Share Price (LHS) VIX Inverted (RHS)
Source: Bloomberg
PE, PEG and PE relative ratios
CPU traded at a large premium to the market during the dot-com period approaching May
2000, but has since traded broadly in line with market multiples. Charts 11-12.
CPU’s PEG ratio of 1.27x (12mth forward PE to average of two year EPS growth rate) is below
its five year average of 1.44x. The PEG ratio (consensus forecasts) is elevated by a flat FY12F
EPS outlook (FY12F 55.8cps vs 55.7cps), followed by growth to 63.9cps. Chart 13.
CHART 11: PE RELATIVE TO THE MARKET
0.0x
1.0x
2.0x
3.0x
4.0x
5.0x
May-97 May-99 May-01 May-03 May-05 May-07 May-09 May-11
Computerhare PER vs ASX 200 Non-Bank Industrials
Source: Bloomberg
21
CHART 12: PE SINCE JAN 02
5
10
15
20
25
30
35
Jan-02 Jan-03 Jan-04 Jan-05 Jan-06 Jan-07 Jan-08 Jan-09 Jan-10 Jan-11
CPU PER Average PER +/- 1 Standard Deviation
Source: Bloomberg
CHART 13: PEG RATIO
0.00
0.50
1.00
1.50
2.00
2.50
3.00
FY05 FY06 FY07 FY08 FY09 FY10 FY11 Current
Source: Bloomberg
12mth Forward PE Ratio/Average 2Yr EPS Growth
EV/EBITDA
EV/EBITDA multiple has de-rated to approx. 12-13x.
CHART 14: EV/EBITDA multiple
22
6. BNY MELLON ACQUISITION OVERVIEW
Acquisition track record
CPU has demonstrated a long track record of extracting value from its multiple acquisitions
over the last decade, evidenced in its positive ROIC and EPS trends .CPU’s track record is
driven by:
(i) Focus on cost reduction via systems integration without impacting revenues;
(ii) Requirements that acquisitions fit within core competencies; and
(iii) Limiting acquisition pricing to not more than 5x EV/EBITDA.
BNY Mellon acquisition overview
CPU announced a bid for BNY Mellon on 28 April 2011. The fundamentals of the acquisition are
attractive given:
• Stated synergy target of US$70m p.a. by year three. There is no break-down of the
synergies over each of the three years.
• EPS accretive (per management) from year one following the acquisition.
• In our view, there is a high probability of synergies being realised given CPU’s track
record and focus on cost-out out (technology, premises, shared service integration).
• US$70m of merger synergies (USD$2.5 post-tax) increases CPU’s EPS by
approx 16.3% in Year 3.
Funding
The BNY Mellon transaction will be funded with all cash from existing cash resources and new
credit lines. Key financial elements are:
• US$550m business value.
• CPU has US$347.2m cash as at 30 June 11, implying a debt requirement of
US$202.8m.
• FY11 EBITDA of US$493.6m.
• Total FY11 debt of US$1,013m, or 2.05x EBITDA.
• Total post-acquisition debt of 2.46x, which is within CPU’s total debt/EBITDA ceiling of
2.5x.
Regulatory overview
The US anti-trust body (Department of Justice) has been reviewing the acquisition to assess
whether it is anti-competitive. The DOJ has (i) requested further information from CPU; (ii)
already exceeded the usual time for merger decision-making, and (iii) given no guidance on
decision timing. We would expect an update from CPU at its AGM.
Key considerations which support the prospects of DOJ approval are:
• At the time of the announcement, CPU management was confident of merger approval
based on its clear legal advice.
23
• The DOJ assessed and ultimately approved the merger between BNY and Mellon.
Sullivan Cromwell lawyers advised BNY on that merger and is also advising CPU on the
BNY Mellon acquisition.
• US transaction agent business has had high price competition, with Wells Fargo winning
the transfer agent contracts of Hewlett Packard and Comcast (top 40 stocks by market
cap) in the last 12 months.
• American Stock Transfer has competed aggressively for recent IPOs, securing up to one
third of IPOs in the last year.
What’s in the share price?
Share price trading since the 28 April 2011 announcement of the bid for BNY Mellon indicates
that the market is not pricing in any benefit from the proposed BNY Mellon acquisition. Chart
15 shows a one day increase of 7.7%, which was thereafter progressively unwound. In fact,
Chart 16 shows that CPU has underperformed the market from 29 April 2011 onwards,
indicating that not only has the synergy benefit of BNY Mellon been unwound, but the market
is pricing in slower growth for CPU.
CHART 15: SHARE PRICE PERFORMANCE FROM 28 April
6.50
7.00
7.50
8.00
8.50
9.00
9.50
10.00
27-Apr
11-May
25-May
08-Jun
22-Jun
06-Jul
20-Jul
03-Aug
17-Aug
31-Aug
14-Sep
28-Sep
Pre BNY Mellon Announcement: 28th April
CPU Share Price ASX200 Relative Performance
Source: IRESS
CHART 16: SHARE PRICE FROM 29 April
6.50
7.00
7.50
8.00
8.50
9.00
9.50
10.00
27-Apr
11-May
25-May
08-Jun
22-Jun
06-Jul
20-Jul
03-Aug
17-Aug
31-Aug
14-Sep
28-Sep
Post BNY Mellon Announcement: 29th April
CPU Share Price ASX200 Relative Performance
Source: IRESS
24
Consensus EPS revision cycle
Consensus EPS revisions support our conclusion that synergies from the BNY Mellon
acquisition are not currently factored into the CPU share price.
Analysts upgraded CPU around the 29 April announcement of the CPU bid, but have since
progressively downgraded CPU to the point where its EPS forecasts are now below their level
prior to the BNY Mellon bid. Chart 17.
CHART 17: EPS REVISIONS
7. KEY FINANCIAL TRENDS
Earnings per share (EPS) trends
EPS has increased from US3.9 cents in FY01 to US47.5 cents in FY11, a CAGR of 28.4% p.a.
driven by both the tailwind of a positive equity cycle and also CPU’s success in acquiring and
integrating businesses.
EPS declined in FY09, driven by:
• A stronger AUD/USD.
• Lower interest rates. Charts 7-8.
• Lower volumes, evident in lower asset turnover (from 0.81x cyclical peak in FY07 to
0.6x in FY09 and a recent low of 0.54x in FY11). Chart 24.
• Lower leverage, from 2.91x peak in FY08 to 2.77x in FY09 and 2.36x in FY11.
• Lower NPAT profit margins, down from an FY08 peak of 18.0% to 16.5% in FY11.
25
CHART 18: EARNINGS PER SHARE TRENDS
-20%
0%
20%
40%
60%
80%
100%
120%
140%
-20.0
-10.0
0.0
10.0
20.0
30.0
40.0
50.0
60.0
FY01 FY02 FY03 FY04 FY05 FY06 FY07 FY08 FY09 FY10 FY11
EPS (US cents) (LHS) EPS Growth (RHS)
Source: CPUreports
Dividend per share (DPS) trends
DPS has increased from US1.0 cents in FY01 to US28.0 cents in FY11, a CAGR of 39.5% p.a.
The absolute value of dividend per share has not been cut once over the last 10 years,
although the payout ratio increased in FY03 to maintain this trend as earnings declined.
CHART 19: DIVIDEND PER SHARE TRENDS
0%
10%
20%
30%
40%
50%
60%
70%
80%
90%
100%
0.0
5.0
10.0
15.0
20.0
25.0
30.0
FY01 FY02 FY03 FY04 FY05 FY06 FY07 FY08 FY09 FY10 FY11
DPS (LHS) DPS Growth (RHS)
Source: CPUreports
A cents
CHART 20: PAYOUT RATIO
0%
10%
20%
30%
40%
50%
60%
70%
80%
90%
FY01 FY02 FY03 FY04 FY05 FY06 FY07 FY08 FY09 FY10 FY11
Source: CPUreports, E&P Estimates
26
Capital allocation
CPU has maintained a balanced approach to capital allocation over time, with capital allocated
between buybacks, acquisitions and dividends. Chart 21. Capital management guidelines are:
• Capital management is considered when total debt/EBITDA approaches 1x.
• Will leverage up to 2.5x total debt/EBITDA and could consider 3x if there is a clear
subsequent de-leveraging strategy.
• Prefers share buybacks over special dividends given less than 20% of its earnings are
Australian-domiciled and franking is generally at 60%.
• Still considers itself to be in a growth phase and so its dividend payout ratio will likely
remain at around the historical level of approx. 40%.
• Acquisition targets must leverage CPU’s core competencies of record keeping,
communication and transfer agency. Pricing is at a ceiling of 5x post-integration
EBITDA.
CHART 21: CAPITAL ALLOCATION
-200
0
200
400
600
800
FY01 FY02 FY03 FY04 FY05 FY06 FY07 FY08 FY09 FY10 FY11
Net M&A Net buybacks Dividends
Source: CPU reports
$USm
Return on invested capital (ROIC)
ROIC is a good measure of the profitability of the firm’s asset base and the soundness of
management’s capital allocation decisions. It has increased steadily through CPU’s most
acquisitive periods leading up to FY07 and recently declined in line with lower financial
leverage, lower asset turnover and lower margins. Chart 21. Returns have increased steadily
from 6% in FY01 to over 12% in FY11, comfortably exceeding CPU’s weighted average cost of
capital of approx. 10.5%.
27
CHART 22: POST-TAX RETURN ON INVESTED CAPITAL
0.0%
4.0%
8.0%
12.0%
16.0%
20.0%
FY01 FY02 FY03 FY04 FY05 FY06 FY07 FY08 FY09 FY10 FY11
Source: CPU reports
Note: ROIC is defined as operating profits after tax divided by invested capital (debt+equity).
Du Pont analysis
Du Pont analysis decomposes return on capital into profit margin, asset turnover and equity
multiplier to identify key drivers of returns on equity (ROE).
ROE = operating efficiency (net profit/sales)
X
asset efficiency (sales/assets)
X
financial leverage (assets/equity)
ROE peaked at 36.6% in FY08 in line with the peak of the equity markets and has declined
since then to 21.2%.
TABLE 12: DU PONT ANALYSIS
28
CHART 23: NPAT MARGIN CHART 24: ASSET TURNOVER
0.0x
0.1x
0.2x
0.3x
0.4x
0.5x
0.6x
0.7x
0.8x
0.9x
FY01 FY02 FY03 FY04 FY05 FY06 FY07 FY08 FY09 FY10 FY11
Source: CPU reports
CHART 25: FINANCIAL LEVERAGE CHART 26: TOTAL DEBT/EBITDA
0.0x
0.5x
1.0x
1.5x
2.0x
2.5x
3.0x
3.5x
FY01 FY02 FY03 FY04 FY05 FY06 FY07 FY08 FY09 FY10 FY11
Source: CPU reports
0.0x
0.5x
1.0x
1.5x
2.0x
2.5x
3.0x
3.5x
4.0x
4.5x
FY01 FY02 FY03 FY04 FY05 FY06 FY07 FY08 FY09 FY10 FY11
Source: CPU Reports
FY11 result overview
Key elements of the FY11 results were:
• Revenue down 0.1% to US$1,618.6m. Recurring revenue lines held up well while
transactional revenue was under pressure.
• NPAT US$264.1m, down 10.4% on pcp,
• EBITDA margins down 100 bps to 30.5%.
• Growth in client balance levels drove strong margin income outcome. Chart 7.
• Management EPS of US55.7cps, down 3.7% on pcp.
• Final dividend of AUD14cps unchanged, franked at 60%.
United States (Revenue US$508.8m, EBITDA Margin 24.5%)
• US revenues -14% and EBITDA -12.8% vs FY10, driven by a reduction in mutual fund
proxy solicitation and bankruptcy administration activities
• Remains the largest contributor to group earnings.
• Improved cost management offset declining margin income from lower interest rates,
with EBITDA margins settling at 24.5%, up from 24.2% in FY10.
• Outlook driven by US economic outlook.
29
Australia & NZ (Revenue US$353.3m, EBITDA Margin 24.7%)
• Revenue down in local currency - Australia (-5.9%) and New Zealand (-6.4%), but
higher in USD terms.
• Despite a meaningful pickup in 2H, corporate action levels were down significantly:
Australia -30% and New Zealand -15% in local currency.
• EBITDA margins down 49 basis points to 24.7%.
UCIA (Revenue US$287.9m, EBITDA Margin 40.4%)
• UK revenues +8% and EBITDA +2% in local currency.
• Growth underpinned by full year contribution of HBOS EES business acquired in January
2010; UK based employee share plans provider.
• Voucher services (administration of Childcare Vouchers) and the deposit protection
scheme (Government-authorised landlord and letting agent deposit service) in the UK
also contributing positively.
• Irish business flat for the year whilst South African Business was marginally down.
Canada (Revenue US$203.2m, EBITDA Margin 46.2%)
• CPU’s highest margin segment.
• Margin balances benefited from an increase in interest rates.
• Total revenues +7.5% on FY10.
• Weakness in corporate actions market for a second year running.
Asia (Revenue US$124.2m, EBITDA Margin 38.9%)
• India competitive while Hong Kong IPO market remains strong.
• HK revenues up ~11% in local currency. Corporate actions growth remains key driver of
HK revenue growth.
• India revenues down -1% in local currency, up 2.2% in US$.
Continental Europe (Revenue US$95m, EBITDA Margin 14.8%)
• Revenue growth of 26.9% off a low base.
• Growth coming from consolidation of Registrar Nikoil in Russia and acquisition of
Servizio Titoli in Italy.
• German business saw revenue growth but a drop off in earnings due to a much quieter
meetings season.
•
FY12F Guidance
• CPU did not provide FY12F guidance given market volatility at the time. However, it will
most likely provide guidance at the 9 Nov AGM.
• Historically, revenue from other transaction lines following volatile periods have
replaced IPO and M&A income. But it is unclear whether that is the case this time.
30
8. BALANCE SHEET AND CASH FLOW
Cashflow generation
CPU’s high translation of accounting-based EBITDA to operating fee cashflow is one indication
of high quality earnings. Chart 27.
CHART 27: CASH CONVERSION RATIO
0%
20%
40%
60%
80%
100%
120%
140%
FY02 FY03 FY04 FY05 FY06 FY07 FY08 FY09 FY10 FY11
Source: CPU reports
Gross Operating Cashflow / EBITDA
Financial leverage
CPU manages financial leverage within a number of clear parameters:
• Capital management is considered when total debt/EBITDA falls towards 1x.
• Up to 2.5x total debt/EBITDA is considered the ceiling.
• Total debt/EBITDA of 3x is temporarily acceptable if there is a clear subsequent de-
leveraging strategy.
The proposed BNY Mellon acquisition will be cash/debt funded and result in debt/EBITDA of
less than 2.5x.
CHART 28: NET DEBT TO EBITDA
0.0x
0.5x
1.0x
1.5x
2.0x
2.5x
3.0x
FY01 FY02 FY03 FY04 FY05 FY06 FY07 FY08 FY09 FY10 FY11
Source: CPU reports
31
Interest cover
Interest is comfortably covered at over 12x.
CHART 29: INTEREST COVER
0.0x
3.0x
6.0x
9.0x
12.0x
15.0x
18.0x
21.0x
FY01 FY02 FY03 FY04 FY05 FY06 FY07 FY08 FY09 FY10 FY11
Source: CPU reports
Interest cover = EBIT/Interest costs
Asset efficiency
Asset efficiency encompasses capex (Chart 30), working capital (Chart 31) management and
asset turnover (Chart 24).
Capex/sales is in steady decline, driven by economies of scale. Working capital is aided by the
“free float” of the cash retained by CPU when administering (dividend and other) payments on
behalf of corporate clients. This relatively asset-light combination indicates that CPU is
organically scalable without the need for working capital expansion funding.
CHART 30: CAPEX/SALES CHART 31: WORKING CAPITAL/SALES
0.0%
1.0%
2.0%
3.0%
4.0%
5.0%
6.0%
7.0%
8.0%
FY01 FY02 FY03 FY04 FY05 FY06 FY07 FY08 FY09 FY10 FY11
Source: CPU reports
0%
5%
10%
15%
20%
25%
30%
FY01 FY02 FY03 FY04 FY05 FY06 FY07 FY08 FY09 FY10 FY11
Source: CPU reports
32
9. BOARD AND MANAGEMENT
Overview
Joint founder Christopher Morris remains Chairman after relinquishing executive
responsibilities held since listing in 1994. Co-founder, Tony Wales, resigned as a director in
2010, and retains a 5% interest in CPU.
Stuart Crosby, who has been with CPU for 12 years, was appointed CEO in 2006. Previously,
Stuart was National Head of Listings at the ASX and held senior roles with the Hong Kong
Securities and Futures Commission before joining Computershare in 1999.
Below CEO, non-executive directors and senior management show broad experience within
Computershare and in financial services generally.
TABLE 13: INSIDER EQUITY INTERESTS
Director Role Since Background Shares Options^
Christopher Morris Chairman 2006 Business Founder 46.0 - 8.3%
Stuart Crosby CEO/Managing Director 2006 ASX, HKSFC 0.6 1.2 0.3%
Penelope Maclagan Non-Executive Director 1995 Joined CPU in 1983 14.7 - 2.7%
Markus Kerber Non-Executive Director 2004 Deutsche Bank, Warburg & Co, German Treasury 0.0 - 0.0%
Simon Jones Non-Executive Director 2005 N.M. Rothschild & Sons, Arthur Andersen 0.0 - 0.0%
Les Owen Non-Executive Director 2007 AXA, Fed Treasurer's Fin. Sector Advisory Council 0.0 - 0.0%
Nerolie Withnall Non-Executive Director 2008 Minter Ellison, QM Technologies - -
Jerry Lieberman Non-Executive Director 2010 AllianceBernstein, Fidelity, Citicorp 0.0 - 0.0%
Total 61.4 1.2 11.3%
^Options & Performance Rights Source: Computershare Reports
Ownership (m) Diluted
Interest
Register
Computershare’s free float is ~79.3% or $3.2bn at the current market price.
Founders Christopher Morris and Tony Wales have progressively lowered their stakes in the
business, now holding a combined 13.3% interest.
Major institutional shareholders have been net buyers over the last four quarters.
TABLE 14: INSIDER EQUITY INTERESTS
Register Analysis
Issued Shares 555.7m Insider Ownership 20.7%
Free Float % 79.3% Institutional Ownership 21.4%
Current Substantials Position (m) O/S % Last Quarter Last Year Last 3 Yrs
Christopher Morris 46.0 8.3% -1.2 -1.5 -8.3
Perpetual 27.8 5.0% - - -19.3
Tony Wales 27.6 5.0% -0.5 -0.5 -1.5
Penelope Maclagan 14.7 2.7% 0.0 -0.2 -0.9
Westside Investments 10.4 1.9% - - -14.6
AFIC 8.2 1.5% - - -
Source: Factset
Transactions (m)
33
10. KEY RISKS AND CATALYSTS
Key risks
Cyclical
• The risk is a deferred recovery in the corporate actions cycle.
• One mitigant is that two out of three preconditions for cycle recovery (ie. strong US
corporate balance sheets and positive US yield curve) are in place and history suggests
that once the VIX stabilises below 30, the recovery in M&A activity will be swift.
• Another mitigant is that our MIGR analysis suggests a stressed downside DCF valuation
is $7.64 per share.
Anti-trust competition restrictions
• CPU’s increasing size may limit the potential for value-creating M&A activity or increase
the risk of ill-advised large transactions.
• The mitigant is that CPU has a very good M&A track record and talks rationally about its
pricing and target selection criteria.
Key Catalysts
• VIX decline below 30%, the missing precondition for corporate action recovery.
• A sustained decline in the AUDUSD.
• Approval of BNY Mellon.
• Other value-adding acquisition announcements.
• Rising interest rate cycle.
34
FINANCIAL SUMMARY
Computershare CPU
As at: 14/10/2011 Recommendation: Positive Share Price $7.48
Year end June 2011A 2012E 2013E 2014E
INCOME STATEMENT
Sales Revenue US$m 1,604 1,616 1,599 1,581
Consolidated EBITDA US$m 494 485 481 482
D&A US$m 41 41 41 41
Consolidated EBIT US$m 412 403 399 400
Net Interest US$m 33 31 23 15
Tax Expense US$m 100 83 84 86
Associates/Minorities US$m (5) (5) (5) (5)
Adj NPAT US$m 264 283 287 294
NRIs US$m (10) 0 0 0
Reported NPAT US$m 264 283 287 294
Shares on Issue (end period) m 556 556 556 556
EFPOWA m 556 556 556 556
EPS ¢ 55.7 55.9 56.5 57.8
DPS A¢ 28.0 28.0 31.0 34.0
Franking % 60% 60% 60% 60%
GROWTH/PROFITABILITY RATIOS
Sales Growth % 0.0% 0.7% (1.0)% (1.2)%
EBITDA Growth % (3.4)% (1.8)% (0.8)% 0.3%
EBIT Growth % (6.3)% (2.2)% (1.0)% 0.4%
EPS Growth % (3.7)% 0.4% 1.2% 2.3%
EBITDA/Sales % 30.8% 30.0% 30.1% 30.5%
EBIT/Sales % 25.7% 24.9% 24.9% 25.3%
EBIT Interest Cover x 12.6 12.8 17.4 26.6
Tax Rate % 26.3% 22.4% 22.4% 22.4%
ROE % 22.4% 20.9% 19.3% 18.1%
ROFE % 24.5% 23.5% 23.8% 24.3%
CASH FLOW
EBITDA US$m 494 485 481 482
Change in Working Capital US$m (21) 11 0 0
Other US$m (39) 0 0 0
Gross Operating Cash Flow US$m 433 496 480 482
Net Interest Paid US$m (27) (31) (23) (15)
Tax Paid US$m (87) (83) (84) (86)
Net Operating Cash Flow US$m 319 381 373 380
Maintenance Capex US$m (23) (44) (44) (44)
Free Cash Flow US$m 296 338 330 337
Dividends Paid US$m (155) (156) (164) (181)
Expansionary Capex US$m 0 0 0 0
Acquisitions US$m (66) 0 0 0
Asset Sales US$m 8 0 0 0
Dividends Received US$m 1 0 0 0
Shares Issues/Buybacks US$m (30) 0 0 0
Other US$m 0 0 0 0
Increase in Net Cash/(Debt) US$m 53 182 166 156
GOCF/EBITDA % 88% 102% 100% 100%
Total Capex/Sales % 1.5% 2.7% 2.7% 2.8%
Total Capex/Depreciation x (0.6) (1.1) (1.1) (1.1)
Year end June 2011A 2012E 2013E 2014E
VALUATION METRICS
PER x 13.7 13.6 13.5 13.2
P/EG (2YR) x 8.7 3.9
Dividend Yield % 3.7% 3.7% 4.1% 4.5%
EV/EBITDA x 9.9 9.7 9.5 9.1
EV/EBIT x 11.9 11.7 11.4 11.0
P/FCF x 14.3 12.5 12.9 12.6
P/BV x 3.4 3.1 2.8 2.6
BALANCE SHEET
Assets
Cash US$m 347 347 347 347
Working Capital US$m 313 299 296 293
PP&E US$m 155 158 161 164
Intangibles US$m 3,283 3,241 3,200 3,158
Investments US$m 28 28 28 28
Other US$m (1,267) (1,267) (1,267) (1,267)
Total Assets US$m 2,873 2,821 2,779 2,737
Liabilities
Debt US$m 1,013 831 666 510
Working Capital US$m 367 364 356 332
Other US$m 214 214 214 214
Total Liabilities US$m 1,628 1,443 1,269 1,089
Equity US$m 1,245 1,378 1,510 1,649
Capital Employed US$m 1,912 1,862 1,828 1,811
Net Debt/(Cash) US$m 666 484 318 162
Net Debt/Equity % 53.5% 35.1% 21.1% 9.8%
Net Debt/Debt+Equity % 34.9% 26.0% 17.4% 9.0%
Net Debt/EBITDA x 1.3 1.0 0.7 0.3
Working Capital/Sales % (3.4%) (4.0%) (3.8%) (2.5%)
D&A/PP&E % (26.2%) (25.7%) (25.2%) (24.7%)
DCF VALUATION $m $/share
Risk Free Rate 6.5% Equity Value 4,774 $8.59
Market Risk Premium 6.0% (Net Debt)/Cash (679) ($1.22)
Beta 1.00 Franking Credits $0.68
WACC 10.5% DCF Valuation $9.27
Australia & New Zealand US$m 353 366 344 322
Asia US$m 124 126 132 142
Continental Europe US$m 95 91 91 91
UCIA US$m 288 273 265 235
United States US$m 509 509 515 531
Canada US$m 203 202 205 212
Technology & Other US$m 34 34 34 34
Group Revenue US$m 1,604 1,616 1,599 1,581
Australia & New Zealand US$m 87 91 85 80
Asia US$m 48 50 53 57
Continental Europe US$m 14 14 14 14
UCIA US$m 116 112 109 97
United States US$m 125 125 126 135
Canada US$m 94 93 94 100
Technology & other US$m (5) 0 0 0
Group EBITDA US$m 480 485 481 482
Australia & New Zealand % 24.7% 24.7% 24.7% 24.8%
Asia % 38.9% 39.7% 39.7% 40.0%
Continental Europe % 14.7% 15.1% 15.1% 15.1%
UCIA % 40.4% 41.1% 41.1% 41.1%
United States % 24.5% 24.5% 24.5% 25.5%
Canada % 46.2% 46.0% 46.0% 47.0%
Technology & Other % (14.2%) 0.0% 0.0% 0.0%
Group EBITDA/Sales % 29.9% 30.0% 30.1% 30.5%
DIVISIONAL SUMMARY
35
22%
24%
26%
28%
30%
32%
34%
2010 2011 2012 2013 2014
Margin Trends
EBITDA/Sales EBIT/Sales
11
14
17
20
23
26
29
6%
12%
18%
24%
30%
36%
42%
2010 2011 2012 2013 2014
Gearing & Interest Cover
Net Debt/NetDebt+Equity (%) EBIT Interest Cover (x)
12%
15%
18%
21%
24%
27%
30%
2010 2011 2012 2013 2014
Return Trends
ROE ROA ROFE - Reported
RESEARCH RECOMMENDATION DEFINITIONS
Positive Stock is expected to outperform the S&P/ASX 200 over the coming 24 months
Neutral Stock expected to perform in line with the S&P/ASX 200 over the coming 24 months
Negative Stock is expected to underperform the S&P/ASX 200 over the coming 24 months
Speculative Stock has limited history from which to derive a fundamental investment view or its prospects
are highly dependent on event risk, eg. Successful exploration, scientific breakthrough, high
commodity prices, regulatory change, etc.
Suspended Stock is temporarily suspended due to compliance with applicable regulatory and/or Evans &
Partners policies in circumstances where Evans & Partners is acting in an advisory capacity.
Not Rated Stock is not included in our investment research universe.
Research Criteria Definitions
Recommendations are primarily determined with reference to how a stock ranks relative to the S&P/ASX 200 on
the following criteria:
Valuation Rolling 12 month prospective multiples (composite of Price-to-Earnings Ratio, Dividend
Yield and EV/EBITDA), or long-term NPV for resource stocks.
Earnings Outlook Forecast 2 year EPS growth.
Earnings Momentum Percentage change in the current consensus EPS estimate for the stock (rolling 1 year
forward basis) over the consensus EPS estimate for the stock 3 months ago.
Shareholder Returns Composite of forecast ROE (rolling 1 year forward basis) and the percentage change in
ROE over 2 years.
Debt Servicing Capacity Rolling 12 month EBIT Interest Cover ratio.
Cyclical Risk Qualitative assessment of the 2 year outlook for a stock/industry’s profit cycle.
Industry Quality Qualitative assessment of an industry’s growth/returns potential and company specific
management capability.
Financial Transparency If we don’t understand it, we won’t recommend it.
For stocks where Evans & Partners does not generate its own forecasts, Bloomberg consensus data is used.
Analysts can introduce other factors when determining their recommendation, with any material factors stated in
the written research where appropriate.
36
GENERAL RESEARCH DISCLAIMER, WARNING & DISCLOSURES
This document is provided by Evans and Partners ABN 85 125 338 785, holder of AFSL 318075.
The information is general advice only and does not take into consideration an investor’s objectives, financial situation or needs. Before acting on
the advice, investors should consider the appropriateness of the advice, having regard to the investor’s objectives, financial situation and needs. If
the advice relates to a financial product that is the subject of a Product Disclosure Statement (e.g. unlisted managed funds) investors should obtain
the PDS and consider it before making any decision about whether to acquire the product.
The material contained in this document is for information purposes only and does not constitute an offer, solicitation or recommendation with
respect to the purchase or sale of securities. It should not be regarded by recipients as a substitute for the exercise of their own judgment.
Investors should be aware that past performance is not an infallible indicator of future performance and future returns are not guaranteed.
Any opinions and/or recommendations expressed in this material are subject to change without notice and Evans and Partners is not under any
obligation to update or keep current the information contained herein. References made to third parties are based on information believed to be
reliable but are not guaranteed as being accurate.
This document is provided to the recipient only and is not to be distributed to third parties without the prior consent of Evans and Partners.
EVANS AND PARTNERS DISCLOSURE OF INTERESTS
Evans and Partners and its respective officers and associates may have an interest in the securities or derivatives of any entities referred to in this
material.
Evans and Partners does, and seeks to do, business with companies that are the subject of its research reports.
EVANS AND PARTNERS CORPORATE RELATIONSHIP DISCLOSURE
AYUHA: Evans and Partners have arranged, managed or co-managed a public offering of the company or its affiliates in the past 12 months.
BHP: A director of Evans and Partners Pty Ltd Advisory Board is a director of BHP Billiton Ltd.
BPA: Evans and Partners have been appointed by the Issuer as Broker to an on-market buy-back. Accordingly, Evans and Partners are unable to
give Sellers advice in respect of a sale of this security.
BSL: A director of Evans and Partners Pty Ltd Advisory Board is a director of BlueScope Steel Ltd.
BOQ, BOQPA, BOQPC: A director of Evans and Partners Pty Ltd Advisory Board is a director of Bank of Queensland.
CBA: Evans and Partners managed or co-managed a public offering of securities of the company or its affiliates in the past 12 months.
CBAHA: Evans and Partners managed or co-managed a public offering of securities of the company or its affiliates in the past 12 months.
FGL: A director of Evans and Partners Pty Ltd Advisory Board is a director of Fosters Group Ltd.
HHY: Evans and Partners have been appointed by the Issuer as Broker to an on-market buy-back. Accordingly, Evans and Partners are unable to
give Sellers advice in respect of a sale of this security.
LLC: A director of Evans and Partners Pty Ltd Advisory Board is a director of Lend Lease Corporation Ltd.
MQG: MQCPA: A director of Evans and Partners Pty Ltd Advisory Board is a director of Macquarie Group Ltd.
ORG: A director of Evans and Partners Pty Ltd Advisory Board is a director of Origin Energy Ltd.
PPC: Evans and Partners managed or co-managed a public offering of securities of the company or its affiliates in the past 12 months.
OOH: Evans and Partners have arranged, managed or co-managed a public offering of the company or its affiliates in the past 12 months.
QRN: Evans and Partners managed or co-managed a public offering of securities of the company or its affiliates in the past 12 months.
SAR: Evans and Partners managed or co-managed a public offering of securities of the company or its affiliates in the past 12 months.
SNO: Evans and partners has received during the past 12 months compensation for financial & advisory services from the company, its parent, or its
wholly owned or majority owned subsidiary. Evans and Partners managed or co-managed a public offering of securities of the company or its
affiliates in the past 12 months.
RESEARCH ANALYST CERTIFICATION
I, George Gabriel, CFA, hereby certify that all the views expressed in this report accurately reflect my personal views about the subject investment
theme &/or company securities. I also certify that no part of my compensation was, is, or will be, directly or indirectly, related to the specific
recommendations or views expressed in this report.
RESEARCH ANALYST DISCLOSURE OF INTEREST
I, George Gabriel, CFA, &/or entities in which I have a pecuniary interest, have an exposure to the following securities &/or managed products: TGA.
DISCLAIMER
Except for any liability which cannot be excluded, Evans & Partners, its directors, employees & agents accept no liability or responsibility whatsoever
for any loss or damage of any kind, direct or indirect, arising out of the use of all or any part of this material. All information is correct at the time
of publication; additional information may be available upon request.

More Related Content

What's hot

Kb value focus korea equity
Kb value focus korea equityKb value focus korea equity
Kb value focus korea equitykbasset
 
Due diligence document
Due diligence documentDue diligence document
Due diligence documentkbasset
 
Opeb investments the danger in playing it safe
Opeb investments the danger in playing it safeOpeb investments the danger in playing it safe
Opeb investments the danger in playing it safeJim van Iwaarden
 
Frank k. reilly & keith132
Frank k. reilly & keith132Frank k. reilly & keith132
Frank k. reilly & keith132saminamanzoor1
 
Types of dividend policy
Types of dividend policyTypes of dividend policy
Types of dividend policyrohanjagtap007
 
Overview of Working Capital Management
Overview of Working Capital Management Overview of Working Capital Management
Overview of Working Capital Management Jasimuddin Rony
 
FINAL_FINE_Package_Henry Apostoleris
FINAL_FINE_Package_Henry ApostolerisFINAL_FINE_Package_Henry Apostoleris
FINAL_FINE_Package_Henry ApostolerisHenry Apostoleris
 
Performance Shares: Perspectives from the morning after 24May2016 final
Performance Shares: Perspectives from the morning after 24May2016 finalPerformance Shares: Perspectives from the morning after 24May2016 final
Performance Shares: Perspectives from the morning after 24May2016 finalJames Sillery
 
BofA Gobal Financials CEO Conference, September-2021
BofA Gobal Financials CEO Conference, September-2021BofA Gobal Financials CEO Conference, September-2021
BofA Gobal Financials CEO Conference, September-2021Aegon
 
Recent Trends and Issues in ESPPs
Recent Trends and Issues in ESPPsRecent Trends and Issues in ESPPs
Recent Trends and Issues in ESPPsGeoff Hammel
 
Pricing and How CECL Affects It
Pricing and How CECL Affects ItPricing and How CECL Affects It
Pricing and How CECL Affects ItBaker Hill
 
GEO NECF 2015 - Best Practices and Trends in Financial Reporting
GEO NECF 2015 - Best Practices and Trends in Financial ReportingGEO NECF 2015 - Best Practices and Trends in Financial Reporting
GEO NECF 2015 - Best Practices and Trends in Financial ReportingAndrea Huck-Esposito
 
Market based cash balance plans
Market based cash balance plansMarket based cash balance plans
Market based cash balance plansJim van Iwaarden
 

What's hot (19)

Kb value focus korea equity
Kb value focus korea equityKb value focus korea equity
Kb value focus korea equity
 
Due diligence document
Due diligence documentDue diligence document
Due diligence document
 
ETFC Initiation
ETFC InitiationETFC Initiation
ETFC Initiation
 
Capital rationing
Capital rationingCapital rationing
Capital rationing
 
Opeb investments the danger in playing it safe
Opeb investments the danger in playing it safeOpeb investments the danger in playing it safe
Opeb investments the danger in playing it safe
 
Frank k. reilly & keith132
Frank k. reilly & keith132Frank k. reilly & keith132
Frank k. reilly & keith132
 
Types of dividend policy
Types of dividend policyTypes of dividend policy
Types of dividend policy
 
Overview of Working Capital Management
Overview of Working Capital Management Overview of Working Capital Management
Overview of Working Capital Management
 
FINAL_FINE_Package_Henry Apostoleris
FINAL_FINE_Package_Henry ApostolerisFINAL_FINE_Package_Henry Apostoleris
FINAL_FINE_Package_Henry Apostoleris
 
Performance Shares: Perspectives from the morning after 24May2016 final
Performance Shares: Perspectives from the morning after 24May2016 finalPerformance Shares: Perspectives from the morning after 24May2016 final
Performance Shares: Perspectives from the morning after 24May2016 final
 
Dfa all slides 2013
Dfa all slides 2013Dfa all slides 2013
Dfa all slides 2013
 
BofA Gobal Financials CEO Conference, September-2021
BofA Gobal Financials CEO Conference, September-2021BofA Gobal Financials CEO Conference, September-2021
BofA Gobal Financials CEO Conference, September-2021
 
Recent Trends and Issues in ESPPs
Recent Trends and Issues in ESPPsRecent Trends and Issues in ESPPs
Recent Trends and Issues in ESPPs
 
Pricing and How CECL Affects It
Pricing and How CECL Affects ItPricing and How CECL Affects It
Pricing and How CECL Affects It
 
GEO NECF 2015 - Best Practices and Trends in Financial Reporting
GEO NECF 2015 - Best Practices and Trends in Financial ReportingGEO NECF 2015 - Best Practices and Trends in Financial Reporting
GEO NECF 2015 - Best Practices and Trends in Financial Reporting
 
Dividend Policy
Dividend PolicyDividend Policy
Dividend Policy
 
Valuing stocks
Valuing stocksValuing stocks
Valuing stocks
 
Market based cash balance plans
Market based cash balance plansMarket based cash balance plans
Market based cash balance plans
 
Overview of working capital management
Overview of working capital managementOverview of working capital management
Overview of working capital management
 

Similar to Computershare (CPU) initiation report - well-priced quality franchise with free upside optionality

DIVIDEND PAYOUT Dividend payout is the amount of cash that a com.docx
DIVIDEND PAYOUT Dividend payout is the amount of cash that a com.docxDIVIDEND PAYOUT Dividend payout is the amount of cash that a com.docx
DIVIDEND PAYOUT Dividend payout is the amount of cash that a com.docxmadlynplamondon
 
Sheet1NPV and IRR TemplateAssumptions & inputsrequired rate of re.docx
Sheet1NPV and IRR TemplateAssumptions & inputsrequired rate of re.docxSheet1NPV and IRR TemplateAssumptions & inputsrequired rate of re.docx
Sheet1NPV and IRR TemplateAssumptions & inputsrequired rate of re.docxmaoanderton
 
Fundamental analysis october 2012
Fundamental analysis october 2012Fundamental analysis october 2012
Fundamental analysis october 2012Omeng Tawid
 
WFM - Initiating Coverage - Report
WFM - Initiating Coverage - ReportWFM - Initiating Coverage - Report
WFM - Initiating Coverage - ReportAlessandro Masi
 
Financial services sector - implications of FOFA, possible acquires of SFW, S...
Financial services sector - implications of FOFA, possible acquires of SFW, S...Financial services sector - implications of FOFA, possible acquires of SFW, S...
Financial services sector - implications of FOFA, possible acquires of SFW, S...George Gabriel
 
SFW - FOFA implications, Sum of parts valuation, possible acquirers
SFW - FOFA implications, Sum of parts valuation, possible acquirers SFW - FOFA implications, Sum of parts valuation, possible acquirers
SFW - FOFA implications, Sum of parts valuation, possible acquirers George Gabriel
 
Hancock holding q1-14_presentation
Hancock holding q1-14_presentationHancock holding q1-14_presentation
Hancock holding q1-14_presentationCompany Spotlight
 
Uop fin 370 final exam guide
Uop fin 370 final exam guideUop fin 370 final exam guide
Uop fin 370 final exam guideLast7693
 
Uop fin 370 final exam guide
Uop fin 370 final exam guideUop fin 370 final exam guide
Uop fin 370 final exam guideshyaminfotech
 
Uop fin 370 final exam guide
Uop fin 370 final exam guideUop fin 370 final exam guide
Uop fin 370 final exam guidevikscarter
 
What is this Project’s Objective This project is designe.docx
What is this Project’s Objective  This project is designe.docxWhat is this Project’s Objective  This project is designe.docx
What is this Project’s Objective This project is designe.docxalanfhall8953
 
Uop fin 370 final exam guide
Uop fin 370 final exam guideUop fin 370 final exam guide
Uop fin 370 final exam guideolivergeorg
 
Citibank Global Market Challenge 2020 (Top 3 in UNSW)
Citibank Global Market Challenge 2020 (Top 3 in UNSW)Citibank Global Market Challenge 2020 (Top 3 in UNSW)
Citibank Global Market Challenge 2020 (Top 3 in UNSW)University of New South Wales
 
Bentham Global Credit update
Bentham Global Credit updateBentham Global Credit update
Bentham Global Credit updateMichael Kennedy
 
$SPGI Stock Pitch - Aashish Chaturvedi at University of Chicago Booth School ...
$SPGI Stock Pitch - Aashish Chaturvedi at University of Chicago Booth School ...$SPGI Stock Pitch - Aashish Chaturvedi at University of Chicago Booth School ...
$SPGI Stock Pitch - Aashish Chaturvedi at University of Chicago Booth School ...Aashish Chaturvedi
 
20180620 sauc oppenheimer consumer conference widescreen final
20180620 sauc oppenheimer consumer conference widescreen final20180620 sauc oppenheimer consumer conference widescreen final
20180620 sauc oppenheimer consumer conference widescreen finaldrhincorporated
 
Fin 515 week 6 problems solutions
Fin 515 week 6 problems solutionsFin 515 week 6 problems solutions
Fin 515 week 6 problems solutionsliserresi1985
 

Similar to Computershare (CPU) initiation report - well-priced quality franchise with free upside optionality (20)

BX Initiation
BX InitiationBX Initiation
BX Initiation
 
DIVIDEND PAYOUT Dividend payout is the amount of cash that a com.docx
DIVIDEND PAYOUT Dividend payout is the amount of cash that a com.docxDIVIDEND PAYOUT Dividend payout is the amount of cash that a com.docx
DIVIDEND PAYOUT Dividend payout is the amount of cash that a com.docx
 
Sheet1NPV and IRR TemplateAssumptions & inputsrequired rate of re.docx
Sheet1NPV and IRR TemplateAssumptions & inputsrequired rate of re.docxSheet1NPV and IRR TemplateAssumptions & inputsrequired rate of re.docx
Sheet1NPV and IRR TemplateAssumptions & inputsrequired rate of re.docx
 
Fundamental analysis october 2012
Fundamental analysis october 2012Fundamental analysis october 2012
Fundamental analysis october 2012
 
WFM - Initiating Coverage - Report
WFM - Initiating Coverage - ReportWFM - Initiating Coverage - Report
WFM - Initiating Coverage - Report
 
Financial services sector - implications of FOFA, possible acquires of SFW, S...
Financial services sector - implications of FOFA, possible acquires of SFW, S...Financial services sector - implications of FOFA, possible acquires of SFW, S...
Financial services sector - implications of FOFA, possible acquires of SFW, S...
 
SFW - FOFA implications, Sum of parts valuation, possible acquirers
SFW - FOFA implications, Sum of parts valuation, possible acquirers SFW - FOFA implications, Sum of parts valuation, possible acquirers
SFW - FOFA implications, Sum of parts valuation, possible acquirers
 
Hancock holding q1-14_presentation
Hancock holding q1-14_presentationHancock holding q1-14_presentation
Hancock holding q1-14_presentation
 
Uop fin 370 final exam guide
Uop fin 370 final exam guideUop fin 370 final exam guide
Uop fin 370 final exam guide
 
Uop fin 370 final exam guide
Uop fin 370 final exam guideUop fin 370 final exam guide
Uop fin 370 final exam guide
 
Uop fin 370 final exam guide
Uop fin 370 final exam guideUop fin 370 final exam guide
Uop fin 370 final exam guide
 
What is this Project’s Objective This project is designe.docx
What is this Project’s Objective  This project is designe.docxWhat is this Project’s Objective  This project is designe.docx
What is this Project’s Objective This project is designe.docx
 
Uop fin 370 final exam guide
Uop fin 370 final exam guideUop fin 370 final exam guide
Uop fin 370 final exam guide
 
Citibank Global Market Challenge 2020 (Top 3 in UNSW)
Citibank Global Market Challenge 2020 (Top 3 in UNSW)Citibank Global Market Challenge 2020 (Top 3 in UNSW)
Citibank Global Market Challenge 2020 (Top 3 in UNSW)
 
Bentham Global Credit update
Bentham Global Credit updateBentham Global Credit update
Bentham Global Credit update
 
$SPGI Stock Pitch - Aashish Chaturvedi at University of Chicago Booth School ...
$SPGI Stock Pitch - Aashish Chaturvedi at University of Chicago Booth School ...$SPGI Stock Pitch - Aashish Chaturvedi at University of Chicago Booth School ...
$SPGI Stock Pitch - Aashish Chaturvedi at University of Chicago Booth School ...
 
20180620 sauc oppenheimer consumer conference widescreen final
20180620 sauc oppenheimer consumer conference widescreen final20180620 sauc oppenheimer consumer conference widescreen final
20180620 sauc oppenheimer consumer conference widescreen final
 
FIG Initiation
FIG InitiationFIG Initiation
FIG Initiation
 
Fin 515 week 6 problems solutions
Fin 515 week 6 problems solutionsFin 515 week 6 problems solutions
Fin 515 week 6 problems solutions
 
Q2 presentation v3
Q2 presentation v3Q2 presentation v3
Q2 presentation v3
 

More from George Gabriel

Adveritas (AV1) - Is Adveritas the next Dubber (DUB)
Adveritas (AV1) - Is Adveritas the next Dubber (DUB) Adveritas (AV1) - Is Adveritas the next Dubber (DUB)
Adveritas (AV1) - Is Adveritas the next Dubber (DUB) George Gabriel
 
Adveritas (AV1) - ARR Growth Tracker
Adveritas (AV1) - ARR Growth Tracker Adveritas (AV1) - ARR Growth Tracker
Adveritas (AV1) - ARR Growth Tracker George Gabriel
 
STOCK SNAPSHOT - De.mem Limited - Water treatment tech with growing recurring...
STOCK SNAPSHOT - De.mem Limited - Water treatment tech with growing recurring...STOCK SNAPSHOT - De.mem Limited - Water treatment tech with growing recurring...
STOCK SNAPSHOT - De.mem Limited - Water treatment tech with growing recurring...George Gabriel
 
Wilsons Aged care, Health services and Retirement villages conference monda...
Wilsons Aged care, Health services and Retirement villages conference   monda...Wilsons Aged care, Health services and Retirement villages conference   monda...
Wilsons Aged care, Health services and Retirement villages conference monda...George Gabriel
 
LatAm Autos (LAA) - Investor Presentation - 24 October 2017
LatAm Autos (LAA) -  Investor Presentation - 24 October 2017LatAm Autos (LAA) -  Investor Presentation - 24 October 2017
LatAm Autos (LAA) - Investor Presentation - 24 October 2017George Gabriel
 
Henderson Global Group (HGG) - equity research initiation report
Henderson Global Group (HGG) - equity research initiation reportHenderson Global Group (HGG) - equity research initiation report
Henderson Global Group (HGG) - equity research initiation reportGeorge Gabriel
 
BT Funds Management - bigger, better, bolder BT - 20130501
BT Funds Management - bigger, better, bolder BT - 20130501BT Funds Management - bigger, better, bolder BT - 20130501
BT Funds Management - bigger, better, bolder BT - 20130501George Gabriel
 
Aged care sector - reviewing the investment case - 190215
Aged care sector - reviewing the investment case - 190215  Aged care sector - reviewing the investment case - 190215
Aged care sector - reviewing the investment case - 190215 George Gabriel
 
More Bank for your Buck - NAB
More Bank for your Buck - NAB More Bank for your Buck - NAB
More Bank for your Buck - NAB George Gabriel
 
Tech Mpire (TMP) Business Overview - August 2017
Tech Mpire (TMP) Business Overview - August 2017 Tech Mpire (TMP) Business Overview - August 2017
Tech Mpire (TMP) Business Overview - August 2017 George Gabriel
 
Tech Mpire (TMP) - Product Presentation - July 2017
Tech Mpire (TMP) - Product Presentation - July 2017 Tech Mpire (TMP) - Product Presentation - July 2017
Tech Mpire (TMP) - Product Presentation - July 2017 George Gabriel
 
Evolution of value investing - all roads lead to Graham and Doddsville
Evolution of value investing - all roads lead to Graham and DoddsvilleEvolution of value investing - all roads lead to Graham and Doddsville
Evolution of value investing - all roads lead to Graham and DoddsvilleGeorge Gabriel
 
MONEY IN THE BANK - bank sector outlook
MONEY IN THE BANK - bank sector outlook MONEY IN THE BANK - bank sector outlook
MONEY IN THE BANK - bank sector outlook George Gabriel
 
10 reasons we recommend NAB
10 reasons we recommend NAB 10 reasons we recommend NAB
10 reasons we recommend NAB George Gabriel
 
Bendigo Bank (EBN) - finding an earnings base
Bendigo Bank (EBN) - finding an earnings base Bendigo Bank (EBN) - finding an earnings base
Bendigo Bank (EBN) - finding an earnings base George Gabriel
 
George Gabriel presentation - Digital Disruptors Conference 2015
George Gabriel presentation - Digital Disruptors Conference 2015 George Gabriel presentation - Digital Disruptors Conference 2015
George Gabriel presentation - Digital Disruptors Conference 2015 George Gabriel
 
MMS - earnings implications of management equity incentives
MMS - earnings implications of management equity incentivesMMS - earnings implications of management equity incentives
MMS - earnings implications of management equity incentivesGeorge Gabriel
 
3PL - equity research - initiation report
3PL - equity research - initiation report3PL - equity research - initiation report
3PL - equity research - initiation reportGeorge Gabriel
 
FSA - equity research initiation report
FSA - equity research initiation reportFSA - equity research initiation report
FSA - equity research initiation reportGeorge Gabriel
 

More from George Gabriel (20)

Adveritas (AV1) - Is Adveritas the next Dubber (DUB)
Adveritas (AV1) - Is Adveritas the next Dubber (DUB) Adveritas (AV1) - Is Adveritas the next Dubber (DUB)
Adveritas (AV1) - Is Adveritas the next Dubber (DUB)
 
Adveritas (AV1) - ARR Growth Tracker
Adveritas (AV1) - ARR Growth Tracker Adveritas (AV1) - ARR Growth Tracker
Adveritas (AV1) - ARR Growth Tracker
 
STOCK SNAPSHOT - De.mem Limited - Water treatment tech with growing recurring...
STOCK SNAPSHOT - De.mem Limited - Water treatment tech with growing recurring...STOCK SNAPSHOT - De.mem Limited - Water treatment tech with growing recurring...
STOCK SNAPSHOT - De.mem Limited - Water treatment tech with growing recurring...
 
Wilsons Aged care, Health services and Retirement villages conference monda...
Wilsons Aged care, Health services and Retirement villages conference   monda...Wilsons Aged care, Health services and Retirement villages conference   monda...
Wilsons Aged care, Health services and Retirement villages conference monda...
 
LatAm Autos (LAA) - Investor Presentation - 24 October 2017
LatAm Autos (LAA) -  Investor Presentation - 24 October 2017LatAm Autos (LAA) -  Investor Presentation - 24 October 2017
LatAm Autos (LAA) - Investor Presentation - 24 October 2017
 
Henderson Global Group (HGG) - equity research initiation report
Henderson Global Group (HGG) - equity research initiation reportHenderson Global Group (HGG) - equity research initiation report
Henderson Global Group (HGG) - equity research initiation report
 
BT Funds Management - bigger, better, bolder BT - 20130501
BT Funds Management - bigger, better, bolder BT - 20130501BT Funds Management - bigger, better, bolder BT - 20130501
BT Funds Management - bigger, better, bolder BT - 20130501
 
Aged care sector - reviewing the investment case - 190215
Aged care sector - reviewing the investment case - 190215  Aged care sector - reviewing the investment case - 190215
Aged care sector - reviewing the investment case - 190215
 
More Bank for your Buck - NAB
More Bank for your Buck - NAB More Bank for your Buck - NAB
More Bank for your Buck - NAB
 
Tech Mpire (TMP) Business Overview - August 2017
Tech Mpire (TMP) Business Overview - August 2017 Tech Mpire (TMP) Business Overview - August 2017
Tech Mpire (TMP) Business Overview - August 2017
 
Tech Mpire (TMP) - Product Presentation - July 2017
Tech Mpire (TMP) - Product Presentation - July 2017 Tech Mpire (TMP) - Product Presentation - July 2017
Tech Mpire (TMP) - Product Presentation - July 2017
 
Evolution of value investing - all roads lead to Graham and Doddsville
Evolution of value investing - all roads lead to Graham and DoddsvilleEvolution of value investing - all roads lead to Graham and Doddsville
Evolution of value investing - all roads lead to Graham and Doddsville
 
MONEY IN THE BANK - bank sector outlook
MONEY IN THE BANK - bank sector outlook MONEY IN THE BANK - bank sector outlook
MONEY IN THE BANK - bank sector outlook
 
10 reasons we recommend NAB
10 reasons we recommend NAB 10 reasons we recommend NAB
10 reasons we recommend NAB
 
Bendigo Bank (EBN) - finding an earnings base
Bendigo Bank (EBN) - finding an earnings base Bendigo Bank (EBN) - finding an earnings base
Bendigo Bank (EBN) - finding an earnings base
 
George Gabriel presentation - Digital Disruptors Conference 2015
George Gabriel presentation - Digital Disruptors Conference 2015 George Gabriel presentation - Digital Disruptors Conference 2015
George Gabriel presentation - Digital Disruptors Conference 2015
 
MMS - earnings implications of management equity incentives
MMS - earnings implications of management equity incentivesMMS - earnings implications of management equity incentives
MMS - earnings implications of management equity incentives
 
3PL - equity research - initiation report
3PL - equity research - initiation report3PL - equity research - initiation report
3PL - equity research - initiation report
 
FSA - equity research initiation report
FSA - equity research initiation reportFSA - equity research initiation report
FSA - equity research initiation report
 
BUY Australian Banks
BUY Australian BanksBUY Australian Banks
BUY Australian Banks
 

Recently uploaded

Nicola Mining Inc. Corporate Presentation April 2024
Nicola Mining Inc. Corporate Presentation April 2024Nicola Mining Inc. Corporate Presentation April 2024
Nicola Mining Inc. Corporate Presentation April 2024nicola_mining
 
OKC Thunder Reveal Game 2 Playoff T Shirts
OKC Thunder Reveal Game 2 Playoff T ShirtsOKC Thunder Reveal Game 2 Playoff T Shirts
OKC Thunder Reveal Game 2 Playoff T Shirtsrahman018755
 
VIP 7001035870 Find & Meet Hyderabad Call Girls Shamirpet high-profile Call Girl
VIP 7001035870 Find & Meet Hyderabad Call Girls Shamirpet high-profile Call GirlVIP 7001035870 Find & Meet Hyderabad Call Girls Shamirpet high-profile Call Girl
VIP 7001035870 Find & Meet Hyderabad Call Girls Shamirpet high-profile Call Girladitipandeya
 
Collective Mining | Corporate Presentation - April 2024
Collective Mining | Corporate Presentation - April 2024Collective Mining | Corporate Presentation - April 2024
Collective Mining | Corporate Presentation - April 2024CollectiveMining1
 
VIP Call Girl Amritsar 7001035870 Enjoy Call Girls With Our Escorts
VIP Call Girl Amritsar 7001035870 Enjoy Call Girls With Our EscortsVIP Call Girl Amritsar 7001035870 Enjoy Call Girls With Our Escorts
VIP Call Girl Amritsar 7001035870 Enjoy Call Girls With Our Escortssonatiwari757
 
Osisko Gold Royalties Ltd - Corporate Presentation, April 23, 2024
Osisko Gold Royalties Ltd - Corporate Presentation, April 23, 2024Osisko Gold Royalties Ltd - Corporate Presentation, April 23, 2024
Osisko Gold Royalties Ltd - Corporate Presentation, April 23, 2024Osisko Gold Royalties Ltd
 
VIP 7001035870 Find & Meet Hyderabad Call Girls Abids high-profile Call Girl
VIP 7001035870 Find & Meet Hyderabad Call Girls Abids high-profile Call GirlVIP 7001035870 Find & Meet Hyderabad Call Girls Abids high-profile Call Girl
VIP 7001035870 Find & Meet Hyderabad Call Girls Abids high-profile Call Girladitipandeya
 
如何办理伦敦大学毕业证(文凭)London学位证书
如何办理伦敦大学毕业证(文凭)London学位证书如何办理伦敦大学毕业证(文凭)London学位证书
如何办理伦敦大学毕业证(文凭)London学位证书Fis s
 
VIP 7001035870 Find & Meet Hyderabad Call Girls Shamshabad high-profile Call ...
VIP 7001035870 Find & Meet Hyderabad Call Girls Shamshabad high-profile Call ...VIP 7001035870 Find & Meet Hyderabad Call Girls Shamshabad high-profile Call ...
VIP 7001035870 Find & Meet Hyderabad Call Girls Shamshabad high-profile Call ...aditipandeya
 
Methanex Investor Presentation (April 2024)
Methanex Investor Presentation (April 2024)Methanex Investor Presentation (April 2024)
Methanex Investor Presentation (April 2024)Methanex Corporation
 
VIP 7001035870 Find & Meet Hyderabad Call Girls Miyapur high-profile Call Girl
VIP 7001035870 Find & Meet Hyderabad Call Girls Miyapur high-profile Call GirlVIP 7001035870 Find & Meet Hyderabad Call Girls Miyapur high-profile Call Girl
VIP 7001035870 Find & Meet Hyderabad Call Girls Miyapur high-profile Call Girladitipandeya
 
Malad Escorts, (Pooja 09892124323), Malad Call Girls Service
Malad Escorts, (Pooja 09892124323), Malad Call Girls ServiceMalad Escorts, (Pooja 09892124323), Malad Call Girls Service
Malad Escorts, (Pooja 09892124323), Malad Call Girls ServicePooja Nehwal
 
VIP 7001035870 Find & Meet Hyderabad Call Girls Banjara Hills high-profile Ca...
VIP 7001035870 Find & Meet Hyderabad Call Girls Banjara Hills high-profile Ca...VIP 7001035870 Find & Meet Hyderabad Call Girls Banjara Hills high-profile Ca...
VIP 7001035870 Find & Meet Hyderabad Call Girls Banjara Hills high-profile Ca...aditipandeya
 
CALL ON ➥8923113531 🔝Call Girls Vineet Khand Lucknow best Night Fun service 🧦
CALL ON ➥8923113531 🔝Call Girls Vineet Khand Lucknow best Night Fun service  🧦CALL ON ➥8923113531 🔝Call Girls Vineet Khand Lucknow best Night Fun service  🧦
CALL ON ➥8923113531 🔝Call Girls Vineet Khand Lucknow best Night Fun service 🧦anilsa9823
 

Recently uploaded (20)

Falcon Invoice Discounting - Best Platform
Falcon Invoice Discounting - Best PlatformFalcon Invoice Discounting - Best Platform
Falcon Invoice Discounting - Best Platform
 
@9999965857 🫦 Sexy Desi Call Girls Karol Bagh 💓 High Profile Escorts Delhi 🫶
@9999965857 🫦 Sexy Desi Call Girls Karol Bagh 💓 High Profile Escorts Delhi 🫶@9999965857 🫦 Sexy Desi Call Girls Karol Bagh 💓 High Profile Escorts Delhi 🫶
@9999965857 🫦 Sexy Desi Call Girls Karol Bagh 💓 High Profile Escorts Delhi 🫶
 
Nicola Mining Inc. Corporate Presentation April 2024
Nicola Mining Inc. Corporate Presentation April 2024Nicola Mining Inc. Corporate Presentation April 2024
Nicola Mining Inc. Corporate Presentation April 2024
 
OKC Thunder Reveal Game 2 Playoff T Shirts
OKC Thunder Reveal Game 2 Playoff T ShirtsOKC Thunder Reveal Game 2 Playoff T Shirts
OKC Thunder Reveal Game 2 Playoff T Shirts
 
Call Girls In Vasant Kunj 📱 9999965857 🤩 Delhi 🫦 HOT AND SEXY VVIP 🍎 SERVICE
Call Girls In Vasant Kunj 📱  9999965857  🤩 Delhi 🫦 HOT AND SEXY VVIP 🍎 SERVICECall Girls In Vasant Kunj 📱  9999965857  🤩 Delhi 🫦 HOT AND SEXY VVIP 🍎 SERVICE
Call Girls In Vasant Kunj 📱 9999965857 🤩 Delhi 🫦 HOT AND SEXY VVIP 🍎 SERVICE
 
Preet Vihar (Delhi) 9953330565 Escorts, Call Girls Services
Preet Vihar (Delhi) 9953330565 Escorts, Call Girls ServicesPreet Vihar (Delhi) 9953330565 Escorts, Call Girls Services
Preet Vihar (Delhi) 9953330565 Escorts, Call Girls Services
 
VIP 7001035870 Find & Meet Hyderabad Call Girls Shamirpet high-profile Call Girl
VIP 7001035870 Find & Meet Hyderabad Call Girls Shamirpet high-profile Call GirlVIP 7001035870 Find & Meet Hyderabad Call Girls Shamirpet high-profile Call Girl
VIP 7001035870 Find & Meet Hyderabad Call Girls Shamirpet high-profile Call Girl
 
Collective Mining | Corporate Presentation - April 2024
Collective Mining | Corporate Presentation - April 2024Collective Mining | Corporate Presentation - April 2024
Collective Mining | Corporate Presentation - April 2024
 
VIP Call Girl Amritsar 7001035870 Enjoy Call Girls With Our Escorts
VIP Call Girl Amritsar 7001035870 Enjoy Call Girls With Our EscortsVIP Call Girl Amritsar 7001035870 Enjoy Call Girls With Our Escorts
VIP Call Girl Amritsar 7001035870 Enjoy Call Girls With Our Escorts
 
Osisko Gold Royalties Ltd - Corporate Presentation, April 23, 2024
Osisko Gold Royalties Ltd - Corporate Presentation, April 23, 2024Osisko Gold Royalties Ltd - Corporate Presentation, April 23, 2024
Osisko Gold Royalties Ltd - Corporate Presentation, April 23, 2024
 
VIP 7001035870 Find & Meet Hyderabad Call Girls Abids high-profile Call Girl
VIP 7001035870 Find & Meet Hyderabad Call Girls Abids high-profile Call GirlVIP 7001035870 Find & Meet Hyderabad Call Girls Abids high-profile Call Girl
VIP 7001035870 Find & Meet Hyderabad Call Girls Abids high-profile Call Girl
 
如何办理伦敦大学毕业证(文凭)London学位证书
如何办理伦敦大学毕业证(文凭)London学位证书如何办理伦敦大学毕业证(文凭)London学位证书
如何办理伦敦大学毕业证(文凭)London学位证书
 
VIP 7001035870 Find & Meet Hyderabad Call Girls Shamshabad high-profile Call ...
VIP 7001035870 Find & Meet Hyderabad Call Girls Shamshabad high-profile Call ...VIP 7001035870 Find & Meet Hyderabad Call Girls Shamshabad high-profile Call ...
VIP 7001035870 Find & Meet Hyderabad Call Girls Shamshabad high-profile Call ...
 
Call Girls In South Delhi 📱 9999965857 🤩 Delhi 🫦 HOT AND SEXY VVIP 🍎 SERVICE
Call Girls In South Delhi 📱  9999965857  🤩 Delhi 🫦 HOT AND SEXY VVIP 🍎 SERVICECall Girls In South Delhi 📱  9999965857  🤩 Delhi 🫦 HOT AND SEXY VVIP 🍎 SERVICE
Call Girls In South Delhi 📱 9999965857 🤩 Delhi 🫦 HOT AND SEXY VVIP 🍎 SERVICE
 
Methanex Investor Presentation (April 2024)
Methanex Investor Presentation (April 2024)Methanex Investor Presentation (April 2024)
Methanex Investor Presentation (April 2024)
 
Model Call Girl in Udyog Vihar Delhi reach out to us at 🔝9953056974🔝
Model Call Girl in Udyog Vihar Delhi reach out to us at 🔝9953056974🔝Model Call Girl in Udyog Vihar Delhi reach out to us at 🔝9953056974🔝
Model Call Girl in Udyog Vihar Delhi reach out to us at 🔝9953056974🔝
 
VIP 7001035870 Find & Meet Hyderabad Call Girls Miyapur high-profile Call Girl
VIP 7001035870 Find & Meet Hyderabad Call Girls Miyapur high-profile Call GirlVIP 7001035870 Find & Meet Hyderabad Call Girls Miyapur high-profile Call Girl
VIP 7001035870 Find & Meet Hyderabad Call Girls Miyapur high-profile Call Girl
 
Malad Escorts, (Pooja 09892124323), Malad Call Girls Service
Malad Escorts, (Pooja 09892124323), Malad Call Girls ServiceMalad Escorts, (Pooja 09892124323), Malad Call Girls Service
Malad Escorts, (Pooja 09892124323), Malad Call Girls Service
 
VIP 7001035870 Find & Meet Hyderabad Call Girls Banjara Hills high-profile Ca...
VIP 7001035870 Find & Meet Hyderabad Call Girls Banjara Hills high-profile Ca...VIP 7001035870 Find & Meet Hyderabad Call Girls Banjara Hills high-profile Ca...
VIP 7001035870 Find & Meet Hyderabad Call Girls Banjara Hills high-profile Ca...
 
CALL ON ➥8923113531 🔝Call Girls Vineet Khand Lucknow best Night Fun service 🧦
CALL ON ➥8923113531 🔝Call Girls Vineet Khand Lucknow best Night Fun service  🧦CALL ON ➥8923113531 🔝Call Girls Vineet Khand Lucknow best Night Fun service  🧦
CALL ON ➥8923113531 🔝Call Girls Vineet Khand Lucknow best Night Fun service 🧦
 

Computershare (CPU) initiation report - well-priced quality franchise with free upside optionality

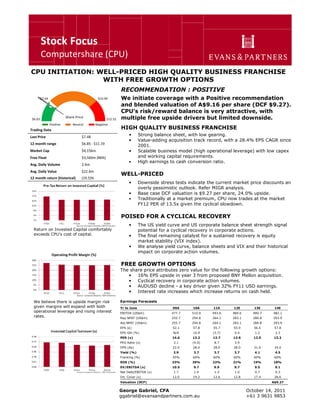
  • 1. Stock Focus Computershare (CPU) 1 CPU INITIATION: WELL-PRICED HIGH QUALITY BUSINESS FRANCHISE WITH FREE GROWTH OPTIONS . $6.03 $7.64 $10.90 $12.52 Positive Neutral Negative Share Price RECOMMENDATION : POSITIVE We initiate coverage with a Positive recommendation and blended valuation of A$9.16 per share (DCF $9.27). CPU’s risk/reward balance is very attractive, with multiple free upside drivers but limited downside. HIGH QUALITY BUSINESS FRANCHISE • Strong balance sheet, with low gearing. • Value-adding acquisition track record, with a 28.4% EPS CAGR since 2001. • Scalable business model (high operational leverage) with low capex and working capital requirements. • High earnings to cash conversion ratio. WELL-PRICED • Downside stress tests indicate the current market price discounts an overly pessimistic outlook. Refer MIGR analysis. • Base case DCF valuation is $9.27 per share, 24.0% upside. • Traditionally at a market premium, CPU now trades at the market FY12 PER of 13.5x given the cyclical slowdown. POISED FOR A CYCLICAL RECOVERY • The US yield curve and US corporate balance sheet strength signal potential for a cyclical recovery in corporate actions. • The final remaining catalyst for a sustained recovery is equity market stability (VIX index). • We analyse yield curve, balance sheets and VIX and their historical impact on corporate action volumes. FREE GROWTH OPTIONS The share price attributes zero value for the following growth options: • 16% EPS upside in year 3 from proposed BNY Mellon acquisition. • Cyclical recovery in corporate action volumes. • AUDUSD decline - a key driver given 32% FY11 USD earnings. • Interest rate increases which increase returns on cash held. Trading Data Last Price $7.48 12 month range $6.85 - $11.19 Market Cap $4,156m Free Float $3,560m (86%) Avg. Daily Volume 2.4m Avg. Daily Value $22.6m 12 month return (historical) (19.5)% Return on Invested Capital comfortably exceeds CPU’s cost of capital. We believe there is upside margin risk given margins will expand with both operational leverage and rising interest rates. Earnings Forecasts Yr to June 09A 10A 11A 12E 13E 14E EBITDA (US$m) 477.7 510.9 493.6 484.6 480.7 482.1 Rep NPAT (US$m) 255.7 294.8 264.1 283.1 286.8 293.9 Adj NPAT (US$m) 255.7 294.8 264.1 283.1 286.8 293.9 EPS (¢) 52.1 57.8 55.7 55.9 56.5 57.8 EPS Gth (%) N/A 10.9 (3.7) 0.4 1.2 2.3 PER (x) 14.6 13.2 13.7 13.6 13.5 13.2 PEG Ratio (x) 2.1 (4.0) 8.7 3.9 DPS (A¢) 22.0 28.0 28.0 28.0 31.0 34.0 Yield (%) 2.9 3.7 3.7 3.7 4.1 4.5 Franking (%) 45% 60% 60% 60% 60% 60% ROE (%) 33% 29% 22% 21% 19% 18% EV/EBITDA (x) 10.5 9.7 9.9 9.7 9.5 9.1 Net Debt/EBITDA (x) 1.7 1.4 1.3 1.0 0.7 0.3 Int. Cover (x) 12.0 19.2 12.6 12.8 17.4 26.6 Valuation (DCF) A$9.27 George Gabriel, CFA ggabriel@evansandpartners.com.au October 14, 2011 +61 3 9631 9853
  • 2. 2 1. KEY INVESTMENT CONSIDERATIONS 2. COMPANY OVERVIEW • Background • Revenue mix by geography • Revenue mix by segment 3. KEY VALUE DRIVERS AND SENSITIVITIES • Global corporate actions cycle – VIX, yield curve, balance sheet strength • Global short term interest rates and cash balance • Exchange rates 4. EARNINGS AND VALUATION SCENARIO ANALYSIS • Blended valuation • Base case • Key driver sensitivity analysis • Market implied growth rate (MIGR) analysis 5. HISTORICAL MARKET MULTIPLES • Historical share price performance • VIX and share price correlation • PE, PEG and PE relative ratios • EV/EBITDA 6. BNY MELLON ACQUISITION OVERVIEW • Acquisition track record • BNY Mellon acquisition overview • Funding • Regulatory overview • What’s in the share price? • Consensus EPS revisions 7. KEY FINANCIAL TRENDS • Earnings per share (EPS) • Dividends per share (DPS) • Capital allocation • Return on invested capital (ROIC) • Du Pont analysis • FY11 result overview 8. BALANCE SHEET AND CASHFLOW • Cashflow generation • Financial leverage • Interest cover • Asset efficiency 9. BOARD & MANAGEMENT • Overview • Register 10. KEY RISKS AND CATALYSTS
  • 3. 3 1. KEY INVESTMENT CONSIDERATIONS CPU is a well-priced quality business franchise with multiple free growth options. Well-priced • Our analysis of share price implied growth (market implied growth rate analysis) concludes that the market has discounted an overly pessimistic scenario of declining cash margin balances, declining sales volumes, and declining EBITDA margins. Our downside stress test results in a $7.64 discounted cash flow (DCF) valuation. Table 10. • Our base case DCF valuation is $9.27 per share, 24% upside to the current share price. Table 5. • Traditionally valued at a premium to the market, CPU now trades at the market PE multiple of 13.5x. Charts 11-13. Quality business franchise • High ROIC of over 12% comfortably exceeds CPU’s weighted average cost of capital. Chart 22. • Strong balance sheet, with low gearing (internal limit of 3x net debt/EBITDA) and high interest cover (12x EBIT/interest). Chart 28-29. • Value-adding acquisition track record, with a 28.4% CAGR in EPS since 2001. Chart 18. • Scalable business model (high operational leverage) with low capex and working capital requirements. Charts 30-31. • High cash conversion ratio, from 85-100%. Chart 27. Key value drivers The current share price is not factoring in earnings upside from recovery of the 3 value earnings drivers: (i) global corporate actions cycle; (ii) global short-term interest rates and the cash margin balance; and (iii) exchange rates. For this reason, we believe the current share price offers “free” growth options. Another key value driver is the proposed BNY Mellon acquisition.
  • 4. 4 Free growth option no. 1: BNY Mellon acquisition • CPU launched a friendly take-over bid for BNY Mellon on 28 April 2011. Since then, the US anti-trust authority the Department of Justice (DoJ) has been reviewing the acquisition. • BNY Mellon has identified merger synergies of US$70m % by Year 3 which appear achievable given: (i) synergies are mostly cost-out; and (ii) CPU’s strong merger integration track record. • US$70m of merger synergies (USD$2.5 post-tax) increases CPU’s EPS by approx 16.3% in Year 3. • The current share price offers a free option over the BNY Mellon acquisition. • We have not included the BNY Mellon transaction in our base case. • We have zero doubt that the equity market has not priced in any upside from the BNY Mellon acquisition because: o (i) Our downside stress test (MIGR analysis) results in a $7.64 share price (approx. the current share price), and attributes zero to BNY Mellon. o (ii) Equity analyst EPS revisions indicate initial upgrades post CPU’s bid for BNY have been unwound. Chart 17. o (iii) CPU’s share price has underperformed the market since the bid announcement. Charts 15-16. Free growth option no. 2: Cyclical recovery in corporate actions • There are three key leading indicators of a cyclical recovery in the global corporate actions cycle: o (i) US yield curve; o (ii) US corporate balance sheets; and o (iii) VIX index (proxy for equity market volatility). • Historically, a positive yield curve indicates that the M&A cycle is in its early stages. The yield curve is currently positive. Chart 5. • US corporate balance sheets are strong, with gearing at record low levels last seen in 1996. From 1996, M&A volumes increased to the cyclical peak of Jan 2000. Chart 6. • Currently, the absent condition for M&A cyclical recovery is equity market stability. History indicates that the VIX needs to stabilise before corporate action volumes commence a sustained cyclical upswing. Chart 4. Table 2. • A 1% increase in revenue growth in all segments in FY12F results in an increase in FY12EPS of 2.0% (from 55.4cps to 56.5cps).
  • 5. 5 Free growth option no. 3: AUD decline relative to USD • Valuation sensitivity to the AUDUSD is high. Every 1 cent increase in the AUDUSD (ie. AUD appreciates) decreases CPU’s valuation by 1.2% (and vice versa). Table 9. • 32% of earnings are USD denominated (Table 1) and 30% of the non-hedged cash margin balance is USD1.3bn (Chart 9). • If we assume that the AUDUSD moves to 80cps in FY15 (base case: 85 cents) and 77cps in perpetuity (base case: 85 cents), then CPU’s DCF valuation increases to $10.03. • Our base case assumes the AUDUSD declines to $0.85 by 2015F. Table 8. Many equity analysts have discounted AUDUSD of $1 parity in their model. Accordingly, there is upside if equity analysts’ valuation models downgrade AUDUSD forecasts. Free growth option no. 4: Rising interest rates and impact on cash balance • CPU’s sensitivity to short-term interest rates is via its “margin balances” ie. the cash it holds on behalf of corporate clients before dividend (or other capital) distributions. • Sensitivity to rising interest rates is not very high. Although the cash margin balance is USD10.2bn, only USD4.3bn is not hedged. Of this USD4.3bn, not all is invested in short-term money markets, so it takes time for longer-dated fixed income investments to roll off and the impact of higher short-term interest rates to flow through to the all of the unhedged USD4.3bn cash management portfolio. Table 7. • Every 10 basis points increase in cash margin balance yield increases earnings by approx. US$4.3m, up 1.6% on a base FY11 net profit of US$264.1m.
  • 6. 6 2. COMPANY OVERVIEW Background • Computershare (CPU) is a leading global provider of investor services to funds and listed companies. It manages share registers, employee equity plans, stakeholder communications, proxy solicitation and transfer agency. • Over the last decade, CPU has geographically diversified from its original Australian share registry business to a globally diversified business model. • CPU has strong market positions in Australia, United Kingdom (UK), New Zealand (NZ), Hong Kong (HK), Russia, Ireland, South Africa, India, Canada and the transfer agent space in the USA. Revenue mix by geography CPU discloses total segment revenue, EBITDA and total assets for its 6 operating segments and the Tech Services cost centre. Geographic revenue mix (by declining contribution) is: (i) United States of America (32.4% of FY11 revenue). (ii) Australia and New Zealand (22.6% of FY11 revenue). (iii) United Kingdom, Channel Islands, Ireland and Africa (UCIA) (18.8% of FY11 revenue). (iv) Canada (12.7% FY11 revenue). (v) Asia comprising India, Hong Kong, China, Singapore and Japan (7.8% FY11 revenue). (vi) Continental Europe comprising Germany, Russia and other European countries (5.7% FY11 revenue). (vii) Technology Services is a research and development function providing software specialising in share registry, employee plans and financial services. TABLE 1: REVENUE BY SEGMENT AND GEOGRPAHY US$m Aust & NZ Asia UCIA Cont Europe USA Canada Total Business mix Register Maintenance 145.6 51.4 104.7 49.8 262.2 84.8 698.5 43% Corporate Actions 47.5 34.7 22.7 4.0 45.6 25.1 179.6 11% Business Services 3.4 30.8 66.8 1.9 91.2 71.9 266.0 16% Stakeholder R/ship Mgt 6.1 3.7 11.0 12.6 60.5 3.1 97.0 6% Employee Share Plans 19.3 4.3 85.9 1.2 31.4 15.6 157.7 10% Communication Services 131.4 0.0 4.3 17.6 15.5 3.5 172.3 11% Tech & other 12.0 0.8 8.6 5.3 18.3 2.3 47.3 3% Totals 365.3 125.7 304.0 92.4 524.7 206.3 1618.4 100% Geographic mix 23% 8% 19% 6% 32% 13% 100% Source: CPU Reports
  • 7. 7 CHART 1: GEOGRAPHIC REVENUE MIX CHART 2: SEGMENTAL REVENUE MIX US$m US$m Aust & NZ, $365.3 , 23% Asia, $125.7 , 8% UCIA, $304.0 , 19%Cont Europe, $92.4 , 6% USA, $524.7 , 32% Canada, $206.3 , 13% Reg. Maint, $698.5, 43% Corp. Actions, $179.6, 11% Bus. Services, $266.0, 16% Stake holder R/ship, $97.0, 6% Employee Share Plans, $157.7, 10% Comm. Services, $172.3, 11% Tech & other, $47.3, 3% Source: CPU Reports Revenue mix by segment CPU defines its core competencies as record keeping, communication and transfer agency. In each of its 6 geographic segments, CPU offers the following core products: • Investor Services – comprising o (i) Register Maintenance (43.2% of FY11 revenue); and o (ii) Corporate Actions (11.1% of FY11 revenue) including company meeting logistics, payments and full contact centre and online services. • (iii) Business Services (16.4% of FY11 revenue) comprise the provision of voucher administration, bankruptcy administration services, interactive meeting services, corporate trust services and other ancillary services. Refer “Base Case” section below for more details. • Plan Services – comprise the administration and management of: o (iv) Communication Services (10.6% FY11 revenue), which provide laser imaging, intelligent mailing, scanning and electronic communications delivery. o (v) Employee Share and Option Plans (9.7% FY11 revenue). • (vi) Stakeholder Relationship Management Services (6.0% of FY11 revenue) comprise the provision of investor analysis, investor communication and management information services to companies, shareholders and other capital markets participants. Business segment revenues comprise 3 categories: • Annuity-type revenues comprising 63.5% of FY11 revenue (Register Maintenance, Employee Share and Option Plans and Communication Services). • Transactional revenues comprising 17.1% of revenue (Corporate Actions and Stakeholder Relationship Management). • General Business Services comprising 16.4% of revenue.
  • 8. 8 CHART 3: FY11 REVENUE BY SEGMENT AND GEOGRPAHY
  • 9. 9 3. KEY VALUE DRIVERS AND SENSITIVITIES CPU’s three key value drivers are: (i) Global corporate actions cycle; (ii) Global short-term interest rates and the cash margin balance; and (iii) Exchange rates. Global corporate actions cycle Corporate actions include mergers and acquisitions, IPOs and capital management activity (eg. buybacks, secondary raisings etc.). Corporate actions are driven by a range of macroeconomic variables. We analyse below the following 3 drivers of corporate actions: (i) equity market volatility; (ii) US yield curve; and (iii) US corporate balance sheet strength. We conclude that the US yield curve and US corporate balance sheet strength signal potential for a sustained cyclical upswing in corporate M&A volumes –equity market stability (as measured by VIX) remains a key precondition for corporate action recovery. Key points are: • The current positive US yield curve satisfies one key precondition for a cyclical recovery in M&A volumes. • US non-financial corporate debt to net cash flow is less than 4x, an indicator of financial flexibility to fund acquisitions. • However, VIX needs to sustainably decline below 30% for M&A activity to increase. Equity market volatility (VIX) At the time of writing, VIX is >35%. The VIX is a proxy measure of equity market volatility. (Technically, it measures the implied volatility of S&P 500 index options. VIX is quoted in percentage points and translates to the expected annualised movement in the S&P 500 index over the next 30-day period). We have analysed the historical relationship between VIX and M&A volumes. Chart 4. Table 2. • Rising VIX off a low base tends not to have a material impact on M&A activity until the VIX nears 30%. Point 1, 8. • Where VIX > 30%, M&A subsequently declines materially. Points 1,3,5,7,9,11. • M&A recovers quickly after VIX falls below 30% from a peak. Points 1-2, 3-4, 11-12. • Longer periods of high volatility (>30% VIX) results in prolonged periods of M&A weakness. Points 5-7 & 9-12. • Extended periods of stability and/or falling VIX provide the conditions for a material cyclical upswing in M&A activity. Point 7-8.
  • 10. 10 CHART 4: GLOBAL M&A vs VIX TABLE 2: GLOBAL M&A vs VIX Point Date VIX Movement^ VIX change Months for recovery (1) Global M&A Activity* 1-2 Nov 1997 – Mar 1998 Peak 31.9% - Trough 20.3% -11.6% 1 month +40% 3-4 Sep 1998 – Aug 2000 Peak 38.5% - Trough 18.0% -20.5% 1 month +67% 5-6 Sep 2001 – Mar 2002 Peak 35.5% - Trough 18.9% -16.6% >1 yr - 40% 7-8 Sep 2002 – Oct 2006 Peak 37.4% - Trough 11.3% -26.1% 1 month +408% 8-9 Oct 2006 - Nov 2008 Trough 11.3% - Peak 63.4% +52.1% -44% 9-10 Nov 2008 – Apr 2010 Peak 63.4% - Trough 17.6% -45.8% >1 yr -37% 11-12 May 2010 – Jan 2011 Peak 32.7% - Trough 17.3% -15.4% 1 month +55% Source: Datastream, E&P estimates Notes: ^measured as month average *measured as the average of M&A activity for the 5 month period around the final data point (2 mths before, 2 mths after) (1) Months for recovery: we observe how many months after VIX rebases to the downside before M&A volumes improve. US yield curve The slope of the US yield curve (10 year government bond yield less 90 day bank bill rate) is an indicator of cyclical economic peaks (when positively sloped) or downturns (when negatively sloped or flat). Chart 5 illustrates that: • A negative (inverted) yield curve indicates the peak of the M&A cycle. • A positive yield curve indicates the M&A cycle is in its early stages. But once the short end of the yield curve increases and the yield curve flattens, the rising cost of debt drives s a slowdown in M&A volumes. The current positive yield is a key precondition to recovery in global corporate action volumes.
  • 11. 11 CHART 5: GLOBAL M&A vs SLOPE OF THE US YIELD CURVE -1.0 0.0 1.0 2.0 3.0 4.00 100 200 300 400 500 600 Jan-96 Jan-98 Jan-00 Jan-02 Jan-04 Jan-06 Jan-08 Jan-10 Global M&A announced ($bn) (LHS) Inverted Slope of US Yield curve (%)* (RHS) Source: Datastream *Slope of US Yield curve = 10 Yr Yieldless 90 day bill rate US corporate balance sheet strength Currently, US corporate balance sheet strength is as strong as it has been for the last 20 years. Non-financial corporate debt to net cash flow is less than 4x, implying financial flexibility to fund acquisitions. CHART 6: US NON-FINANCIAL CORPORATE DEBT TO NET CASH FLOW 3.5x 4.0x 4.5x 5.0x 5.5x 6.0x 1990 1992 1994 1996 1998 2000 2002 2004 2006 2008 2010 Source : US Commerce Dept
  • 12. 12 Global short-term interest rates and cash margin balance CPU typically retains the interest generated on cash deposits held in trust for corporate clients prior to distribution to corporates’ shareholders (for dividends, takeovers etc). This cash “margin balance” is currently US$10.2bn. The yield on this margin balance has declined as global short term interest rates have declined. Chart 7. We analyse this further in “Key driver sensitivity analysis” below. CHART 7: FUND BALANCE & MARGIN INCOME 0.0% 0.5% 1.0% 1.5% 2.0% 2.5% 3.0% 0.0 2.0 4.0 6.0 8.0 10.0 12.0 1H06 2H06 1H07 2H07 1H08 2H08 1H09 2H09 1H10 2H10 1H11 2H11 Fund Balance (LHS) Margin Yield (RHS) US$bn Source:CPU Reports Exchange rates CPU does not employ any currency hedging. Table 1 details revenue mix by currency and business segment. Table 3 below summarises the exchange rate exposures. AUDUSD is the largest exposure by revenue contribution (32.4% FY11 total revenue). We analyse exchange rates in further detail in “Key driver sensitivity analysis” below. TABLE 3: REVENUE MIX BY REGION Currency % FY11 total revenue FY11 revenue (US$m) USA 32.4% 519.8 Australia and New Zealand 22.6% 362.6 United Kingdom, Channel Islands, Ireland and Africa (UCIA) 18.8% 301.6 Canada 12.7% 203.7 Asia 7.8% 125.1 Continental Europe 5.7% 91.4 Total 100.0% 1604.2 Source: CPU reports
  • 13. 13 4. EARNINGS AND VALUATION SCENARIO ANALYSIS Blended valuation Our blended valuation is $9.16 per share. Table 4. TABLE 4: BLENDED VALUATION Base case Our discounted cash flow (DCF) valuation base case valuation is A$9.27 per share. Our assumptions are summarised in Tables 6 and 7. Our DCF model is structured as follows: • Modelled explicitly by geographic region because CPU only discloses EBITDA by region. • Within each region, we model revenue by business segment within each country. • EBITDA for each country is estimated using the region margin. We assume FY11F EBITDA margin for all business segments is carried forward. Our key base case assumptions are: • No inclusion of BNY Mellon in any way. • Exchange rates. o We convert all currencies to US$ based on EAP house forecasts and/or rates implied by currency futures markets. Table 6. • Interest rates. Table 6. o Forecasts are based on futures market expectations. • Revenue growth rate. Tables 4, 6. o Determining an appropriate cross-cycle rate of revenue growth is challenging because revenue growth has historically been driven by acquisitions. We believe reasonable organic revenue growth benchmarks are the 1.8% in 2002 and 2.1% in 2003, when acquisition rates were much lower. Accordingly, our long-term organic revenue growth assumption is 2%. Table 6. o We divide CPU’s segments into annuity-type or transactional revenues and apply different growth rates for each. o Annuity segments – 2% growth in perpetuity. o Transactional segments – 1% growth in FY12F and FY13, then 2% growth in perpetuity. • EBITDA margin declines to 30.3% in FY12F and then recovers to 31.4% long-term rate by FY16F. We believe there is upside margin risk given margins will expand with both operational leverage and rising interest rates.
  • 14. 14 TABLE 5: REVENUE GROWTH Date Revenue (US$m) Growth 2001 388.8 2002 395.9 1.8% 2003 404.1 2.1% 2004 619.2 53.2% 2005 795.7 28.5% 2006 1198.8 50.7% 2007 1404.2 17.1% 2008 1564 11.4% 2009 1495.8 -4.4% 2010 1599.6 6.9% 2011 1598.9 0.0% Source: CPU Reports TABLE 6: Base case valuation assumptions TABLE 7: Base case sales growth assumptions
  • 15. 15 Our base case has been conservative in assuming that Business Services is transactional. In reality, it encompasses a mixed range of businesses with different revenue characteristics: • Computershare Voucher Services (CVS) – annuity type. CVS is the largest dedicated childcare voucher provider in the UK for companies across sectors and industries. Each month around 100,000 working parents request Childcare Vouchers through more than 12,000 organisations. • Deposit Protection Service (DPS) management – annuity type. DPS manages trust money on behalf of landlords and The Letting Protection Service. • Funds Services– annuity type with markets cyclicality. This is a fully outsourced managed funds administration service, including unit registry, investment administration, fund accounting and regulatory reporting. • IML – transactional. Established in the UK, IML manufactures the “Communicator” - a sophisticated wireless keypad for audience participation and voting. • Kurtzman Carson Consultants LLC (KCC) – transactional. KCC is a premier provider of administrative support services for legal and finance professionals. KCC offers an integrated suite of corporate restructuring, class action and legal document support solutions based on industry expertise and proprietary technologies. Key driver sensitivity analysis Corporate actions volumes CPU is leveraged to corporate action volume through the transactional style revenues of Corporate Actions, Business Services and Stakeholder Relationship Management (33.5% of FY11 revenue). A 1% increase in revenue growth in all segments in FY12F only (relative to our base case in Table 6) results in a DCF valuation of $9.38 (up 11cps). A 1% increase in revenue growth in all segments in FY12F results in an increase in FY12F EPS of 2.0% (from 55.4cps to 56.5cps). Interest rates and cash margin balances CPU’s sensitivity to interest rates is via its “margin balances” ie. the cash it holds on behalf of corporate clients before dividend (or other capital) distributions. The key sensitivity to interest rates is through the unhedged US$4.3bn (42%) of CPU’s margin balance. Every 10 basis points increase in margin balance yield translates to US$4.3m of additional earnings, up 1.6% on a base of FY11 net profit of US$264.1m. We reach the same conclusion through our valuation model – by increasing all margin balance interest rates by 10bp, the DCF valuation only increases 1.8%. Table 9. CPU’s average FY11 margin balance was US$10.2bn, on which it earnt US$171.5m, or 35% of FY11 EBITDA of US$493.6m. Of the US$10.2bn average margin balance held at year end FY11:
  • 16. 16 • 42% or US4.3bn is unhedged. • 28% or US$2.8bn is naturally not exposed to interest rates either through not earning margin income or receiving a fixed spread on these funds. • 22% or US$2.2bn is hedged directly. • 8% of US$0.9bn enjoys a natural hedge against CPU’s own floating rate debt. Table 8. The global trend in short term interest rates and the overall yield on the margin balance have been in decline since Jan 08. Charts 7-8. The margin balance yield peaked at 2.59% in FY07, then fell to 1.68% in FY11. We forecast the yield will decline to 1.37% in FY12F and continue its decline to 1.17% in FY14F as higher priced cash yields from earlier periods run-off and are replaced with lower spot rates. We forecast the yield will eventually increase to 1.5% by FY17F as interest rates increase over time. CHART 8: 90 day bill rates 0.0 1.0 2.0 3.0 4.0 5.0 6.0 7.0 8.0 Jan-06 Jan-07 Jan-08 Jan-09 Jan-10 Jan-11 US UK Canada Australia Source: Datastream TABLE 8: INTEREST RATE EXPOSURE ON FUND BALANCE Total client funds % total US$bn equivalent US$bn 28% 2.8 No exposure to interest rates 2.8 Subtotal: no exposure to interest rates 22% 2.3 Effective hedging in place 8% 0.9 Naturally hedged against CPU's floating rate debt 42% 4.3 Non-hedged exposed funds 7.4 Subtotal: average exposed funds prior to hedging 101% 10.2 10.2 Total average client funds held in FY11 Source: p19 FY11 investor presentation
  • 17. 17 CHART 9: NON-HEDGED EXPOSED FUNDS US$b,% GBP, $1.7, 40% USD, $1.3, 30% Other, $0.6, 14% AUD, $0.1, 2% CAD, $0.6, 14% Source: CPU Reports TABLE 9: INTEREST RATE SENSITIVITY Source: E&P estimates Exchange rates CPU does not hedge currency exposures. Highest sensitivity is to AUDUSD cross-rate. • 32.4% of FY11 revenue is USD denominated (ie. US$520M). Table 1. • Table 10 shows that for every 1cps increase in the AUDUSD, CPU’s DCF valuation decreases by 1.2% (and vice versa). TABLE 10: CURRENCY SENSITIVITY Cross Rate Sensitivity¹ DCF Valuation Impact AUD/USD +/- 1c -1.2% / 1.2% GBP/USD +/- 1p 0.1% / -0.1% CAD/USD +/- 1c 0.2% / -0.2% EUR/USD +/- 1c 0.0% / 0.0% Source: E&P estimates. ¹Our sensitivity calculates the DCF valuation impact when we add (subtract) 1c (or 1p) to our base case assumption for the exchange rate in each financial year. • Our base case assumes the AUDUSD declines to $0.85 by 2015F. Table 8. Many equity analysts have discounted AUDUSD of $1 parity in their model. Accordingly, there is upside if equity analysts’ valuation models downgrade AUDUSD forecasts.
  • 18. 18 • Assuming the AUDUSD moves to 80cps in FY15 and 77cps in perpetuity thereafter (EAP house view, but not our base case), then CPU’s DCF valuation rises to $10.03, highlighting the high sensitivity to the AUDUSD. • GBP/USD: CPU’s third largest exposure, with ~15% of revenues (and 40% of margin fund balance, or GBP1.7bn) coming from the UK. • CAD/USD: ~13% of revenues are Canadian denominated. • EURO/USD: Translation of earnings largely from Germany and Ireland have minimal impact, accounting for ~4% of revenues. Market implied growth rates (MIGR) analysis Table 11 summarises the key assumptions which generate a $7.64 share price valuation. Our MIGR analysis also assumes revenue growth in each segment of -2% in FY12F and -2% in FY13F, followed by 1% growth in perpetuity. MIGR analysis clearly indicates that the current share price is discounting an overly pessimistic scenario, extrapolating forward for two years EBITDA margin decline, margin balance FUM loss, no increase in interest rates and negative volume growth in FY12F and FY13F. Given this analysis, we conclude that the current share price does not factor in any of the 4 growth options listed at the start of this report. TABLE 11: MARKET IMPLIED GROWTH RATE
  • 19. 19 5. HISTORICAL VALUATION MULTIPLES Historical share price performance CPU outperformed the market following the Global Financial Crisis, with clear outperformance evident from the GFC bottom of Mar 09, driven partly by recapitalisations. However, as the global equity outlook worsened, CPU has lost all of its relative outperformance to now trade in line with the market. CHART 9: HISTORICAL SHARE PRICE PERFORMANCE 4.00 5.00 6.00 7.00 8.00 9.00 10.00 11.00 12.00 13.00 14.00 Sep-08 Dec-08 Mar-09 Jun-09 Sep-09 Dec-09 Mar-10 Jun-10 Sep-10 Dec-10 Mar-11 Jun-11 Sep-11 CPU Share Price ASX200 Relative Performance Source: IRESS VIX and share price correlation VIX is the Chicago Board Options Exchange Market Volatility Index, a popular measure of the implied volatility of the S&P 500 index options. It represents one measure of the market’s expectations of stock market volatility over the next 30 days. The VIX is quoted in percentage points and translates approx. to the expected movement in the S&P 500 index over the next 30 days. Historically, CPU’s share price has rallied in two circumstances: • Stable VIX. VIX stability from April 2003 to June 07 allowed CPU to rally through this period. • Sharp VIX decline. As VIX declined from 70% in October 08 to 16% in April 2010, CPU rallied sharply also. Chart 10.
  • 20. 20 CHART 10: CPU SHARE PRICE V VIX -10% 0% 10% 20% 30% 40% 50% 60% 70%0 2 4 6 8 10 12 14 Sep-95 Sep-97 Sep-99 Sep-01 Sep-03 Sep-05 Sep-07 Sep-09 CPU Share Price (LHS) VIX Inverted (RHS) Source: Bloomberg PE, PEG and PE relative ratios CPU traded at a large premium to the market during the dot-com period approaching May 2000, but has since traded broadly in line with market multiples. Charts 11-12. CPU’s PEG ratio of 1.27x (12mth forward PE to average of two year EPS growth rate) is below its five year average of 1.44x. The PEG ratio (consensus forecasts) is elevated by a flat FY12F EPS outlook (FY12F 55.8cps vs 55.7cps), followed by growth to 63.9cps. Chart 13. CHART 11: PE RELATIVE TO THE MARKET 0.0x 1.0x 2.0x 3.0x 4.0x 5.0x May-97 May-99 May-01 May-03 May-05 May-07 May-09 May-11 Computerhare PER vs ASX 200 Non-Bank Industrials Source: Bloomberg
  • 21. 21 CHART 12: PE SINCE JAN 02 5 10 15 20 25 30 35 Jan-02 Jan-03 Jan-04 Jan-05 Jan-06 Jan-07 Jan-08 Jan-09 Jan-10 Jan-11 CPU PER Average PER +/- 1 Standard Deviation Source: Bloomberg CHART 13: PEG RATIO 0.00 0.50 1.00 1.50 2.00 2.50 3.00 FY05 FY06 FY07 FY08 FY09 FY10 FY11 Current Source: Bloomberg 12mth Forward PE Ratio/Average 2Yr EPS Growth EV/EBITDA EV/EBITDA multiple has de-rated to approx. 12-13x. CHART 14: EV/EBITDA multiple
  • 22. 22 6. BNY MELLON ACQUISITION OVERVIEW Acquisition track record CPU has demonstrated a long track record of extracting value from its multiple acquisitions over the last decade, evidenced in its positive ROIC and EPS trends .CPU’s track record is driven by: (i) Focus on cost reduction via systems integration without impacting revenues; (ii) Requirements that acquisitions fit within core competencies; and (iii) Limiting acquisition pricing to not more than 5x EV/EBITDA. BNY Mellon acquisition overview CPU announced a bid for BNY Mellon on 28 April 2011. The fundamentals of the acquisition are attractive given: • Stated synergy target of US$70m p.a. by year three. There is no break-down of the synergies over each of the three years. • EPS accretive (per management) from year one following the acquisition. • In our view, there is a high probability of synergies being realised given CPU’s track record and focus on cost-out out (technology, premises, shared service integration). • US$70m of merger synergies (USD$2.5 post-tax) increases CPU’s EPS by approx 16.3% in Year 3. Funding The BNY Mellon transaction will be funded with all cash from existing cash resources and new credit lines. Key financial elements are: • US$550m business value. • CPU has US$347.2m cash as at 30 June 11, implying a debt requirement of US$202.8m. • FY11 EBITDA of US$493.6m. • Total FY11 debt of US$1,013m, or 2.05x EBITDA. • Total post-acquisition debt of 2.46x, which is within CPU’s total debt/EBITDA ceiling of 2.5x. Regulatory overview The US anti-trust body (Department of Justice) has been reviewing the acquisition to assess whether it is anti-competitive. The DOJ has (i) requested further information from CPU; (ii) already exceeded the usual time for merger decision-making, and (iii) given no guidance on decision timing. We would expect an update from CPU at its AGM. Key considerations which support the prospects of DOJ approval are: • At the time of the announcement, CPU management was confident of merger approval based on its clear legal advice.
  • 23. 23 • The DOJ assessed and ultimately approved the merger between BNY and Mellon. Sullivan Cromwell lawyers advised BNY on that merger and is also advising CPU on the BNY Mellon acquisition. • US transaction agent business has had high price competition, with Wells Fargo winning the transfer agent contracts of Hewlett Packard and Comcast (top 40 stocks by market cap) in the last 12 months. • American Stock Transfer has competed aggressively for recent IPOs, securing up to one third of IPOs in the last year. What’s in the share price? Share price trading since the 28 April 2011 announcement of the bid for BNY Mellon indicates that the market is not pricing in any benefit from the proposed BNY Mellon acquisition. Chart 15 shows a one day increase of 7.7%, which was thereafter progressively unwound. In fact, Chart 16 shows that CPU has underperformed the market from 29 April 2011 onwards, indicating that not only has the synergy benefit of BNY Mellon been unwound, but the market is pricing in slower growth for CPU. CHART 15: SHARE PRICE PERFORMANCE FROM 28 April 6.50 7.00 7.50 8.00 8.50 9.00 9.50 10.00 27-Apr 11-May 25-May 08-Jun 22-Jun 06-Jul 20-Jul 03-Aug 17-Aug 31-Aug 14-Sep 28-Sep Pre BNY Mellon Announcement: 28th April CPU Share Price ASX200 Relative Performance Source: IRESS CHART 16: SHARE PRICE FROM 29 April 6.50 7.00 7.50 8.00 8.50 9.00 9.50 10.00 27-Apr 11-May 25-May 08-Jun 22-Jun 06-Jul 20-Jul 03-Aug 17-Aug 31-Aug 14-Sep 28-Sep Post BNY Mellon Announcement: 29th April CPU Share Price ASX200 Relative Performance Source: IRESS
  • 24. 24 Consensus EPS revision cycle Consensus EPS revisions support our conclusion that synergies from the BNY Mellon acquisition are not currently factored into the CPU share price. Analysts upgraded CPU around the 29 April announcement of the CPU bid, but have since progressively downgraded CPU to the point where its EPS forecasts are now below their level prior to the BNY Mellon bid. Chart 17. CHART 17: EPS REVISIONS 7. KEY FINANCIAL TRENDS Earnings per share (EPS) trends EPS has increased from US3.9 cents in FY01 to US47.5 cents in FY11, a CAGR of 28.4% p.a. driven by both the tailwind of a positive equity cycle and also CPU’s success in acquiring and integrating businesses. EPS declined in FY09, driven by: • A stronger AUD/USD. • Lower interest rates. Charts 7-8. • Lower volumes, evident in lower asset turnover (from 0.81x cyclical peak in FY07 to 0.6x in FY09 and a recent low of 0.54x in FY11). Chart 24. • Lower leverage, from 2.91x peak in FY08 to 2.77x in FY09 and 2.36x in FY11. • Lower NPAT profit margins, down from an FY08 peak of 18.0% to 16.5% in FY11.
  • 25. 25 CHART 18: EARNINGS PER SHARE TRENDS -20% 0% 20% 40% 60% 80% 100% 120% 140% -20.0 -10.0 0.0 10.0 20.0 30.0 40.0 50.0 60.0 FY01 FY02 FY03 FY04 FY05 FY06 FY07 FY08 FY09 FY10 FY11 EPS (US cents) (LHS) EPS Growth (RHS) Source: CPUreports Dividend per share (DPS) trends DPS has increased from US1.0 cents in FY01 to US28.0 cents in FY11, a CAGR of 39.5% p.a. The absolute value of dividend per share has not been cut once over the last 10 years, although the payout ratio increased in FY03 to maintain this trend as earnings declined. CHART 19: DIVIDEND PER SHARE TRENDS 0% 10% 20% 30% 40% 50% 60% 70% 80% 90% 100% 0.0 5.0 10.0 15.0 20.0 25.0 30.0 FY01 FY02 FY03 FY04 FY05 FY06 FY07 FY08 FY09 FY10 FY11 DPS (LHS) DPS Growth (RHS) Source: CPUreports A cents CHART 20: PAYOUT RATIO 0% 10% 20% 30% 40% 50% 60% 70% 80% 90% FY01 FY02 FY03 FY04 FY05 FY06 FY07 FY08 FY09 FY10 FY11 Source: CPUreports, E&P Estimates
  • 26. 26 Capital allocation CPU has maintained a balanced approach to capital allocation over time, with capital allocated between buybacks, acquisitions and dividends. Chart 21. Capital management guidelines are: • Capital management is considered when total debt/EBITDA approaches 1x. • Will leverage up to 2.5x total debt/EBITDA and could consider 3x if there is a clear subsequent de-leveraging strategy. • Prefers share buybacks over special dividends given less than 20% of its earnings are Australian-domiciled and franking is generally at 60%. • Still considers itself to be in a growth phase and so its dividend payout ratio will likely remain at around the historical level of approx. 40%. • Acquisition targets must leverage CPU’s core competencies of record keeping, communication and transfer agency. Pricing is at a ceiling of 5x post-integration EBITDA. CHART 21: CAPITAL ALLOCATION -200 0 200 400 600 800 FY01 FY02 FY03 FY04 FY05 FY06 FY07 FY08 FY09 FY10 FY11 Net M&A Net buybacks Dividends Source: CPU reports $USm Return on invested capital (ROIC) ROIC is a good measure of the profitability of the firm’s asset base and the soundness of management’s capital allocation decisions. It has increased steadily through CPU’s most acquisitive periods leading up to FY07 and recently declined in line with lower financial leverage, lower asset turnover and lower margins. Chart 21. Returns have increased steadily from 6% in FY01 to over 12% in FY11, comfortably exceeding CPU’s weighted average cost of capital of approx. 10.5%.
  • 27. 27 CHART 22: POST-TAX RETURN ON INVESTED CAPITAL 0.0% 4.0% 8.0% 12.0% 16.0% 20.0% FY01 FY02 FY03 FY04 FY05 FY06 FY07 FY08 FY09 FY10 FY11 Source: CPU reports Note: ROIC is defined as operating profits after tax divided by invested capital (debt+equity). Du Pont analysis Du Pont analysis decomposes return on capital into profit margin, asset turnover and equity multiplier to identify key drivers of returns on equity (ROE). ROE = operating efficiency (net profit/sales) X asset efficiency (sales/assets) X financial leverage (assets/equity) ROE peaked at 36.6% in FY08 in line with the peak of the equity markets and has declined since then to 21.2%. TABLE 12: DU PONT ANALYSIS
  • 28. 28 CHART 23: NPAT MARGIN CHART 24: ASSET TURNOVER 0.0x 0.1x 0.2x 0.3x 0.4x 0.5x 0.6x 0.7x 0.8x 0.9x FY01 FY02 FY03 FY04 FY05 FY06 FY07 FY08 FY09 FY10 FY11 Source: CPU reports CHART 25: FINANCIAL LEVERAGE CHART 26: TOTAL DEBT/EBITDA 0.0x 0.5x 1.0x 1.5x 2.0x 2.5x 3.0x 3.5x FY01 FY02 FY03 FY04 FY05 FY06 FY07 FY08 FY09 FY10 FY11 Source: CPU reports 0.0x 0.5x 1.0x 1.5x 2.0x 2.5x 3.0x 3.5x 4.0x 4.5x FY01 FY02 FY03 FY04 FY05 FY06 FY07 FY08 FY09 FY10 FY11 Source: CPU Reports FY11 result overview Key elements of the FY11 results were: • Revenue down 0.1% to US$1,618.6m. Recurring revenue lines held up well while transactional revenue was under pressure. • NPAT US$264.1m, down 10.4% on pcp, • EBITDA margins down 100 bps to 30.5%. • Growth in client balance levels drove strong margin income outcome. Chart 7. • Management EPS of US55.7cps, down 3.7% on pcp. • Final dividend of AUD14cps unchanged, franked at 60%. United States (Revenue US$508.8m, EBITDA Margin 24.5%) • US revenues -14% and EBITDA -12.8% vs FY10, driven by a reduction in mutual fund proxy solicitation and bankruptcy administration activities • Remains the largest contributor to group earnings. • Improved cost management offset declining margin income from lower interest rates, with EBITDA margins settling at 24.5%, up from 24.2% in FY10. • Outlook driven by US economic outlook.
  • 29. 29 Australia & NZ (Revenue US$353.3m, EBITDA Margin 24.7%) • Revenue down in local currency - Australia (-5.9%) and New Zealand (-6.4%), but higher in USD terms. • Despite a meaningful pickup in 2H, corporate action levels were down significantly: Australia -30% and New Zealand -15% in local currency. • EBITDA margins down 49 basis points to 24.7%. UCIA (Revenue US$287.9m, EBITDA Margin 40.4%) • UK revenues +8% and EBITDA +2% in local currency. • Growth underpinned by full year contribution of HBOS EES business acquired in January 2010; UK based employee share plans provider. • Voucher services (administration of Childcare Vouchers) and the deposit protection scheme (Government-authorised landlord and letting agent deposit service) in the UK also contributing positively. • Irish business flat for the year whilst South African Business was marginally down. Canada (Revenue US$203.2m, EBITDA Margin 46.2%) • CPU’s highest margin segment. • Margin balances benefited from an increase in interest rates. • Total revenues +7.5% on FY10. • Weakness in corporate actions market for a second year running. Asia (Revenue US$124.2m, EBITDA Margin 38.9%) • India competitive while Hong Kong IPO market remains strong. • HK revenues up ~11% in local currency. Corporate actions growth remains key driver of HK revenue growth. • India revenues down -1% in local currency, up 2.2% in US$. Continental Europe (Revenue US$95m, EBITDA Margin 14.8%) • Revenue growth of 26.9% off a low base. • Growth coming from consolidation of Registrar Nikoil in Russia and acquisition of Servizio Titoli in Italy. • German business saw revenue growth but a drop off in earnings due to a much quieter meetings season. • FY12F Guidance • CPU did not provide FY12F guidance given market volatility at the time. However, it will most likely provide guidance at the 9 Nov AGM. • Historically, revenue from other transaction lines following volatile periods have replaced IPO and M&A income. But it is unclear whether that is the case this time.
  • 30. 30 8. BALANCE SHEET AND CASH FLOW Cashflow generation CPU’s high translation of accounting-based EBITDA to operating fee cashflow is one indication of high quality earnings. Chart 27. CHART 27: CASH CONVERSION RATIO 0% 20% 40% 60% 80% 100% 120% 140% FY02 FY03 FY04 FY05 FY06 FY07 FY08 FY09 FY10 FY11 Source: CPU reports Gross Operating Cashflow / EBITDA Financial leverage CPU manages financial leverage within a number of clear parameters: • Capital management is considered when total debt/EBITDA falls towards 1x. • Up to 2.5x total debt/EBITDA is considered the ceiling. • Total debt/EBITDA of 3x is temporarily acceptable if there is a clear subsequent de- leveraging strategy. The proposed BNY Mellon acquisition will be cash/debt funded and result in debt/EBITDA of less than 2.5x. CHART 28: NET DEBT TO EBITDA 0.0x 0.5x 1.0x 1.5x 2.0x 2.5x 3.0x FY01 FY02 FY03 FY04 FY05 FY06 FY07 FY08 FY09 FY10 FY11 Source: CPU reports
  • 31. 31 Interest cover Interest is comfortably covered at over 12x. CHART 29: INTEREST COVER 0.0x 3.0x 6.0x 9.0x 12.0x 15.0x 18.0x 21.0x FY01 FY02 FY03 FY04 FY05 FY06 FY07 FY08 FY09 FY10 FY11 Source: CPU reports Interest cover = EBIT/Interest costs Asset efficiency Asset efficiency encompasses capex (Chart 30), working capital (Chart 31) management and asset turnover (Chart 24). Capex/sales is in steady decline, driven by economies of scale. Working capital is aided by the “free float” of the cash retained by CPU when administering (dividend and other) payments on behalf of corporate clients. This relatively asset-light combination indicates that CPU is organically scalable without the need for working capital expansion funding. CHART 30: CAPEX/SALES CHART 31: WORKING CAPITAL/SALES 0.0% 1.0% 2.0% 3.0% 4.0% 5.0% 6.0% 7.0% 8.0% FY01 FY02 FY03 FY04 FY05 FY06 FY07 FY08 FY09 FY10 FY11 Source: CPU reports 0% 5% 10% 15% 20% 25% 30% FY01 FY02 FY03 FY04 FY05 FY06 FY07 FY08 FY09 FY10 FY11 Source: CPU reports
  • 32. 32 9. BOARD AND MANAGEMENT Overview Joint founder Christopher Morris remains Chairman after relinquishing executive responsibilities held since listing in 1994. Co-founder, Tony Wales, resigned as a director in 2010, and retains a 5% interest in CPU. Stuart Crosby, who has been with CPU for 12 years, was appointed CEO in 2006. Previously, Stuart was National Head of Listings at the ASX and held senior roles with the Hong Kong Securities and Futures Commission before joining Computershare in 1999. Below CEO, non-executive directors and senior management show broad experience within Computershare and in financial services generally. TABLE 13: INSIDER EQUITY INTERESTS Director Role Since Background Shares Options^ Christopher Morris Chairman 2006 Business Founder 46.0 - 8.3% Stuart Crosby CEO/Managing Director 2006 ASX, HKSFC 0.6 1.2 0.3% Penelope Maclagan Non-Executive Director 1995 Joined CPU in 1983 14.7 - 2.7% Markus Kerber Non-Executive Director 2004 Deutsche Bank, Warburg & Co, German Treasury 0.0 - 0.0% Simon Jones Non-Executive Director 2005 N.M. Rothschild & Sons, Arthur Andersen 0.0 - 0.0% Les Owen Non-Executive Director 2007 AXA, Fed Treasurer's Fin. Sector Advisory Council 0.0 - 0.0% Nerolie Withnall Non-Executive Director 2008 Minter Ellison, QM Technologies - - Jerry Lieberman Non-Executive Director 2010 AllianceBernstein, Fidelity, Citicorp 0.0 - 0.0% Total 61.4 1.2 11.3% ^Options & Performance Rights Source: Computershare Reports Ownership (m) Diluted Interest Register Computershare’s free float is ~79.3% or $3.2bn at the current market price. Founders Christopher Morris and Tony Wales have progressively lowered their stakes in the business, now holding a combined 13.3% interest. Major institutional shareholders have been net buyers over the last four quarters. TABLE 14: INSIDER EQUITY INTERESTS Register Analysis Issued Shares 555.7m Insider Ownership 20.7% Free Float % 79.3% Institutional Ownership 21.4% Current Substantials Position (m) O/S % Last Quarter Last Year Last 3 Yrs Christopher Morris 46.0 8.3% -1.2 -1.5 -8.3 Perpetual 27.8 5.0% - - -19.3 Tony Wales 27.6 5.0% -0.5 -0.5 -1.5 Penelope Maclagan 14.7 2.7% 0.0 -0.2 -0.9 Westside Investments 10.4 1.9% - - -14.6 AFIC 8.2 1.5% - - - Source: Factset Transactions (m)
  • 33. 33 10. KEY RISKS AND CATALYSTS Key risks Cyclical • The risk is a deferred recovery in the corporate actions cycle. • One mitigant is that two out of three preconditions for cycle recovery (ie. strong US corporate balance sheets and positive US yield curve) are in place and history suggests that once the VIX stabilises below 30, the recovery in M&A activity will be swift. • Another mitigant is that our MIGR analysis suggests a stressed downside DCF valuation is $7.64 per share. Anti-trust competition restrictions • CPU’s increasing size may limit the potential for value-creating M&A activity or increase the risk of ill-advised large transactions. • The mitigant is that CPU has a very good M&A track record and talks rationally about its pricing and target selection criteria. Key Catalysts • VIX decline below 30%, the missing precondition for corporate action recovery. • A sustained decline in the AUDUSD. • Approval of BNY Mellon. • Other value-adding acquisition announcements. • Rising interest rate cycle.
  • 34. 34 FINANCIAL SUMMARY Computershare CPU As at: 14/10/2011 Recommendation: Positive Share Price $7.48 Year end June 2011A 2012E 2013E 2014E INCOME STATEMENT Sales Revenue US$m 1,604 1,616 1,599 1,581 Consolidated EBITDA US$m 494 485 481 482 D&A US$m 41 41 41 41 Consolidated EBIT US$m 412 403 399 400 Net Interest US$m 33 31 23 15 Tax Expense US$m 100 83 84 86 Associates/Minorities US$m (5) (5) (5) (5) Adj NPAT US$m 264 283 287 294 NRIs US$m (10) 0 0 0 Reported NPAT US$m 264 283 287 294 Shares on Issue (end period) m 556 556 556 556 EFPOWA m 556 556 556 556 EPS ¢ 55.7 55.9 56.5 57.8 DPS A¢ 28.0 28.0 31.0 34.0 Franking % 60% 60% 60% 60% GROWTH/PROFITABILITY RATIOS Sales Growth % 0.0% 0.7% (1.0)% (1.2)% EBITDA Growth % (3.4)% (1.8)% (0.8)% 0.3% EBIT Growth % (6.3)% (2.2)% (1.0)% 0.4% EPS Growth % (3.7)% 0.4% 1.2% 2.3% EBITDA/Sales % 30.8% 30.0% 30.1% 30.5% EBIT/Sales % 25.7% 24.9% 24.9% 25.3% EBIT Interest Cover x 12.6 12.8 17.4 26.6 Tax Rate % 26.3% 22.4% 22.4% 22.4% ROE % 22.4% 20.9% 19.3% 18.1% ROFE % 24.5% 23.5% 23.8% 24.3% CASH FLOW EBITDA US$m 494 485 481 482 Change in Working Capital US$m (21) 11 0 0 Other US$m (39) 0 0 0 Gross Operating Cash Flow US$m 433 496 480 482 Net Interest Paid US$m (27) (31) (23) (15) Tax Paid US$m (87) (83) (84) (86) Net Operating Cash Flow US$m 319 381 373 380 Maintenance Capex US$m (23) (44) (44) (44) Free Cash Flow US$m 296 338 330 337 Dividends Paid US$m (155) (156) (164) (181) Expansionary Capex US$m 0 0 0 0 Acquisitions US$m (66) 0 0 0 Asset Sales US$m 8 0 0 0 Dividends Received US$m 1 0 0 0 Shares Issues/Buybacks US$m (30) 0 0 0 Other US$m 0 0 0 0 Increase in Net Cash/(Debt) US$m 53 182 166 156 GOCF/EBITDA % 88% 102% 100% 100% Total Capex/Sales % 1.5% 2.7% 2.7% 2.8% Total Capex/Depreciation x (0.6) (1.1) (1.1) (1.1) Year end June 2011A 2012E 2013E 2014E VALUATION METRICS PER x 13.7 13.6 13.5 13.2 P/EG (2YR) x 8.7 3.9 Dividend Yield % 3.7% 3.7% 4.1% 4.5% EV/EBITDA x 9.9 9.7 9.5 9.1 EV/EBIT x 11.9 11.7 11.4 11.0 P/FCF x 14.3 12.5 12.9 12.6 P/BV x 3.4 3.1 2.8 2.6 BALANCE SHEET Assets Cash US$m 347 347 347 347 Working Capital US$m 313 299 296 293 PP&E US$m 155 158 161 164 Intangibles US$m 3,283 3,241 3,200 3,158 Investments US$m 28 28 28 28 Other US$m (1,267) (1,267) (1,267) (1,267) Total Assets US$m 2,873 2,821 2,779 2,737 Liabilities Debt US$m 1,013 831 666 510 Working Capital US$m 367 364 356 332 Other US$m 214 214 214 214 Total Liabilities US$m 1,628 1,443 1,269 1,089 Equity US$m 1,245 1,378 1,510 1,649 Capital Employed US$m 1,912 1,862 1,828 1,811 Net Debt/(Cash) US$m 666 484 318 162 Net Debt/Equity % 53.5% 35.1% 21.1% 9.8% Net Debt/Debt+Equity % 34.9% 26.0% 17.4% 9.0% Net Debt/EBITDA x 1.3 1.0 0.7 0.3 Working Capital/Sales % (3.4%) (4.0%) (3.8%) (2.5%) D&A/PP&E % (26.2%) (25.7%) (25.2%) (24.7%) DCF VALUATION $m $/share Risk Free Rate 6.5% Equity Value 4,774 $8.59 Market Risk Premium 6.0% (Net Debt)/Cash (679) ($1.22) Beta 1.00 Franking Credits $0.68 WACC 10.5% DCF Valuation $9.27 Australia & New Zealand US$m 353 366 344 322 Asia US$m 124 126 132 142 Continental Europe US$m 95 91 91 91 UCIA US$m 288 273 265 235 United States US$m 509 509 515 531 Canada US$m 203 202 205 212 Technology & Other US$m 34 34 34 34 Group Revenue US$m 1,604 1,616 1,599 1,581 Australia & New Zealand US$m 87 91 85 80 Asia US$m 48 50 53 57 Continental Europe US$m 14 14 14 14 UCIA US$m 116 112 109 97 United States US$m 125 125 126 135 Canada US$m 94 93 94 100 Technology & other US$m (5) 0 0 0 Group EBITDA US$m 480 485 481 482 Australia & New Zealand % 24.7% 24.7% 24.7% 24.8% Asia % 38.9% 39.7% 39.7% 40.0% Continental Europe % 14.7% 15.1% 15.1% 15.1% UCIA % 40.4% 41.1% 41.1% 41.1% United States % 24.5% 24.5% 24.5% 25.5% Canada % 46.2% 46.0% 46.0% 47.0% Technology & Other % (14.2%) 0.0% 0.0% 0.0% Group EBITDA/Sales % 29.9% 30.0% 30.1% 30.5% DIVISIONAL SUMMARY
  • 35. 35 22% 24% 26% 28% 30% 32% 34% 2010 2011 2012 2013 2014 Margin Trends EBITDA/Sales EBIT/Sales 11 14 17 20 23 26 29 6% 12% 18% 24% 30% 36% 42% 2010 2011 2012 2013 2014 Gearing & Interest Cover Net Debt/NetDebt+Equity (%) EBIT Interest Cover (x) 12% 15% 18% 21% 24% 27% 30% 2010 2011 2012 2013 2014 Return Trends ROE ROA ROFE - Reported RESEARCH RECOMMENDATION DEFINITIONS Positive Stock is expected to outperform the S&P/ASX 200 over the coming 24 months Neutral Stock expected to perform in line with the S&P/ASX 200 over the coming 24 months Negative Stock is expected to underperform the S&P/ASX 200 over the coming 24 months Speculative Stock has limited history from which to derive a fundamental investment view or its prospects are highly dependent on event risk, eg. Successful exploration, scientific breakthrough, high commodity prices, regulatory change, etc. Suspended Stock is temporarily suspended due to compliance with applicable regulatory and/or Evans & Partners policies in circumstances where Evans & Partners is acting in an advisory capacity. Not Rated Stock is not included in our investment research universe. Research Criteria Definitions Recommendations are primarily determined with reference to how a stock ranks relative to the S&P/ASX 200 on the following criteria: Valuation Rolling 12 month prospective multiples (composite of Price-to-Earnings Ratio, Dividend Yield and EV/EBITDA), or long-term NPV for resource stocks. Earnings Outlook Forecast 2 year EPS growth. Earnings Momentum Percentage change in the current consensus EPS estimate for the stock (rolling 1 year forward basis) over the consensus EPS estimate for the stock 3 months ago. Shareholder Returns Composite of forecast ROE (rolling 1 year forward basis) and the percentage change in ROE over 2 years. Debt Servicing Capacity Rolling 12 month EBIT Interest Cover ratio. Cyclical Risk Qualitative assessment of the 2 year outlook for a stock/industry’s profit cycle. Industry Quality Qualitative assessment of an industry’s growth/returns potential and company specific management capability. Financial Transparency If we don’t understand it, we won’t recommend it. For stocks where Evans & Partners does not generate its own forecasts, Bloomberg consensus data is used. Analysts can introduce other factors when determining their recommendation, with any material factors stated in the written research where appropriate.
  • 36. 36 GENERAL RESEARCH DISCLAIMER, WARNING & DISCLOSURES This document is provided by Evans and Partners ABN 85 125 338 785, holder of AFSL 318075. The information is general advice only and does not take into consideration an investor’s objectives, financial situation or needs. Before acting on the advice, investors should consider the appropriateness of the advice, having regard to the investor’s objectives, financial situation and needs. If the advice relates to a financial product that is the subject of a Product Disclosure Statement (e.g. unlisted managed funds) investors should obtain the PDS and consider it before making any decision about whether to acquire the product. The material contained in this document is for information purposes only and does not constitute an offer, solicitation or recommendation with respect to the purchase or sale of securities. It should not be regarded by recipients as a substitute for the exercise of their own judgment. Investors should be aware that past performance is not an infallible indicator of future performance and future returns are not guaranteed. Any opinions and/or recommendations expressed in this material are subject to change without notice and Evans and Partners is not under any obligation to update or keep current the information contained herein. References made to third parties are based on information believed to be reliable but are not guaranteed as being accurate. This document is provided to the recipient only and is not to be distributed to third parties without the prior consent of Evans and Partners. EVANS AND PARTNERS DISCLOSURE OF INTERESTS Evans and Partners and its respective officers and associates may have an interest in the securities or derivatives of any entities referred to in this material. Evans and Partners does, and seeks to do, business with companies that are the subject of its research reports. EVANS AND PARTNERS CORPORATE RELATIONSHIP DISCLOSURE AYUHA: Evans and Partners have arranged, managed or co-managed a public offering of the company or its affiliates in the past 12 months. BHP: A director of Evans and Partners Pty Ltd Advisory Board is a director of BHP Billiton Ltd. BPA: Evans and Partners have been appointed by the Issuer as Broker to an on-market buy-back. Accordingly, Evans and Partners are unable to give Sellers advice in respect of a sale of this security. BSL: A director of Evans and Partners Pty Ltd Advisory Board is a director of BlueScope Steel Ltd. BOQ, BOQPA, BOQPC: A director of Evans and Partners Pty Ltd Advisory Board is a director of Bank of Queensland. CBA: Evans and Partners managed or co-managed a public offering of securities of the company or its affiliates in the past 12 months. CBAHA: Evans and Partners managed or co-managed a public offering of securities of the company or its affiliates in the past 12 months. FGL: A director of Evans and Partners Pty Ltd Advisory Board is a director of Fosters Group Ltd. HHY: Evans and Partners have been appointed by the Issuer as Broker to an on-market buy-back. Accordingly, Evans and Partners are unable to give Sellers advice in respect of a sale of this security. LLC: A director of Evans and Partners Pty Ltd Advisory Board is a director of Lend Lease Corporation Ltd. MQG: MQCPA: A director of Evans and Partners Pty Ltd Advisory Board is a director of Macquarie Group Ltd. ORG: A director of Evans and Partners Pty Ltd Advisory Board is a director of Origin Energy Ltd. PPC: Evans and Partners managed or co-managed a public offering of securities of the company or its affiliates in the past 12 months. OOH: Evans and Partners have arranged, managed or co-managed a public offering of the company or its affiliates in the past 12 months. QRN: Evans and Partners managed or co-managed a public offering of securities of the company or its affiliates in the past 12 months. SAR: Evans and Partners managed or co-managed a public offering of securities of the company or its affiliates in the past 12 months. SNO: Evans and partners has received during the past 12 months compensation for financial & advisory services from the company, its parent, or its wholly owned or majority owned subsidiary. Evans and Partners managed or co-managed a public offering of securities of the company or its affiliates in the past 12 months. RESEARCH ANALYST CERTIFICATION I, George Gabriel, CFA, hereby certify that all the views expressed in this report accurately reflect my personal views about the subject investment theme &/or company securities. I also certify that no part of my compensation was, is, or will be, directly or indirectly, related to the specific recommendations or views expressed in this report. RESEARCH ANALYST DISCLOSURE OF INTEREST I, George Gabriel, CFA, &/or entities in which I have a pecuniary interest, have an exposure to the following securities &/or managed products: TGA. DISCLAIMER Except for any liability which cannot be excluded, Evans & Partners, its directors, employees & agents accept no liability or responsibility whatsoever for any loss or damage of any kind, direct or indirect, arising out of the use of all or any part of this material. All information is correct at the time of publication; additional information may be available upon request.