SlideShare a Scribd company logo
1 of 28
Download to read offline
Wilson HTM Equities Research – 3P Learning Limited.
Issued by Wilson HTM Ltd ABN 68 010 529 665 - Australian Financial Services Licence No 238375, a participant of ASX Group and should be read
in conjunction with the disclosures and disclaimer in this report. Important disclosures regarding companies that are subject of this report and an
explanation of recommendations can be found at the end of this document.
21 April 2015
3P LEARNING LIMITED. (3PL)
ACTION & RECOMMENDATION
We initiate coverage on 3PL with a Buy recommendation and $2.78
price target. 3PL is well positioned in the high growth online
education software market - with a highly scalable business model,
leading brands (Mathletics and Reading Eggs) and leading Australian
schools market share. 3PL’s ~21% p.a. 2-yr EPS growth CAGR is
underpinned by multiple growth options and the benefits of +15%
price increases from Feb 14 to Feb 15 providing full-year earnings
contribution in FY16F. Growth options include its ambitious USA roll-
out and first mover advantage in online science through its
IntoScience product.
Earning from learning
InitiatingCoverage
Attractive business model
3PL has an attractive business model – operating in the high growth
online education sector; is highly scalable; generates high free cash
flow and has some pricing power in its core markets of Australia & NZ.
Sector tailwinds
Sector tailwinds include: (i) globally increasing education spending; and
(ii) the structural shift to online education. Almost every OECD nation
has increased education spending as a %GDP from 2000-11. Chart 5.
Multiple growth drivers
3PL’s 2-year EPS CAGR of +21.4% per annum is supported by
multiple earnings growth drivers including: (i) re-pricing of its leading
Australian franchise; (ii) increased cross-sell; (iii) increased schools
penetration in Australia & NZ; (iv) increased students penetration in
existing schools; (iv) new products, such as IntoScience; (v) global
growth, particularly in the Americas; and (vi) acquisitions.
Valuation upside
Our base case valuation of $2.78 per share is in line with our DCF
valuation. We highlight ~35% upside to our $3.60 bullish case.
Risks & Catalysts
 Downside risks: 1) Reading Eggs distribution agreement, 2)
technology, 3) competition, 4) key person risk.
 Upside risks: 1) IntoScience; 2) USA, 3) Australian re-pricing.
 Catalysts: 1) Winning USA schools districts contracts, 2)
IntoScience.
12m Target Price (AUD) $2.78
Share Price @ 20-Apr-15 (AUD) $2.36
Fcst 12m Capital Return 17.8%
Fcst 12m Dividend Yield 1.5%
12m Total S’holder Return 19.2%
George Gabriel, CFA
george.gabriel@wilsonhtm.com.au
Tel. +61 3 9640 3864
12m Share Price Performance
1m 6m 12m
Abs. Return (%) 0.4 3.5
Rel. Return (%) 1.4 -3.9
WHTM Return Re-Investment Matrix
Return
High Cash Generator ChampionLow
Challenged Potential
Low High
Re-Investment
WHTM Risk Assessment
Low Med High Spec
Share
Price
Risk
Business
Risk
Year-End June (AUD) FY14A FY15E FY16E FY17E
NPAT Rep ($m) 9.4 11.2 15.1 16.6
NPAT Norm ($m) 9.3 11.2 15.1 16.6
Consensus NPAT ($m)
EPS Norm (cps) 6.9 8.3 11.2 12.3
EPS Growth (%) 92 21 34 10
P/E Norm (x) 34.4 28.4 21.1 19.2
EV/EBITDA (x) 23.5 18.9 13.0 10.7
FCF Yield (%) 3.7 3.7 7.3 8.9
DPS (cps) 0.0 2.0 4.2 4.6
Dividend Yield (%) 0.0 0.9 1.8 2.0
Franking (%) 0 100 100 100
Source: Company data, WHTM estimates, S&P Capital IQ
Key Changes Before After Var %
NPAT: FY15 11.2
Norm FY16 15.1
($m) FY17 16.6
EPS: FY15 8.3
Norm FY16 11.2
(cps) FY17 12.3
DPS: FY15 2.0
(cps) FY16 4.2
FY17 4.6
Price Target: 2.78
Rec: BUY
Mkt Cap: $318m Enterprise Value: $303m Shares: 135m Sold Short: 0.7 ASX 300 Wgt: n/a MedianT’over/Day: $0.1m
0.000
0.500
1.000
1.500
2.000
2.500
Apr-14 Aug-14 Dec-14 Apr-15
$ 3PL XSI Rebased
21 April 2015
Consumer Services
3P Learning Limited.
Wilson HTM Equities Research – 3P Learning Limited. 2
PRICE TARGET
Valuation
Discounted Cash Flow 2.78
INTERIMS ($m)
Half-yr (AUD) Dec 13 Jun 14 Dec 14 Jun 15
1HA 2HA 1HA 2HE
Sales
Revenue
15.3 20.5 18.4 22.7
EBITDA 3.3 9.6 6.2 9.7
EBIT 2.5 8.5 4.9 8.0
Net Profit 2.4 6.9 4.0 7.2
Norm. EPS 1.7 5.1 3.0 5.3
EBIT/Sales
(%)
16.1 41.4 26.8 35.3
Dividend (c) 0.0 0.0 0.0 2.0
Franking (%) 0.0 0.0 0.0 100.0
FINANCIAL STABILITY
Year-end June (AUD) FY14A FY15E FY16E
Net Debt -5.7 -4.0 -9.4
Net Debt / Equity (%) <0 <0 <0
Net Debt / EV (%) <0 <0 <0
Current Ratio (x) 1.2 2.8 3.3
Interest Cover (x) � <0 <0
Adj. Cash Int. Cover (x) <0 <0
Debt / CashFlow (x) 1.2 1.6 0.6
Net Debt (cash) / share ($)
NTA / share ($) 0.1 0.2 0.3
Book Value / share ($) 0.1 0.2 0.3
Payout Ratio (%) 0 24 38
Adj. Payout Ratio (%) 0 3 0
EPS RECONCILIATION ($m)
FY14A FY15E
Rep. Norm
.
Rep. Norm
.Sales Revenue 36 36 41 41
EBIT 11.0 10.9 12.9 12.9
Net Profit 9.4 9.3 11.2 11.2
Notional Earn. 0.0 0.0 0.0 0.0
Pref./Conv. Div. 0.0 0.0 0.0 0.0
Profit for EPS 9.4 9.3 11.2 11.2
Diluted Shrs(m) 135 135 135 135
Diluted EPS (c) 7.0 6.9 8.3 8.3
Feb 14
KEY ASSUMPTIONS
Year-end June (AUD) FY14A FY15E FY16E FY17E
Revenue Growth (%) 16.8 17.0 13.2
NPAT Growth (%) 16.8 17.0 13.2
EPS Growth (%) 24.0 46.0 21.4
EBITDA / Sales (%) 36.1 38.9 48.0 51.9
EBIT / Sales (%) 30.6 31.5 38.7 40.4
Tax Rate (%) 15.4 17.1 23.0 28.0
ROA (%) 21.7 24.0 29.2 28.8
ROE (%) 129.0 35.2 35.2 30.3
PROFIT & LOSS ($m)
Year-end June (AUD) FY14A FY15E FY16E FY17E
Sales Revenue 35.8 41.1 48.6 54.6
EBITDA 12.9 16.0 23.3 28.3
Depn & Amort 1.9 3.1 4.5 6.3
EBIT 10.9 12.9 18.8 22.1
Net Interest Expense 0.0 -0.6 -0.7 -1.0
Tax 1.7 2.3 4.5 6.5
Minorities / pref divs 0.0 0.0 0.0 0.0
Equity accounted NPAT 0.0 0.0 0.0 0.0
Net Profit pre Sig. Items 9.3 11.2 15.1 16.6
Abn’s / Ext’s / Signif. 0.1 0.0 0.0 0.0
Reported Net Profit 9.4 11.2 15.1 16.6
CASHFLOW ($m)
Year-end June (AUD) FY14A FY15E FY16E FY17E
EBITDA 12.9 16.0 23.3 28.3
Interest & Tax 0.0 0.6 0.7 1.0
Working Cap / Other -0.8 -4.8 -0.7 -1.0
Operating Cash Flow 12.1 11.8 23.3 28.3
Maintenance Capex -0.3 -0.1 0.0 0.0
Free Cash Flow 11.7 11.7 23.3 28.3
Dividends Paid 0.0 0.3 0.0 0.0
Growth Capex 0.0 -5.0 -10.0 -10.0
Invest. / Disposals -7.8 -3.7 0.0 0.0
Other Inv. Flows 0.0 0.0 0.0 0.0
Cash Flow Pre Financing 3.9 3.3 13.3 18.3
Funded by Equity 0.0 0.6 0.8 1.0
Funded by Debt 0.0 -1.7 -4.5 -6.5
Funded by Cash -3.9 -2.2 -9.6 -12.8
BALANCE SHEET SUMMARY ($m)
Year-end June (AUD) FY14A FY15E FY16E FY17E
Cash 24.4 17.7 23.1 31.3
Current Receivables 5.9 5.8 5.8 5.8
Current Inventories 0.0 1.5 1.5 1.5
Net PPE 1.3 1.1 1.1 1.1
Investments 0.0 0.0 0.0 0.0
Intangibles / Capitalised 16.5 25.4 30.9 34.6
Other 2.4 2.3 2.3 2.3
Total Assets 50.6 53.8 64.6 76.5
Current Payables 8.0 3.7 3.7 3.7
Total Debt 18.8 13.7 13.7 13.7
Other Liabilities 16.5 4.4 4.4 4.4
Total Liabilities 43.3 21.7 21.7 21.7
Minorities / Convertibles 0.1 0.1 0.1 0.1
Shareholder Equity 7.3 32.0 42.9 54.8
Total Funds Employed 26.0 45.7 56.6 68.5
RETURNS
FY14A FY15E FY16E FY17E
ROE (%) 85.1 57.1 40.2 34.0
ROIC (%) 95.5 61.1 42.9 43.7
Incremental ROE -31.3 22.3 21.6 13.4
Incremental ROIC -139.2 20.3 26.0 49.2
21 April 2015
Consumer Services
3P Learning Limited.
Wilson HTM Equities Research – 3P Learning Limited. 3
Contents
1. Investment summary ……………………………………………………4
1.1 Business overview……………………………………………………………..…...4
1.2 Investment view........................................................................................... 4
1.3 Key catalysts............................................................................................... 5
1.4 Key risks and mitigants ............................................................................... 6
2. Valuation 7
2.1 Price target.................................................................................................. 7
2.2 Comparable companies analysis - listed online stocks ................................ 7
2.3 Comparable acquisitions - education sector acquisitions ........................... 10
2.4 Earnings analysis ...................................................................................... 10
2.5 Scenario analysis ...................................................................................... 12
3. Growth driver analysis 14
3.1 Average revenue per user (ARPU) ........................................................... 14
3.2 Cross-sell.................................................................................................. 15
3.3 Increased schools penetration................................................................... 16
3.4 Increased students penetration.................................................................. 17
3.5 New products ............................................................................................ 18
3.6 Global growth ........................................................................................... 18
3.7 Acquisitions............................................................................................... 19
4.Business description 19
4.1 History ...................................................................................................... 19
4.2 Business model ........................................................................................ 19
4.3 Revenue model ......................................................................................... 20
4.4 Competition............................................................................................... 20
4.5 Industry .................................................................................................... 23
5. Corporate overview 24
5.1 Board ........................................................................................................ 24
5.2 Management ............................................................................................. 24
5.3 Register .................................................................................................... 24
6. Risks and catalysts 25
6.1 Upside Risks ........................................................................................... 25
6.2 Downside Risks ....................................................................................... 25
21 April 2015
Consumer Services
3P Learning Limited.
Wilson HTM Equities Research – 3P Learning Limited. 4
1.Investment summary – 3P Learning Ltd (3PL)
1.1 BUSINESS OVERVIEW
3P Learning Ltd (3PL) is a global online education company with a portfolio of
brands and products for primary, middle and secondary school students from
Kindergarden-Year 12 (“K-12”) across numeracy, literacy and science subjects.
Numeracy. Mathletics is the flagship product – it is an online numeracy
product for the school years from Kingergarden to Year 12 (“K-12”). It has
~48% penetration of Australian schools and is the leading Australian online
mathematics education product. It is currently available in two languages and
includes content aligned to 40 mathematics curricula around the world.
Literacy
- Reading Eggs. 3PL is the exclusive re-seller of Reading Eggs products in
Australia and some offshore markets. These products provide an English
literacy product targeted at grades K-6.
- Spellodrome is 3PL’s online English literacy product which targets grades
K-10. 3PL’s key focus is on Reading Eggs rather than Spellodrome.
Science. IntoScience is a relatively new online science education product.
3PL is a global online education
company.
Mathletics is its flagship product,
generating ~80% total revenue
and with ~48% Australian schools
penetration.
3PL is the exclusive re-seller of
Reading Eggs in Australia and
some offshore products.
IntoScience is a relatively new
product.
1.2 INVESTMENT VIEW
Investment view
We initiate coverage with a Buy recommendation and $2.78 price target.
Our base case valuation is $2.78
per share.
Valuation
Our $2.78 price target is in line with our discounted cash flow valuation. We believe
DCF valuation is an appropriate valuation method because it captures the expected
returns from:
3PL’s current investment in its direct sales force in the USA.
Product re-pricing upside.
IntoScience product roll-out.
Balanced base case risk-reward ratio supported by ~35% upside to bull case
At current share prices, the risks are evenly balanced, with approximately equal
upside to our base case of $2.78 and downside to our bear case of $2.01.
However, we note that our bull case valuation $3.60 per share implies ~35%
upside.
The bull case implies 35% upside.
Strong brands with leading market shares
3PL has a competitive advantage in that it provides a full suite of online education
products for schools – including mathematics (Mathletics), reading (Reading Eggs),
spelling (Spellodrome) and its newest science product (IntoScience).
3PL has leading market shares in Australia and New Zealand, with Mathletics and
Reading Eggs in particular.
3PL has leading market shares
with Mathletics in Australia & NZ.
Highly scalable with high free cash flow generation
3PL’s business model is highly scalable, with upfront development costs, direct
sales staff costs and very low incremental cost of sales.
3PL generates high free cashflow, with 223% cash conversion ratio in FY14
($18.9m net cash from operations/ $8.5m proforma NPAT).
3PL has zero debt and A$15.8m cash on balance sheet as at 1H15, having
financed its previous expansion through operating cashflow.
The business model is highly
scalable.
3PL has net cash on balance
sheet.
21 April 2015
Consumer Services
3P Learning Limited.
Wilson HTM Equities Research – 3P Learning Limited. 5
Recurrent revenues
3PL’s earnings are recurring in nature, given:
Reasonably high customer switching costs. Switching to a new product involves
a new investment of time before users are proficient with product usage.
Customers generally result from the migration from offline learning to online, as
opposed to winning market share from existing providers.
The low absolute cost per user of $8.40 in 1H15.
Students and schools who are familiar with the products are more likely to
continue using them through their schooling.
Revenues are generally recurring
in nature.
Multiple earnings growth drivers
3PL has multiple medium-term earnings growth drivers, including:
Australian pricing power driving ARPU increases. 3PL has the potential to re-
price Mathletics and Reading Eggs in Australia & NZ given their leading market
positions and the ~$30-$60 cost of text books (ie. online education’s substitute
product). Chart 1.
Cross-sell potential. One of 3PL’s competitive advantages is the breadth of its
product range – covering mathematics (Mathletics), literacy (Reading Eggs and
Spellodrome) and science (IntoScience). This creates ongoing product cross-
sell opportunities. This compares to many other companies which only focus on
single products. Chart 2.
Increased schools penetration. 3PL has the potential to increase the proportion
of students within existing school customers using its products. Chart 3.
New product growth. 3PL has potential to capture first mover advantage in
online science education, given that this is a relatively new category.
IntoScience was launched in Australia & NZ in 2014 and will be offered in all
operational territories by 2016. In FY14, 3PL sold 46,650 IntoScience licences.
However, growth is still off a low base, comprising only 1% of total 1H15 licence
numbers.
Global growth. Australia & NZ currently generate ~67% total revenues (1H15
licence revenue $18.4m). The USA is a key target for growth. 3PL has only
penetrated ~1% of the USA schools population, highlighting the size of the
potential prize. Recently, 3PL has been investing in its sales force expansion in
North America to drive growth in FY16F. Global revenue contributions are
increasing, up from 27% in 1H14 to 33% in 1H15.
Acquisitions. 3PL has made some selective bolt-on acquisitions in recent years,
and is well placed to continue with this strategy.
We analyse these key growth drivers in Section 3 of this report.
3PL has multiple medium-term
earnings growth drivers.
IntoScience is 3PL’s fastest
growing product in the emerging
category of online science
education.
1.4 KEY CATALYSTS
Potential stock re-rating catalysts include:
Australian re-pricing
We believe 3PL has significant potential to leverage its leading market position in
Australia & NZ to continue re-pricing its flagship Mathletics product (and to a lesser
extent also Reading Eggs). Our bull case scenario analyses this and concludes that
a $3.60 per share valuation would apply if the ARPU increased to $20 by FY20F,
driven by Australian & NZ re-pricing.
IntoScience sales traction
We would expect 3PL to re-rate as IntoScience gains sales momentum through
FY15F and FY16F.
IntoScience was piloted in 2013 and fully launched into Australia for years 7 and 8
in 2014. 3PL aims to have IntoScience available globally by 2016.
21 April 2015
Consumer Services
3P Learning Limited.
Wilson HTM Equities Research – 3P Learning Limited. 6
USA schools district contract wins
Winning schools district contracts in the USA means high student volumes can be
achieved through a single school district contract.
In the USA, public schools are run by districts, which in turn are controlled by local
and state governments. Schools can buy at an individual school level or across an
entire district. 3PL’s strategy is both bottom up (ie. targeting individual schools in a
district to achieve some scale and then leverage this into support at a district level)
and top down (ie. targeting the entire district).
Presently, 3PL is continuing its expansion into the US by investing in the salesforce
infrastructure to then leverage for licence growth.
In the USA, the focus for the US is on Mathletics and IntoScience, given that 3PL
does not have the right to distribute Reading Eggs in the USA and Spellodrome is
not a strategic priority for 3PL.
Winning schools districts contracts
can bring high volumes with one
contract.
1.5 KEY RISKS AND MITIGANTS
Key risks are competition, technology, and the Reading Eggs distribution licence.
Competition
The sector is fragmented, particularly offshore.
In Australia, we believe 3PL is well placed to grow its Mathletics market share and
Reading Eggs cross-sell given:
Mathletics and Reading Eggs are superior products compared to local
competition such as Skoolbo and Studyladder, in our view.
3PL has achieved dominant local market shares in Mathletics and Reading
Eggs despite the existence of local competition.
In offshore markets, there is more competition than in Australia. 3PL is growing its
USA volumes, albeit off a low base.
Technology
3PL relies on its cloud-based technology platform in order to deliver its online
educational services. This technology may be adversely affected by developments
such as staff misuse, damage, computer viruses and hackers. Any service
disruption may cause significant damage to 3PL’s reputation and its ability to
generate revenue.
3PL’s migration to public cloud services over time could result in service disruptions
and/or be more time consuming and expensive than anticipated.
Reading Eggs distribution licence.
3PL has a distribution agreement with Pascal Press/Blake Group to sell Reading
Eggs products in Australia and New Zealand and some offshore markets. There are
minimum sales volume requirements are part of this licencing arrangement. We
understand that 3PL is trading ~2 years ahead of its minimum volume requirements,
but the exact terms of the arrangement have not been disclosed.
All other online education products are owned by 3PL.
21 April 2015
Consumer Services
3P Learning Limited.
Wilson HTM Equities Research – 3P Learning Limited. 7
2. Valuation
2.1 PRICE TARGET
We initiate coverage with a Buy recommendation and $2.78 share price target (in
line with our discounted cash flow valuation).
We believe that a DCF valuation is appropriate given that 3PL is investing in new
staff hires in the USA to drive sales, which depresses near-term earnings but should
be captured in long-term DCF valuation.
Our share price target is $2.78 per
share, in line with our DCF
valuation.
2.2 COMPARABLE COMPANIES ANALYSIS – LISTED ONLINE STOCKS
We discuss the results of our comparable companies analysis below.
Table 2 summarises the valuation of various online companies, using Bloomberg
consensus data. For the purposes of our analysis, we have divided listed online
stocks into 3 segments:
“Online Leaders”. These include REA Group Ltd (REA), Seek Limited (SEK),
Carsales.com Ltd (CRZ) and Trademe Group Ltd (TME).
“Online Midcap”. These include iSentia Group (ISD), Infomedia Ltd (IFM),
iSelect Ltd (ISU), Webjet Ltd (WEB), 3P Learning Ltd (3PL), and Gentrack
Group Ltd (GTK).
“Online Early Stage and Microcap”. These include Aconex (ACX), Surfstitch
(SRF), Reckon Ltd (RKN), Grays eCommerce (GEG) and onthehouse (OTH).
We have excluded some listed online stocks from our analysis because they
lacked sufficient consensus earnings forecasts to provide a basis for our
analysis.
We have segmented listed online
stocks into (i) Online Leaders; (ii)
Online Midcap and (iii) Online
Early Stage and Microcap.
3PL has a higher EPS CAGR outlook than its online peers
3PL’s higher EPS CAGR outlook explains its higher FY16F PE of 22.0x compared
to the 18.4x average of Online Midcap stocks.
3PL has a 2-yr EPS CAGR growth rate from FY16F to FY17F of 24.6%, compared
to 16.3% average of Online Leaders and 14.1% for Online MidCap. 3PL’s growth is
driven by (i) the full year impact of Australian Mathletics and Readings Eggs re-
pricing by +15% from Feb 14 to Feb 15; and (ii) licence growth. Refer below Section
3 for more details.
3PL has a higher 2yr EPS CAGR
outlook than its peers.
3PL is cheap on a price-earnings growth (PEG) multiple basis
3PL currently trades on a consensus FY16F PEG multiple of 0.7x, compared to the
average FY16F Online Midcap PEG ratio of 1.4x and Online Leaders of 1.5x,
because of 3PL’s higher EPS CAGR outlook.
This is because 3PL has a higher 2-year EPS compound annual growth rate
(CAGR) outlook of 24.6%, vs the Online MidCap average of 14.1% and Online
Leaders of 16.3%.
3PL is cheap on a PEG multiple
basis.
Scale, combined with business quality, attracts a premium rating
Online Leaders trade at a ~18% premium to Online MidCap (FY16F PE 21.7x, vs
Online MidCap 18.4x).
However, scale alone is not sufficient to result in a valuation premium. A business
must also have attractive fundamental qualities to justify a premium rating, such as:
pricing power; the network effect; high margins; cross-sell potential; customer
switching costs etc.
3PL is well placed to re-rate as it
grows.
21 April 2015
Consumer Services
3P Learning Limited.
Wilson HTM Equities Research – 3P Learning Limited. 8
We believe that 3PL could re-rate in the medium term by up to 10-15% (ie. up
towards REA’s rating of FY16F of 26x) if 3PL can demonstrate that it has captured
the network effect in its core Australian market. Much like REA has captured the
network of real estate buyers and sellers to capture a leading position in Australian
real estate advertising, 3PL could also capture the network of students-parents-
schools-competing schools to lock out potential new entrants in online education.
3PL could achieve the network effect through utilisation of its student performance
database for benchmarking; engaging parents in analytical reporting and school
interaction etc.
TABLE 1: COMPARABLE COMPANIES VALUATION
Source: WHTM, S&P Capital IQ, Bloomberg
2.3 COMPARABLE ACQUISITIONS ANALYSIS – EDUCATION SECTOR
ACQUSITIONS
In Table 2, our analysis of recent acquisitions of online education businesses
indicates:
EV/revenue multiple average of 4.8x, with a range from 2.1x to 10.0x.
EV/EBITDA multiple average of 12.1x, with a range of 7.9x to 14.0x.
Key insights are:
The two highest EV/EBITDA acquisitions, both at 14.0x, were of similar
businesses to 3PL.
- In June 2010, Education City was acquired for 14.0x EV/EBITDA (~6.9%
above 3PL FY16F consensus of 13.1x) by Archipelago Learning, which is a
K-12 online education provider and also a distributor of Reading Eggs.
Education City provides online education software for schools in the US and
UK, targeting Kindergarden – Year 6.
- In Oct 11, Blackboard Inc was acquired by Providence Equity. Blackboard
provides online learning for K-12 in the USA.
Recent transactions imply a much higher EV/revenue multiple for the sector:
- On 15 April 2015, Linkedin paid 10.0x EV/revenue for the Lynda.com
acquisition.
- In Oct 2014, Bertelsmann paid 9.4x for Relias Learning.
Professional private equity firms are active in this segment, accounting for 7 of
the 15 identified acquisitions since May 2010.
In June 2010, Education City, a
similar business to 3PL, was
acquired for a 7-17% premium to
3PL’s current multiple.
Recent acquisitions were at ~10x
EV/revenue.
Private equity firms are active in
this segment.
Company Ticker
Share
Price
Market
Cap (A$m)
Franking
%
EBITDA
Margin
Online Leaders FY15F FY16F FY17F FY15F FY16F FY17F FY15F FY16F FY17F 2yr
CAGR
FY15F FY16F FY15F FY16F FY15F FY16F FY17F FY15F
REA Group Ltd REA $47.10 6,350 20.8x 16.8x 14.5x 32.3x 25.8x 21.4x 47.6% 25.5% 20.2% 22.8% 0.7x 1.0x 100% 1.5% 1.9% 11.6x 9.7x 8.8x 56%
Seek Ltd SEK $16.90 5,751 18.6x 15.4x 13.6x 28.5x 23.2x 19.3x 54.1% 23.1% 20.0% 21.6% 0.5x 1.0x 100% 2.3% 2.7% 8.0x 6.8x 6.2x 43%
CarSales.com Ltd CAR $9.90 2,389 16.5x 14.8x 13.5x 23.1x 20.2x 17.8x 21.8% 14.2% 13.5% 13.9% 1.1x 1.4x 100% 3.6% 4.1% 8.4x 7.6x 7.0x 50%
Trade Me Group Ltd TME $3.65 1,446 12.1x 11.4x 10.5x 18.5x 17.6x 16.2x 15.2% 6.8% 6.9% 6.9% 1.2x 2.6x - 4.6% 4.7% 8.0x 7.5x 6.9x 67%
Average 17.0x 14.6x 13.0x 25.6x 21.7x 18.7x 34.7% 17.4% 15.2% 16.3% 0.9x 1.5x 3.0% 3.4% 9.0x 7.9x 7.2x 54%
Online MidCap
iSentia Group Ltd ISD $3.53 700 17.3x 14.7x 13.1x 26.6x 22.1x 19.9x 9.4% 19.3% 12.6% 15.9% 2.8x 1.1x 0% 2.0% 2.5% 6.0x 5.5x 5.0x 34%
Infomedia Ltd IFM $1.25 385 14.2x 12.8x 10.9x 28.1x 24.8x 19.8x 17.5% 10.6% 23.1% 16.7% 1.6x 2.3x 100% 3.1% 3.9% 6.1x 5.6x 5.1x 43%
iSelect Ltd ISU $1.44 370 10.9x 8.0x 7.0x 17.3x 14.8x 12.8x 18.3% 10.7% 18.6% 14.6% 0.9x 1.4x - 0.0% 1.9% 1.9x 1.7x 1.6x 20%
Webjet Ltd WEB $4.05 331 10.3x 9.0x 8.2x 17.0x 14.8x 13.4x -1.7% 14.8% 10.0% 12.4% - 1.0x 100% 3.5% 4.0% 2.5x 2.2x 2.1x 25%
Gentrack Group Ltd GTK $2.32 169 10.3x 9.6x 9.0x 17.7x 15.3x 14.3x 24.9% 15.2% 6.9% 11.0% 0.7x 1.0x - 4.7% 5.6% 3.8x 3.6x 3.3x 36%
Average 12.6x 10.8x 9.6x 21.3x 18.4x 16.1x 13.7% 14.1% 14.2% 14.1% 1.5x 1.4x 2.7% 3.6% 4.1x 3.7x 3.4x 32%
3P Learning Ltd 3PL $2.36 322 17.7x 13.1x 11.0x 28.7x 22.0x 18.7x 30.5% 18.9% 24.6% 0.2x 0.7x - 1.0% 1.2% 7.0x 5.8x 5.0x 39%
Aconex Ltd ACX $2.05 339 - 22.6x 12.7x - 40.2x 19.0x - - 111.8% - - - - 0.0% 0.0% 4.2x 3.4x 2.8x 2%
Surfstitch Group Ltd SRF $1.43 316 54.1x 24.3x 11.0x - 93.2x 25.6x - - - - - - - 0.0% 0.0% 1.4x 1.0x 0.7x 3%
Reckon Ltd RKN $1.89 210 6.3x 5.9x 5.6x 11.9x 11.5x 10.6x 7.5% 5.7% 8.4% - 1.6x 2.0x 60% 5.1% 5.4% 2.4x 2.3x 2.2x 38%
Grays eCommerce Ltd GEG $1.00 91 9.6x 4.7x 4.0x 28.7x 12.3x 10.8x - - 13.0% - - 0.1x 0% 0.0% 0.0% 0.2x 0.2x 0.1x -
Onthehouse Holdings Ltd OTH $0.52 43 7.3x 6.2x 5.4x - 66.9x 15.3x -60.0% 100.0% - - - 0.7x 100% 0.0% 0.0% 1.5x 1.4x 1.3x 21%
Average 19.3x 12.8x 7.7x 20.3x 44.8x 16.2x -26% 53% 44% - 1.6x 0.9x 1.0% 1.1% 1.9x 1.7x 1.4x 16%
Online Early Stage & MicroCap
EV/EBITDA (x) EV/Revenue (x)PERatio (x) EPS Growth % PEG Multiple (x) Dividend Yield %
21 April 2015
Consumer Services
3P Learning Limited.
Wilson HTM Equities Research – 3P Learning Limited. 9
Other acquirers include publishing firms (eg. Pearson PLC), diversified media
companies (eg. Bertelsmann), other online companies (eg. Linkedin) and trade
players (eg. Edmentum).
TABLE 2: COMPARABLE ACQUISITIONS
Source: WHTM, S&P Capital IQ, Bloomberg
Date Target Target Description Acquirer AcquirerDescription EV (A$M) EV/EBITDA EV/revenue
May-10 Skillsoft Cloud-based online learning solutions and softw are
for the enterprise and corporate sector, w ith 6,000
global customers. Acquired for US$2.3bn in 2014
by Charterhouse Capital.
Bain, Berkshire Venture capital houses US$1,100 7.9x
Jun-10 Education City Online education softw are and hardw are for
schools in the US and UK targeting K-6 in literacy,
numeracy and science, w ith 13,000 school
customers in the USA and UK.
Archipelago
Learning
Provides K-12 online learning
softw are, also a Reading Eggs
distributor
US$87 14.0x 6.7x
Oct-11 Renaissance Learning Online education softw are and hardw are for
schools targeted at K-12. In 2014, Permira sold to
Hellman & Friedman for $1.1bn after many years of
double digit grow th.
Permira European private equity US$455 11.0x 3.3x
Oct-11 Blackboard Inc. Online learning and course management softw are
in the US, targeting K-12, corporates and higher
education
Providence
Equity
US-based private equity US$1,770 14.0x 3.3x
Sep-11 Connections Education Virtual schools' provided online, w hich are
registered in a number of US states
Pearson PLC UK-based global publishing firm US$400 2.1x
Mar-12 Archipelago Learning Provides K-12 online learning softw are, also a
Reading Eggs distributor
Plato Learning Know n as Edmentum, provides
interactive K-12 education softw are
US$303 11.4x 3.8x
Mar-13 Renaissance Learning Online education softw are and hardw are for
schools targeted at K-12
Hellman &
Friedman
US private equity US$1100 5.5x
Mar-14 Skillsoft Cloud-based online learning solutions and softw are
for the enterprise and corporate sector
Charterhouse
Capital
UK-based private equity US$2,300 13.5x 5.6x
Apr-14 E-Learning S.A. Technological platform helping organisations and
individuals to develop and deploy online distance
learning and skills assessment programs
John Wiley &
Sons
NYSE-listed, US based global
academic publishing company
$187.00 3.9x
Aug-14 The Learning Lab Singaporean based firm developing primary and
secondary education content across a broad field
Advent
International
Corporation
US-based global private equity firm $286
Oct-14 Relias Learning Learning management system providing custom
courses to organisations
Bertelsmann SE Europe's largest diversified media
company, w hich also invests in
education
$414 9.4x
Feb-15 Abril Educacao Brazilian diversified education company offering
traditional materials and online games/content
Tarpon
Investimentos
Brazilian-listed hedge fund $1,350 12.1x
Mar-15 Nobel Learning
Communities, Inc.
US operator of schools, camps and before/after
school programs
Investcorp Bank /
Bahrain
Mumtalakat
Investcorp is a Bahrain-based private
equity firm. Mumtalakat is investment
arm of Kingdom of Bahrain
$530
Mar-15 Endeavour Learning
Group Pty Ltd
Provides various educational services for fields
including naturopathy, health science and massage
Study Group Pty
Ltd
Specialised tertiary education services $75
Apr-15 Lynda.com Provides video tutorials/courses in various areas
such as softw are, technology and business skills.
LinkedIn Professional social netw ork US$1,500 10.0x
Average 12.0x 4.8x
21 April 2015
Consumer Services
3P Learning Limited.
Wilson HTM Equities Research – 3P Learning Limited. 10
2.4 EARNINGS ANALYSIS
Earnings guidance
At its 1H15 results, 3PL re-confirmed its FY15F prospectus forecasts, though we
believe it could have justified an upgrade to its earnings outlook.
Table 3 compares 1H15 results to WHTM, consensus and 3PL’s prospectus
forecasts. At the FY15F NPAT line, both WHTM’s forecast of A$11.1m and
consensus FY15F forecasts of A$11.5m are ahead of 3PL prospectus forecasts of
A$9.7m, driven by 1H15 result drivers are tracking ahead of prospectus.
3PL is ahead of prospectus on Average Revenue Per User (ARPU). 1H15
ARPU of $8.40 as at 31 Dec 2014 is above prospectus forecast of $8.32 as at
June 2015. Management did not upgrade ARPU guidance at its 1H15
results, although 3PL is clearly well positioned to exceed prospectus
FY15F ARPU.
3PL requires another +9% licence number growth to achieve FY15F. In 1H15,
total licence numbers grew by +4.3% to 4.864m. ~9% growth in 2H15F will
increase total licence numbers to FY15F prospectus of 5.301m. We believe
+9% licence growth is achievable given (i) 3PL has been investing in new sales
staff (particularly in the USA) and (ii) high historical growth rates, eg. 21% in
FY14.
3PL is on track to beat its FY15F
prospectus forecasts.
TABLE 3: 1H15 RESULTS VS WHTM AND PROSPECTUS FORECASTS
Source: WHTM, 3PL
Revenue growth forecasts
3PL listed on 8 July 2014. At the time of the prospectus, 3PL forecast FY14
revenue of A$35.3m (and FY14 EBITDA of A$12.5m), followed by an increase of
$8.5m in FY15F to A$43.8m (a 24% increase). 3PL’s FY15F prospectus revenue
growth forecasts of A$8.5m comprise the following elements:
$5.2m (+19%) increase in Mathletics revenue, driven by forecast growth in
licence numbers across all geographic regions and an assumed 15% increase
in average revenue per Australian Student Licence for Mathletics (contributing
$2.5m incremental billings and $1.2m pro forma revenue).
$2.3m forecast increase in net revenue from Reading Eggs licence number
growth, driven by growth in licences across all geographic regions in which 3P
is licensed to distribute Reading Eggs Products and a reduction in the royalty
payable to Blake Group (reflecting a benefit of $0.7 million under the terms of
the Sales Agency Agreement outlined in section 9.7.1) and
$0.6m an assumed 15% increase in average revenue per Australian Student
Licence for Reading Eggs Products; and
As at 1H15, 3PL is on track to
exceed its FY15F prospectus
forecasts.
Profitability 1H15
Prospectus
FY15F
WHTM FY15F
WHTM FY15F vs
Prospectus
Profitability metrics
EBITDA (A$m) 6.3 16.4 17.6 7.1%
EBIT (A$m) 5 13.3 14.5 9.0%
PBT (A$m) 5.3 15.1
NPAT (A$m) 4.1 11.9
Earnings drivers
Average revenue per user (ARPU) $8.40 $8.32 $8.49 2.0%
No. licenses (m) 4.864 5.301 5.301 0.0%
21 April 2015
Consumer Services
3P Learning Limited.
Wilson HTM Equities Research – 3P Learning Limited. 11
$0.3 million forecast increase from revenue contribution from the South African
operations which are to be acquired in conjunction with the Offer (see section
9.8.3 for further details).
Earnings seasonality
3P’s business is highly seasonal and reliant on a concentration of activity at the
beginning of each academic year which differs by geography. In particular, 3P derives
a majority of revenues from sales transactions occurring in February and March
(southern hemisphere geographies) and to a lesser degree in April, May and June
(northern hemisphere geographies). ~75% of licenses are purchased at the start of
the Australian school year (ie. Jan-Feb each year).
While most revenue is recognised across the licence periods, cash flow is
concentrated in the second half of the financial year
During FY14, 3P is forecast to generate approximately 11%, 14%, 58% and 17% of
Invoiced Billings and other revenue during the first, second, third and fourth quarters,
respectively. The third and fourth quarters are typically 3P’s highest performing
quarters as invoices are issued for approximately three quarters of annual billings,
whilst the first quarter is typically 3P’s lowest performing quarter. (Source: 3PL
prospectus).
Accounting revenue is recognised over the licence period (typically 12 months), whilst
cash flows are typically received around the time of invoicing. This results in
cashflows being 75% weighted to 2H (Jan to June) each year.
3PL’s business is highly seasonal,
with ~75% licences purchases in
2H each year.
25% revenue is forecast to be
received in 1H14; 75% revenue in
2H14.
TABLE 4: FINANCIAL HISTORY AND PROSPECTUS FORECASTS
Source: WHTM, Bloomberg consensus, prospectus
Key financial line items are described below.
Employee expenses
We forecast employee expenses to increase by 17% in FY15F driven by increased
staff in the USA, particularly in sales. Employee expenses fell 28% in FY14 as; 3PL
restructured its sales teams.
Employee expenses are forecast
to increase as new staff are hired
in the USA
A$m FY11 FY12 FY13 1H14 FY14 1H15
FY15F
(WHTM)
FY15F
(consensus)
FY15F
(prospectus)
Total revenue 23.7 28.5 32.0 15.2 36.5 18.4 43.4 43.9 43.8
Growth vs pcp 20% 12% 14% 21% 19%
Employee expenses -17.8 -18.2 -21.2 -7.1 -15.3 -8.6 17.5
Growth vs pcp 2% 16% -28% 21% -215%
Marketing expenses -1.6 -1.7 -1.8 -1.2 -2.0 -0.9 2.0
Growth vs pcp 6% 6% 11% -25% -198%
Technology and occupancy expenses -1.9 -2.5 -3.2 -1.9 -3.6 -1.3 4.6
Growth vs pcp 32% 28% 13% -32% -227%
Other expenses -2.6 -2.2 -2.3 -0.8 -2.6 -1.3 2.8
Growth vs pcp -15% 5% 13% 63% -208%
Total expenses -23.9 -24.6 -28.5 -11.0 -23.5 -12.1 26.9
Growth vs pcp 3% 16% -18% 10% -214%
EBITDA -0.1 3.8 3.6 4.3 13.0 6.3 16.0 17.0 16.4
Growth vs pcp -5% 261% 47% 23%
Depreciation and amortisation -0.7 -1.3 -1.3 -0.8 -1.9 -1.3 3.1
Growth vs pcp 86% 0% 46% 63% -261%
EBIT -0.8 2.5 2.2 3.5 11.0 5.0 12.9 14.0 13.3
Growth vs pcp 413% -12% 400% 43% 17%
Interest 0.1 0.3 0.3 0.2 0.4 0.3 0.6
Growth vs pcp 200% 0% 33% 50% 50%
Profit/(loss) before tax -0.7 2.8 2.5 3.6 11.4 5.3 13.5
Growth vs pcp 500% -11% 356% 47% 19%
Tax (expense)/benefit -0.5 -0.2 0.2 -0.4 -2.8 -1.2 2.3
Growth vs pcp -60% -200% 1500% 200% -182%
NPAT -1.2 2.6 2.7 3.2 8.5 4.1 11.2 11.5 9.7
Growth vs pcp 317% 4% 215% 28% 32%
21 April 2015
Consumer Services
3P Learning Limited.
Wilson HTM Equities Research – 3P Learning Limited. 12
Marketing expenses
We forecast marketing expenses to be $2.0m in FY15F, which is in line with FY14.
Technology and occupancy expenses
We forecast technology and occupancy expenses to remain flat in FY15F.
Depreciation and amortisation
Capitalisation of development costs to be behind the upwards trend in depreciation
and amortisation expense. From FY14F onwards, 3PL intends to spend ~$10m on
software development, of which 65% will be capitalised per annum.
Dividend
FY15F DPS of 1.8cps. Dividend policy is to pay out 20-30% of statutory NPAT,
franked to the maximum extent possible.
2.5 SCENARIO ANALYSIS
Table 5 summarises our discounted cash flow (DCF) valuations in bear, base and
bull case scenarios. In each scenario, we vary the assumptions on two key
shareholder value drivers: (i) average revenue per user and (ii) number of licences.
Note that most of our scenario analysis involves variation of Australia & New
Zealand’s assumptions, given the A&NZ geography currently provides ~67% total
revenue (1H15), compared to 23% from EMEA and ~10% from the USA, on total
1H15 licence revenues of A$18.4m.
TABLE 5: SCENARIO ANALYSIS
Source: WHTM, 3PL prospectus. Note that the WHTM bull base assumes that FY20F licence growth vs FY15F is only 24% given that we assume
the key driver of the bull case is +61% ARPU increases (mostly driven by Australia & NZ re-pricing), which results in increased customer churn.
Base case valuation
Our base case valuation is $2.78 per share. This assumes:
Annual Australian & New Zealand licence growth of 5% per annum from 1H16F
to FY20F. This may prove to be conservative given historical total licence
growth rates of +45% in FY12 (to 3.464m), +11% in FY13 (to 3.859m), +21% in
FY14 (4.665m) and +4.3% in 1H15 to 4.864m.
Our base case valuation is $2.78
per share.
Metric
WHTM
bear case
WHTM
base case
WHTM
bull case
FY13 actual
FY14
prospectus
forecasts
1H15 actual
FY15F
prospectus
ARPU
ARPU Australia (A$) $10.21 $9.06 $8.67 Not disclosed $9.99
ARPU EMEA (A$) $7.01 $5.76 $6.50 Not disclosed $6.11
ARPU USA (A$) $7.03 $6.95 $6.86 Not disclosed $7.13
FY15F Average ARPU (A$) $8.49 $8.00 $7.82 $8.40 $8.32
FY20F Average ARPU (A$) $9.82 $10.89 $13.63
ARPU grow th % (FY20F - FY15F) 16% 28% 61%
License numbers
Australia (m) 2.789 2.368 2.543 2.659 2.789
EMEA (m) 1.811 0.958 1.285 1.541 1.811
USA (m) 0.701 0.337 0.464 0.664 0.701
FY15F total licences (m) 5.301 3.663 4.292 4.864 5.301
FY20F total licences (m) 6.545 7.052 6.563
Licence grow th % (FY20F - FY15F) 23% 33% 24%
DCF valuation (A$) $2.01 $2.78 $3.60
21 April 2015
Consumer Services
3P Learning Limited.
Wilson HTM Equities Research – 3P Learning Limited. 13
Average revenue per user (ARPU) of $13.37 by FY20F (vs $8.40 as at 1H15
and prospectus FY15F forecast of $8.32).
Bull case valuation
Our bull case valuation is $3.60 per share. This assumes:
Annual Australian & New Zealand licence growth of 2% per annum (reduced
from our base case of 5% p.a.) from 1H16F to FY20F.
Average revenue per user (ARPU) of ~$20 by FY20F (vs base case assumption
of $13.37).
An obvious upside risk for 3PL is increasing Australian & New Zealand ARPU from
~$10.21 (WHTM FY15F estimate) per user to ~$20 per user. We believe that this
re-pricing may be possible because:
Online education may eventually replace textbooks completely, which currently
retail in the range of $20-$60 per subject.
3PL successfully rolled out a +15% price increase in 1H15 in Australia, as
forecast in the prospectus, with “little impact on retention rates to date” (source:
1H15 investor presentation commentary, page 12).
Our base case only assumes Australian ARPU increases to $13.37 by FY20F.
However, if we assume that Australian ARPU increases to $20 by FY20F, then (all
else equal) our DCF valuation increases to $4.13. However, this scenario requires
aggressive annual re-pricing from FY16F to FY20F of all products by ~15% per
annum, with a 5% annual increase for Spellodrome. In this scenario, we would
expect that customer churn would increase, and so we believe that the more
appropriate bull case scenario is to assume Australian & New Zealand ARPU of $20
by FY20F, whilst annual licence volume growth in Australia & NZ declines from our
base case assumption of 5% p.a. to 2% p.a. Combined, these assumptions
comprise our bull case valuation of $3.60 per share.
Another potential source of upside to our $3.60 per share valuation is success in
driving volumes in the USA. It is too early to tell whether there is upside risk to our
base case USA forecasts. Our base case valuation assumes the following
assumptions for 3PL’s USA business”
Annual USA licence volume growth of ~10% per annum, increasing total USA
volumes off the low base of 664k to 1.164m by FY20F. Note that 3PL has been
investing in its direct salesforce in the USA, has recently ended a distribution
arrangement with a third party (which did not perform) and is focusing on driving
USA volumes. However, at this stage, we remain cautious, given the USA is a
competitive market and we will await evidence of above-expectations USA
volume growth before rewarding 3PL with upgrades to our base case DCF
valuation.
USA ARPU increases from ~$7 in FY15F (WHTM estimate) to $8.36 in FY20F
(WHTM estimate).
Our bull case valuation is $3.60
per share.
An obvious upside risk is re-pricing
Australian ARPU more
aggressively, leveraging 3PL’s
local market dominance.
If we assume Australian ARPU
increases to $20 by FY20F without
any increase in customer churn,
then our DCF valuation would be
$4.13 per share.
Another potential upside risk is
above-expectations USA sales
volumes. It is too early to tell how
3PL’s USA sales drive will perform.
Bear case valuation
The keys risks to our base case valuation are (i) lower ARPU growth rates; and (ii)
lower licence volume growth, particularly in the USA.
Our bear case valuation is $2.01 per share. This assumes:
Annual Australian & New Zealand ARPU growth of 3% per annum from 1H16F
to FY20F, with low price growth used as a competitive response to undermine
the business case of potential new entrants in the Australian market and retain
3PL’s existing local market dominance. Note that our initial analysis of
competing products in the Australian market indicated little direct competition to
3PL’s local market dominance.
This may prove to be conservative given historical total licence growth rates of
+45% in FY12 (to 3.464m), +11% in FY13 (to 3.859m), +21% in FY14 (4.665m)
and +4.3% in 1H15 to 4.864m.
Our bear case valuation is $2.01
per share. This assumes 3PL limits
price growth to retain its local
market share dominance and that
total licence volume growth is zero.
Our initial competition review
revealed little direct competition for
3PL’s local market dominance.
21 April 2015
Consumer Services
3P Learning Limited.
Wilson HTM Equities Research – 3P Learning Limited. 14
Average revenue per user (ARPU) of $13.37 by FY20F (vs $8.40 as at 1H15
and prospectus FY15F forecast of $8.32).
Another potential downside risk is the loss of the Reading Eggs distribution
arrangement with the Blake Group. We believe that this risk is acceptable given:
Reading Eggs currently only contributes A$1.0m revenue or 5.4% of total 1H15
revenue of A$18.4m (vs Mathletics A$15.4m, or 84% total revenue).
We understand that 3PL is ~2 years ahead of the minimum sales volumes
required to retain the Reading Eggs distribution arrangement.
Another potential downside risk is
loss of 3PL’s Reading Eggs
distribution licence. However, we
believe this risk is currently a low
risk of limited impact.
3. Growth driver analysis
In this section, we analyse 3PL’s 7 key growth drivers:
ARPU.
Cross-sell potential.
Increased schools penetration.
Increased student population penetration.
New products.
Global growth opportunity.
Acquisitions
3.1 AVERAGE REVENUE PER USER (ARPU)
ARPU is the average price per licence across the 3PL product range. As at 1H15,
ARPU was $8.40, ahead of prospectus FY15F of $8.32. Chart 1 illustrates ARPU
trends. From FY11 to FY14, ARPU declined from $9.83 to $8.41 driven by:
Increasing relative contribution of lower-priced Americas and EMEA.
Change in product mix/customer mix towards more of the lower priced products.
In 1H15 (July – Dec 2014), ARPU was $8.40.
Until FY15, 3PL had not implemented a significant price increase since 2000. From
Feb 2014 to Feb 2015, 3PL re-priced its Australian Mathletics and Reading Eggs
products by ~15%, with customer churn only increasing by 0.5-1% (to ~15% p.a.),
despite the existence of competing products such as Skoolbo and Studyladder.
WHTM forecasts FY15F ARPU of A$8.49, which captures a partial period impact of
3PL’s repricing of Australian licences by +15% from Feb 14 to Feb 15. The full impact
of Australian re-pricing will be captured in 1H16F for the first time.
Our bull case scenario assumes aggressive annual re-pricing from FY16F to FY20F
of all products by ~15% per annum, with a 5% annual increase for Spellodrome.
This may be achievable, given 3PL’s local market dominance, but we would expect
that customer churn rates would consequently increase. We believe that 3PL has
limited pricing power outside Australia & New Zealand.
We believe 3PL has potential to be more aggressive in re-pricing its Australian
Mathletics and Reading Eggs products given its local market dominance confers
some pricing power in Mathletics and to a lesser degree also in Reading Eggs. Its
pricing power is evident in its +15% Mathletics re-pricing from Feb 14 to Feb 15,
without only ~1% increase in customer churn. Also, 3PL’s Australian Mathletics
average revenue per user (ARPU) of ~A$10 (WHTM estimate) seems underweight
relative to the cost of hard-copy textbooks of $30 per user and the cost of a 12-month
at-home subscription for a parent of ~$80 (Reading Eggs) to $99 (Mathletics).
ARPU is currently tracking ahead
of prospectus forecasts.
ARPU declined from FY11 to FY14
as the product and geographic mix
changed.
3PL had not repriced its products
since 2000. From Feb 14 to Feb
15, it increased Mathletics and
Reading Eggs by +15%.
We believe that there is ARPU
upside risk from repricing
Australian & NZ licences.
21 April 2015
Consumer Services
3P Learning Limited.
Wilson HTM Equities Research – 3P Learning Limited. 15
CHART 1: AVERAGE REVENUE PER USER (ARPU) TRENDS
Source: WHTM
3.2 CROSS-SELL POTENTIAL
Online stocks frequently enjoy the medium-term upside potential to cross-sell/up-
sell new or higher value products to their existing customer base. 3PL has this
potential.
Australian cross-sell
An upside risk to our base case is that the Australian Reading Eggs/Mathletics
penetration ratio exceeds our FY16F of ~37%.
3PL has significant potential to cross-sell Reading Eggs into its existing Australian &
New Zealand Mathletics customer’s base. (Spellodrome is not being prioritised by
3PL and IntoScience is still a relatively new product).
We estimate that in 1H15, 3PL had an Australian & NZ Reading Eggs/Mathletics
customer penetration ratio (“RE/ML penetration ratio”) of ~32% (1,887 Mathletics
licences and 598 Reading Eggs licences), which increases to ~37% by FY16F in
our base case. Chart 2.
Offshore cross-sell
Offshore cross-selling potential is less material than Australia & NZ because:
3PL’s relatively low offshore revenue base (~67% 1H15 revenues were in
Australia & NZ).
3PL is not licensed to sell Reading Eggs in the USA. 3PL is currently licenced to
sell Reading Eggs in Australia, New Zealand, UK, Ireland, Malaysia, South
Africa, Singapore, Hong Kong, Pakistan, Arabic-speaking nations, International
Schools worldwide (exc. US and Canada) and other markets as may be agreed
to on a case by case basis..
An upside risk to our base case is
that the A&NZ Reading
Eggs/Mathletics penetration ratio
exceeds our FY16F of ~37%.
Offshore cross-selling potential is
less material than Australian &
New Zealand.
$6.00
$6.50
$7.00
$7.50
$8.00
$8.50
$9.00
$9.50
$10.00
$10.50
FY11 FY12 FY13 FY14 1H15 FY15F
ARPU ARPU (Prosp.) ARPU (WHTMe)
21 April 2015
Consumer Services
3P Learning Limited.
Wilson HTM Equities Research – 3P Learning Limited. 16
CHART 2: READING EGGS/ MATHLETICS AUSTRALIAN CUSTOMER
PENETRATION RATIO TRENDS
Source: WHTM
3.3 INCREASED SCHOOLS PENETRATION
3PL has leading market share in Australia & NZ schools, particularly with Mathletics
and Reading Eggs in Australia. Chart 3. Leading market share confers pricing
power and the potential to lock-out new entrants through capture of the network
effect.
48% of Australian primary & secondary schools Mathletics penetration.
44% of Australian primary schools Reading Eggs penetration.
31% of NZ primary & secondary schools Mathletics penetration.
19% of NZ primary schools Reading Eggs penetration.
Leading market share confers pricing power to 3PL in Australia, evidenced by its
Feb 14 to Feb 15 price increases with “little impact on retention rates to date”
(source: 1H15 investor presentation). Chart 3. Furthermore, we believe that 3PL
has potential to increase barriers to new entrants through capturing the network
effect implicit in its leading Australian market share. 3PL could capture the network
effect by utilising its historical database of student performance to provide
performance benchmarking data for parents and schools, and increase parental
engagement, which is likely to in turn increase customer retention rates and help
drive increased schools’ penetration.
Leading market share confers
pricing power and the potential to
lock-out new entrants through
capture of the network effect.
0%
5%
10%
15%
20%
25%
30%
35%
40%
FY12 FY13 FY14 1H15 2H15e
Australia & NZ RE/ML penetration raio (%)
RE/ML penetration ratio WHTM forecasts (%)
21 April 2015
Consumer Services
3P Learning Limited.
Wilson HTM Equities Research – 3P Learning Limited. 17
CHART 3: SCHOOLS PENETRATION RATIOS
Source: WHTM
3.4 INCREASED STUDENT POPULATION PENETRATION
3PL has the potential to increase the percentage of students within any single
school using 3PL products. We believe that this is a relatively low risk form of
growth for 3PL. Chart 4.
Currently, 3PL’s student population ratios are relatively low because:
A number of schools are at an early stage of adoption, having adopted 3PL’s
products for only a few classes.
Student licences are more concentrated within students in school grades Kinder
– Year 8.
CHART 4: STUDENT POPULATION PENETRATION RATIO
Source: WHTM
48%
44%
1%
31%
19%
0%
24%
4%
0%
7%
0% 0%1% 0% 0%
0%
10%
20%
30%
40%
50%
60%
Mathletics Reading Eggs IntoScience
Aus NZ UK Canada US
% of primary and
secondary schools
37%
29%
1%
15%
7%
0%
12%
3%
0%
3%
0% 0%
1%
0% 0%
0%
5%
10%
15%
20%
25%
30%
35%
40%
Mathletics Reading Eggs IntoScience
Aus NZ UK Canada US
% of primary and
secondary students
% of primary students % of primary and
secondary students
21 April 2015
Consumer Services
3P Learning Limited.
Wilson HTM Equities Research – 3P Learning Limited. 18
3.5 NEW PRODUCTS
3PL currently has products which cover mathematics (Mathletics), literacy (Reading
Eggs), spelling (Spellodrome) and science (IntoScience).
IntoScience – a new online education category
3PL has potential to capture first mover advantage in online science education,
given that this is a relatively new segment.
IntoScience is 3PL’s latest product offering. It was fully launched into Australia and
New Zealand in 2014 and is set to be offered in all operational territories by 2016.
IntoScience is building considerable momentum, growing to 46,000 licences in
1H15, with prospectus forecasts of 98,000 by 2H15F.
3PL has potential to capture first
mover advantage in online science
education, given that this is a
relatively new category.
3.6 GLOBAL GROWTH
“The Americas”
The Americas are the key global growth focus for 3PL. In 1H15, the Americas (ie.
USA and Canada) contributed ~10% total licence revenue of A$18.4m.
At the end of FY14, 3PL had a 110 strong global salesforce. In 1H15, 3PL increases
its staff investment by ~A$1.5m, establishing a USA direct salesforce.
Chart 3 illustrates that 3PL has only penetrated ~1% of the USA schools population,
highlighting the size of the potential prize. Given 3PL has only penetrated 1% of US
schools with Mathletics, there is significant scope for strong licence growth as their
presence becomes more established.
The USA is a key target for growth.
3PL has only penetrated ~1% of
the USA schools population,
highlighting the size of the
potential prize.
Europe, Middle East, Africa (EMEA)
In 1H15, EMEA contributed ~23% of total licence revenue of $18.4m. The majority
of this revenue is from the UK.
In 2014, 3PL commenced the development of a Chinese language version of
Mathletics. The launch of this product may create first mover advantage in the
relatively underdeveloped Chinese online education sector.
3.7 ACQUISITIONS
3PL has potential to acquire value-adding bolt-on acquisitions. Some recent
acquisitions include:
In 1H14, 3PL acquired Whatiph. 3PL acquired Whatiph for A$1.3m plus an earn
out of up to $0.6m. Whatiph was a distributor of products including Mathletics
and Spellodrome in South Africa. As part of the agreement, Whatiph will
continue to be 3PL’s distributor of the products in South Africa and other parts
of southern Africa.
In 2014, 3PL acquired the remaining 35% of IntoScience.
In March 2015, 3PL acquired a 17% stake in US online education company
Desmos, for A$5m. Desmos provides a free online graphics calculator and
other mathematical activities for teachers and students. Desmos generates
revenue through publishing companies buying the right to integrate the online
calculator into their own digital textbooks. Desmos gives 3PL the opportunity to
diversify their mathematics business into calculator technology and related
activities, which primarily targets secondary students – a demographic of
perceived weakness for Mathletics and 3PL.
Other potential acquisitions include:
Product distributors, such as Whatiph.
Content creators, such as Blake Group (owner of Reading Eggs).
21 April 2015
Consumer Services
3P Learning Limited.
Wilson HTM Equities Research – 3P Learning Limited. 19
4. Business description
4.1 HISTORY
3PL listed on the ASX in July 2014 at $2.50 per share.
3PL was established in Australia in 2004 by Shane Hill and Matthew Sandblom,
initially only producing a Mathletics CD-ROM for student in grades Kindergarten-10.
3PL subsequently expanded into cloud based e-learning and broadened its product
offerings to also include:
Spelling (Spellodrome 2006).
Reading (Reading Eggs 2011).
Science (IntoScience 2013).
3PL also pursued an international and multi-lingual expansion, commencing
operations in:
 New Zealand (2006).
 Europe, the Middle East and Africa (EMEA) (2006).
 US (2007).
 Canada (2009).
 Hong Kong (2010).
In 2014, 3PL commenced the development of a Chinese language version of
Mathletics.
3PL was established in 2004 and
listed in 2014 at $2.50 per share.
4.2 BUSINESS MODEL
Business model
3PL provides online education products in numeracy, literacy and science. The
products are described below. The key products are Mathletics and Reading Eggs.
IntoScience is a new growth product and Spellodrome is an alternative to Reading
Eggs, but not an emphasis of 3PL.
Mathletics
Mathletics is 3PL’s flagship product. It is an interactive online numeracy program
which has captured substantial market share in Australian schools, with ~48% using
the product for at least one class. Mathletics generated ~84% of 1H15 licence
revenue of A$18.4m.
Reading Eggs and Reading Eggspress (“Reading Eggs products”)
Reading Eggs is a literacy program targeted at students in Kindergarden to Year 2,
providing a combination of interactive games, songs and animations. Reading
Eggspress is designed for Kindergarden to Year 6, and provides access to >1700
eBooks and related activities.
3PL does not own the Reading Eggs products. Instead, 3PL is merely a distributor
under a licence agreement with the Blake Group. 3PL pays a 40% sales royalty to
the Blake Group, with the Blake Group responsible for hosting the online platforms.
3PL has minimum sales volumes required under the contract, which are tested
annually at June year. Reading Eggs generated ~5% of 1H15 licence revenue of
A$18.4m.
Spellodrome
Spellodrome is a literacy program focused on increasing student engagement
through live competition amongst students and word games. It is not a core focus
on 3PL. Spellodrome generated $0.8m in 1H15, ~4% of 1H15 licence revenue.
Mathletics is 3PL’s flagship
product, generating ~84% 1H15
licence revenue.
Reading Eggs is sold under a
licence arrangement with the Blake
Group.
Spellodrome is not a key focus.
21 April 2015
Consumer Services
3P Learning Limited.
Wilson HTM Equities Research – 3P Learning Limited. 20
IntoScience
IntoScience targets secondary school students. It is the most recent of 3PL’s products
and is expected to be launched into all of 3PL’s main territories by 2016. It provides
simulations, experiments and activities to demonstrate scientific concepts to students.
In 1H15, it generated A$0.2m revenue.
IntoScience is a new product.
4.3 REVENUE MODEL
Revenue model
Products are sold on a per student basis in the form of Student and Home licences
that typically have a one year term
Approx. 91% of 3PL’s revenue is from Student Licences through schools. The
remaining ~9% of revenue is from the sale of Home Licences, copyright fees,
sponsorships and licensing agreements.
Revenue is generated by selling
one-year student and home
licences.
~91% revenue is from Student
Licences through schools.
Revenue mix
Table 6 summarises 3PL’s revenue mix by geography and product. .
TABLE 6: REVENUE MIX
Source: WHTM, 3PL
4.4 COMPETITION
Global competition
The global online education market is competitive and fragmented. Private equity
firms are quite active in this segment (refer Comparable Acquisitions Table 8). In
Australia and NZ, in contrast, 3PL has leading market positions with both Mathletics
and Reading Eggs.
There is a range of different business models/companies with potential to or
currently competing in the market. These companies include:
Traditional publishing companies such as Pearson Education, McGraw Hill,
and Oxford University Press. This group generates significant revenue from
printed materials and many are currently developing strategies for the online
learning segment including acquisitions, combined online/print offerings and
new online product development.
Online education resource companies such as Kahn Academy and
Dreambox. This group offers free or freemium (ie. free product with payment
required for feature upgrades) products. Many are focused on a particular
segment, geography or subject.
The global online education market
is competitive and fragmented.
In Australia and NZ, 3PL has
leading market share with
Mathletics and Reading Eggs.
A$M %FY14 FY14 %1H15 1H15
Revenue mix by geography
Aust & NZ 67.4% 24.6 66.8% 12.3
Europe, Mid-East, Africa (EMEA) 23.6% 8.6 22.8% 4.2
Americas 9.0% 3.3 10.3% 1.9
Totals 100.0% 36.5 100.0% 18.4
Revenue mix by product
Mathletics 78.3% 28.5 83.7% 15.4
Reading Eggs 11.0% 4.0 5.4% 1.0
Spellodrome 4.4% 1.6 4.3% 0.8
IntoScience 0.0% 0.0 1.1% 0.2
Other 6.3% 2.3 5.4% 1.0
Totals 100.0% 36.4 100.0% 18.4
21 April 2015
Consumer Services
3P Learning Limited.
Wilson HTM Equities Research – 3P Learning Limited. 21
Large software corporations such as Apple, Microsoft and Amazon. These
are well resourced organisation with the flexibility to offer a range of learning
tools.
Educational technology and platform providers such as Edmodo, Moodle
and Knewton. Some are open source; many offer free or freemium products
and cross-curricula virtual learning environments.
TABLE 7: A SELECTION OF CURRENT AND POTENTIAL COMPETITORS
Source: 3PL prospectus
Australian competition
Competition includes Skoolbo, Studyladder and Literacy Planet. We describe these
competitors below
Skoolbo
Skoolbo is an online provider of literacy and numeracy programs targeted at grades
Kindergarden – Year 4.
Shane Hill, the CEO and founder of Skoolbo, is a former teacher and was a 3PL co-
founder and employee until 2008.
Skoolbo has a high quality shareholder register. Skoolbo is backed by the University
of Wollongong, Save the Children and most recently Fairfax Media took a minority
stake (undisclosed quantum) in late 2014.
Skoolbo’s model is to give the product away to schools for free, with fees charged
for product upgrades. Skoolbo plans a Gold licence account upgrade in mid-2015. It
remains to be seen whether Skoolbo can actually monetise the high market share it
has claimed through its product give-away. It is a risky, but potentially disruptive,
business strategy. However, to date, its product features do not compare with the
quality of 3PL’s products.
Skoolbo is yet to prove the viability
of its “free then monetise” pricing
strategy.
Studyladder
Studyladder is a free but upgradable online education platform developed by
teachers offering programs including numeracy, literacy, science, language, art and
music. The programs have been adapted and expanded into 20 countries.
21 April 2015
Consumer Services
3P Learning Limited.
Wilson HTM Equities Research – 3P Learning Limited. 22
We do not consider Studyladder to be a substantial threat to 3PL for two reasons.
Studyladder has co-existed with 3PL in Australia for years whilst 3PL has
achieved outstanding licence and ARPU growth.
Studyladder is a much broader offering of a range of free products across a
range of disciplines, as opposed to 3PL’s more narrow, limited offering of higher
quality products.
We do not consider Studyladder to
be a substantial threat to 3PL
because it has co-existed with 3PL
for years, with limited adverse
impact on 3PL’s ongoing growth.
Literacy Planet
Intrepica (owner of Literacy Planet) was established in 2008.
Literacy Planet offers a product competing with Reading Eggs in the Australian &
New Zealand markets and has recently been recapitalised by significant investors
with online education experience. Investors include Ellerston Capital and Nine
Entertainment Co. Nine invested ~$6m in cash and advertising contras in July 2014
for a 30% stake, making it Intrepica’s largest single shareholder. Nine was
previously an investor in 3PL, but exited after Nine’s owner, CVC Asia Pacific,
required a quick exit to reduce debt.
Our initial view is that Literacy Planet will not adversely impact 3PL given
differences in:
Channel marketing strategics. Literacy Planet targets the K-9 demographic by
selling direct to consumers/parents (compared to 3PL’s focus on schools).
Product pricing. Literacy Planet is priced at ~$95 per annum, compared to 3PL
ARPU for Australia of A$10.21.
At this stage, the evidence suggests that 3PL has not been adversely impacted by
Literacy Planet, with Literacy Planet having only ~85,000 users across Australia and
overseas compared to 3PL’s 2.659m Australian & NZ licences.
Our initial view is that Literacy
Planet will not adversely impact
3PL.
USA competition
Competition includes Deambox, IXL, Amplify and Edmentum.
Dreambox
Dreambox operates predominantly in the United States and Canada offering a
similar numeracy product to Mathletics.
Similar to 3PL, it has received a number of innovation awards in the US and
appears to possess a high quality product like Mathletics.
Dreambox is priced at US$120 per annum direct to consumers, which will favour
3PL during its expansion into the Americas. It also sells directly into schools.
Mathletics is cheaper than
Dreambox.
IXL
IXL targets the K-12 demographic with an interactive eLearning numeracy product
which functions in a similar way to Dreambox and 3PL’s respective offerings. IXL
charges $79 per annum for direct annual licence use and also markets direct to
schools.
.
Amplify
One hurdle for Amplify is its pricing – it requires users to purchase its Amplify Tablet
for US$359 per user.
Amplify provides learning via its Android based Amplify Tablet in the US. It targets
the K-12 demographic but competes in a different manner to 3PL – it requires
schools to switch to its tablet for the products, instead of using any device.
Amplify’s advantage is its backers – it is backed by NewsCorp, which has invested
over US$500m in its products. However, its expansion is still in its early stages.
One hurdle for Amplify is that is
requires schools and students to
purchase its Amplify Tablet at
US$359 per tablet.
21 April 2015
Consumer Services
3P Learning Limited.
Wilson HTM Equities Research – 3P Learning Limited. 23
Edmentum
Edmentum will directly compete with 3PL in its planned expansion into the USA.
Edmentum operates an online learning platform in the USA with numeracy, literacy,
science and ESL products. It is also a distributor of Reading Eggs/Eggspress. 3PL
does not have the rights to distribute Reading Eggs in the USA.
Similar to 3PL, its product suite is interactive with teacher/parent ease of monitoring
student progress. It also facilitates tailored teaching to prevent ‘drop-outs’ and
enhance graduation rates, which is over and above the suite offered by 3PL.
Edmentum is a direct competitor to
3PL in its USA expansion plans.
4.5 INDUSTRY
Online education is a high growth sector. IBIS Capital predicts that the Prep-12
online education sector will quadruple in size from US$16.6 billion in 2012 to
US$69.0 billion in 2017
Key drivers of this tailwind are:
Increasing education spending by Governments seeking national competitive
advantage. For almost every OECD nation, education spending as a
percentage of GDP has increased from 2000 to 2011. Chart 5.
Transition from print to online resources.
Online education is a high growth
sector.
CHART 5: TRENDS IN EDUCATION SPENDING
21 April 2015
Consumer Services
3P Learning Limited.
Wilson HTM Equities Research – 3P Learning Limited. 24
5. Corporate
5.1 BOARD
Samuel Weiss, Independent Non-Executive Chairperson
Joined in June 2014. Mr Weiss has over 20 years of experience in senior
management and directorship roles, as well as broad experience in education,
technology and retail companies across the world. Mr Weiss’s other current
appointments include Chairman of Altium Limited and Independent Director of
Oroton Group Limited, Breville Group Limited and iBuy Limited.
Timothy Power, Chief Executive Officer
Mr Power has played a key role in 3PL since its early stages. Joined in 2004 and
became CEO in 2007. Mr Power has 15 years of experience in education
technology development, and was the co-founder of World Education Games, Into
Science Pty Ltd, ClickView Pty Ltd and Coraggio Pty Ltd.
Roger Amos, Independent Non-Executive Director
Joined in June 2014. Mr Amos possesses over 25 years of experience in finance,
business and accounting and was previously a partner at KPMG for 25 years.
Formerly a director of Austar United Communication Limited, Mr Amos’ other
current engagements include Non-Executive Director of REA Group Limited,
Chairman of Tyrian Diagnostics Limited and Deputy Chairman of Enero Group
Limited.
Claire Hatton, Independent Non-Executive Director
Joined in June 2014. Ms Hatton has over 20 years of experience in strategy, sales,
marketing and operations, including significant experience in the digital and
technology market. Ms Hatton has previously held senior positions at Google,
Travelport and Zuji.com.
CEO Tim Power has been with
3PL since 2004.
Roger Amos has online experience
at REA Group.
Claire Hatton has significant digital
and technology experience.
5.2 MANAGEMENT
Timothy Power, Chief Executive Officer
Refer description above.
Jonathan Kenny, Chief Financial Officer
Mr Kenny has over 20 years of experience in finance and operations roles for ASX
listed and multinational companies, as well as broad industry experience in fields
such as publishing, software, property development, data and analytics. Prior to
joining 3PL, Mr Kenny was CFO of RP Data Limited and Bravura Solutions Pty Ltd.
5.3 REGISTER
Table 8 summarises the pre-IPO and post-IPO shareholdings. The key points are:
CEO Tim Power holds 3.036 m shares.
Pascal Press owns 10.2% of 3PL.
3PL’s initial private equity backers, Macquaire Special Situations Master Fund
and Insight Venture Partners, have exited 3PL completely.
16.2% of ordinary shares (21.9m) will be held in escrow the day after 3PL’s
FY15 results release.
21 April 2015
Consumer Services
3P Learning Limited.
Wilson HTM Equities Research – 3P Learning Limited. 25
TABLE 8: SHARE REGISTER
16.2% of stock is in escrow until
FY15 results release.
Source: WHTM, 3PL prospectus
6. Risks and catalysts
6.1 UPSIDE RISKS
ARPU increases
An obvious upside risk for 3PL is increasing Australian & New Zealand ARPU from
~$10.21 (WHTM FY15F estimate) per user to ~$20 per user. We believe that this
re-pricing may be possible because:
Online education may eventually replace textbooks completely, which currently
retail in the range of $20-$60 per subject.
3PL successfully rolled out a +15% price increase in 1H15 in Australia, as
forecast in the prospectus, with “little impact on retention rates to date” (source:
1H15 investor presentation commentary, page 12).
Bolt-on acquisitions
3PL has already demonstrated a propensity to execute small bolt-on acquisitions
such as Whatiph, IntoScience and Desmos.
Sector growth
The online learning sector is expected to quadruple in size to US$69bn compared to
2012. Sector growth may exceed expectations.
New product momentum
IntoScience is 3PL’s fastest growing product in the emerging category of online
science education. In FY14, 3PL sold 46,650 IntoScience licences, a significant
increase from 4,000 licences in 2013. However, growth is still off a low base,
comprising only 1% of total FY14 licence numbers.
The IntoScience pilot program commenced in 2013 and was fully launched into
Australia for grades 7 and 8 in 2014. It is expected to be expanded into all of 3PL’s
operating territories by 2016.
6.2 DOWNSIDE RISKS
Blake Group licensing arrangement
Blake Group’s licensing arrangement with 3PL presents renewal and product quality
maintenance risks.
3PL has an agreement with the Blake Group to distribute the Reading Eggs
products, paying the Blake Group a 40% royalty. The risks are:
Blake Group’s licensing
arrangement with 3PL presents
renewal and product quality
maintenance risks.
21 April 2015
Consumer Services
3P Learning Limited.
Wilson HTM Equities Research – 3P Learning Limited. 26
This distribution agreement may be terminated.
The distribution agreement may by renewed on less favourable terms.
3PL has no control over maintenance of product quality.
3PL can only distribute Reading Eggs in Australia, New Zealand, UK, Ireland,
Malaysia, South Africa, Singapore, Hong Kong, Pakistan, Arabic-speaking nations,
International Schools worldwide (exc. US and Canada) and other markets as may
be agreed to on a case by case basis.
Technology risks
Use of technology presents inherent risks such as:
Data disruption from the hosting platforms.
Need to be interoperable with other technologies used by schools.
Data loss or theft.
These events could incur significant costs in rectification and reputational damage.
Competition
Global markets are fragmented and competitive.
In Australia &NZ, 3PL has leading market shares in Mathletics and Reading Eggs,
but the threat of emerging competition remains. In response, 3PL has the potential
to erect entry barriers over time, leveraging its leading market shares to capture the
network effect.
Customer churn
Increasing ARPU aggressively may lead to increased customer churn. However,
3PL noted it has increased its Australian prices by +15% from Feb 14 with “little
impact on retention rates to date”.
Government related risks
3PL is exposed to:
Changes in government policy pertaining to education providers and/or
education expenditure.
Government selection of a particular provider other than 3PL.
Changing curricula.
Key person risk
CEO Tim Power’s stock will be released from escrow around August 2015. It is not
clear what succession planning strategies may or may not currently be in place.
21 April 2015
Consumer Services
3P Learning Limited.
Wilson HTM Equities Research – 3P Learning Limited. 27
RETURN RE-INVESTMENT MATRIX RISK MEASURES
Return
High
Cash
Generator
Champion
Low
Challenged Potential
Low High
Re-investment
Low Med High Spec
Share
Price
Risk
Business
Risk
BUSINESS DESCRIPTION
3P Learning (3PL) is a global provider of interactive online learning software and is the dominant market firm in Australia, New Zealand and the UK.
Listed on the ASX in July 2014, 3PL is the only firm of its kind to have gone public in Australia. 3PL’s flagship product is Mathletics, with other
products in its suite including Reading Eggs, Spellodrome and, after a successful acquisition, IntoScience. The target demographic for 3PL’s
products remains grades Kindergarten-12. 3PL’s multi award-winning product suite and competitive pricing has provided for strong growth over the
past decade as well as expansion into key markets in North America and the Middle East. 3PL was founded in 2004 and is based in Sydney,
Australia.
INVESTMENT THESIS
We believe that 3PL is strongly positioned to capitalise on structural sector growth through its expanding market presence, brand recognition and
leading suite of products. 3PL occupies a dominant market position in ANZ as well as the UK, allowing for margin expansion by leveraging Mathletics
penetration to cross-sell products and increase ARPU. A foothold has been established in the key North America market which creates a significant
licence number growth opportunity. 3PL is in the process of developing Chinese language versions of their products, and the firm has high levels of
cash to pursue an aggressive expansion into China. The underlying reason for 3PL’s success remains the high quality of its product suite, and it is
our belief that this provides a unique competitive advantage which will create opportunities in its expansion markets. The new product momentum of
IntoScience will also drive earnings growth over time. 3PL possesses a capital light, highly scalable business model to provide a basis for margin
growth. When 3PL consolidates its positions in the new markets, there is scope for the utilisation of the pricing lever to boost ARPU, EBITDA and
margins further, as has been the case in ANZ. We believe 3PL will deliver strong earnings growth in the years to come as it c apitalises on structural
sector growth with its scalable business model and high quality products.
REVENUE DRIVERS BALANCE SHEET
 Increase the number of licences and school customers.
 Increase penetration of products in existing school customer
base.
 Cross-sell products to new and existing customers principally
leveraged off Mathletics.
 Improve ARPU through price increases over time.
 Cash: $15.81m
 Debt: $0
 Net debt: - $15.81m
MARGIN DRIVERS BOARD
 Number of licences.
 Increase in ARPU.
 Developing and maintaining product suite.
 Cross-selling products.
 Highly scalable software infrastructure
 Samuel Weiss, Independent Non-Executive Chairperson
 Timothy Power, Director & CEO
 Roger Amos, Independent NED
 Claire Hatton, Independent NED
KEY ISSUES/CATALYSTS MANAGEMENT
 ARPU increases over time boosting EBITDA and margins.
 Strong structural sector growth.
 New product momentum of IntoScience.
 US expansion into huge market.
 Consolidation of EMEA operations should drive margin.
 Medium-long term expansion into China.
 Timothy Power, CEO
 Jonathan Kenny, CFO and Company Secretary
RISK TO VIEW CONTACT DETAILS
 Competition, particularly in the US, restricting licence and
ARPU growth.
 Technology being superseded and/or internal software
breakdown.
 Regulatory changes affecting education spending and/or
online education providers.
 Customer churn with price increases.
 Reading Eggs distribution agreement with Blake Group
breaking down or becoming unfavourable.
 Personnel risk. Losing Tim Power or a failure to innovate.
Address: Level 18, 124 Walker St, North Sydney NSW 2060 Australia
Phone: 1300 850 331
Website: www.3plearning.com
21 April 2015
Consumer Services
3P Learning Limited.
Wilson HTM Equities Research – 3P Learning Limited. 28
Head of Research Head of Institutional Sales
Shane Storey (07) 3212 1351 Richard Moulder (02) 8247 6603
Industrials Sydney
James Ferrier (03) 9640 3827 Jonathan Scales (02) 8247 6613
Stewart Oldfield (03) 9640 3818 Duncan Gamble (02) 8247 6629
George Gabriel (03) 9640 3864 Michael Pegum (02) 8247 6602
Andrew Dalziel (07) 3212 1946 Anthony Wilson (02) 8247 3113
Liam Schofield (02) 8247 3173 Peter Tebbutt (02) 8247 6682
Healthcare and Biotechnology Melbourne
Shane Storey (07) 3212 1351 David Permezel (03) 9640 3885
Joseph Michael (02) 8247 3101 Adam Dellaway (03) 9640 3824
Resources
Phillip Chippindale (02) 8247 3149 Wealth Management Research
James Redfern (02) 8247 6609 Peter McManus (02) 8247 3186
Quantitative John Lockton (02) 8247 3118
Nathan Szeitli (03) 9640 3806 Rebecca Sandys (02) 8247 6670
Email: firstname.lastname@wilsonhtm.com.au
National Offices
Brisbane Ph: (07) 3212 1333
Sydney Ph: (02) 8247 6600
Melbourne Ph: (03) 9640 3888
Gold Coast Ph: (07) 5509 5500
Dalby Ph: (07) 4660 8000
Hervey Bay Ph: (07) 4197 1600
Our website: www.wilsonhtm.com.au
Return Reinvestment Matrix and Risk Measures
Definitions at http://www.wilsonhtm.com.au/Disclosures
Recommendation Structure and Other Definitions
Definitions at http://www.wilsonhtm.com.au/Disclosures
Disclaimer
Whilst Wilson HTM Ltd believes the information contained in this communication is based on reliable information, no warranty is
given as to its accuracy and persons relying on this information do so at their own risk.To the extent permitted by law Wilson HTM
Ltd disclaims all liability to any person relying on the information contained in this communication in respect of any loss or damage
(including consequential loss or damage) however caused, which may be suffered or arise directly or indirectly in respect of such
information.Any projections contained in this communication are estimates only.Such projections are subject to market influences
and contingent upon matters outside the control of Wilson HTM Ltd and therefore may not be realised in the future.
The advice contained in this document is general advice.It has been prepared without taking account of any person’s objectives,
financial situation or needs and because of that, any person should, before acting on the advice, consider the appropriateness of
the advice, having regard to the client’s objectives, financial situation and needs.Those acting upon such information without first
consulting one of Wilson HTM Ltd investment advisors do so entirely at their own risk.This report does not constitute an offer or
invitation to purchase any securities and should not be relied upon in connection with any contract or commitment whatsoever.If the
advice relates to the acquisition, or possible acquisition, of a particular financial product – the client should obtain a Product
Disclosure Statement relating to the product and consider the Statement before making any decision about whether to acquire the
product.This communication is not to be disclosed in whole or part or used by any other party without Wilson HTM Ltd’s prior
written consent.
Disclosure of Interest. 3P Learning Limited.
The Directors of Wilson HTM Ltd advise that at the date of this report they and their associates have relevant interests in 3P
Learning Limited.. They also advise that Wilson HTM Ltd and Wilson HTM Corporate Finance Ltd A.B.N. 65 057 547 323 and their
associates have received and may receive commissions or fees from 3P Learning Limited. in relation to advice or dealings in
securities.Some or all of Wilson HTM Ltd authorised representatives may be remunerated wholly or partly by way of commission.
In producing research reports, members of Wilson HTM Ltd Research may attend site visits and other meetings hosted by the
issuers the subject of its research reports. In some instances the costs of such site visits or meetings may be met in part or in whole
by the issuers concerned if Wilson HTM Ltd considers it is appropriate and reasonable in the specific circumstances relating to the
site visit or meeting.
Please see disclosures at http://www.wilsonhtm.com.au/Disclosures. Disclosures applicable to companies included in this reportcan
be found in the latest relevant published research.

More Related Content

What's hot

Vietnam Top stocks pick 2019 11.01.2019
Vietnam Top stocks pick 2019  11.01.2019Vietnam Top stocks pick 2019  11.01.2019
Vietnam Top stocks pick 2019 11.01.2019Long Tran
 
Results Overview Q1 2016
Results Overview Q1 2016Results Overview Q1 2016
Results Overview Q1 2016Factstories
 
Carolyn Fisher_SWHC Final Presentation
Carolyn Fisher_SWHC Final PresentationCarolyn Fisher_SWHC Final Presentation
Carolyn Fisher_SWHC Final PresentationCarrie Fisher
 
1st protective webinar
1st protective webinar1st protective webinar
1st protective webinareh3k
 
FCF Pitch UPDATED, Carolyn Fisher
FCF Pitch UPDATED, Carolyn FisherFCF Pitch UPDATED, Carolyn Fisher
FCF Pitch UPDATED, Carolyn FisherCarrie Fisher
 
Data extract jul-2010 qbe business sentiment survey
Data extract jul-2010 qbe business sentiment surveyData extract jul-2010 qbe business sentiment survey
Data extract jul-2010 qbe business sentiment surveyQBE European Operations
 
15 jul 10.qbe business sentiment survey jul 2010 - data extract
15 jul 10.qbe business sentiment survey   jul 2010 - data extract15 jul 10.qbe business sentiment survey   jul 2010 - data extract
15 jul 10.qbe business sentiment survey jul 2010 - data extractQBE European Operations
 
Xilin_Structured_Products_Group_Presentation
Xilin_Structured_Products_Group_PresentationXilin_Structured_Products_Group_Presentation
Xilin_Structured_Products_Group_PresentationXilin(Lynn) Wang, CFA
 
M&A Case Competition presentation
M&A Case Competition presentationM&A Case Competition presentation
M&A Case Competition presentationLu Minghui
 
Ratio analysis on Pharmaceutical Companies: A study of Bangladesh
Ratio analysis on Pharmaceutical Companies: A study of BangladeshRatio analysis on Pharmaceutical Companies: A study of Bangladesh
Ratio analysis on Pharmaceutical Companies: A study of BangladeshAL Babur Rahman
 
Value based management of Union pacific corp and UPS
Value based management of Union pacific corp and UPSValue based management of Union pacific corp and UPS
Value based management of Union pacific corp and UPSSayedSadullahSadat
 
Equity bazaar 13.07.2016
Equity bazaar 13.07.2016Equity bazaar 13.07.2016
Equity bazaar 13.07.2016Choice Equity
 
CFA_Seattle_Team 7_Presentation
CFA_Seattle_Team 7_PresentationCFA_Seattle_Team 7_Presentation
CFA_Seattle_Team 7_PresentationJin Hongzi
 
2020 Investment Outlook: Risks and Opportunities for Investors in Global Markets
2020 Investment Outlook: Risks and Opportunities for Investors in Global Markets2020 Investment Outlook: Risks and Opportunities for Investors in Global Markets
2020 Investment Outlook: Risks and Opportunities for Investors in Global MarketsMaxine Elliott
 
Before the Open March 24 2017
Before the Open March 24 2017Before the Open March 24 2017
Before the Open March 24 2017John Pendrith
 
Indexed Universal Life Insurance
Indexed Universal Life InsuranceIndexed Universal Life Insurance
Indexed Universal Life InsuranceCharles Ruppert
 

What's hot (19)

Vietnam Top stocks pick 2019 11.01.2019
Vietnam Top stocks pick 2019  11.01.2019Vietnam Top stocks pick 2019  11.01.2019
Vietnam Top stocks pick 2019 11.01.2019
 
Results Overview Q1 2016
Results Overview Q1 2016Results Overview Q1 2016
Results Overview Q1 2016
 
Carolyn Fisher_SWHC Final Presentation
Carolyn Fisher_SWHC Final PresentationCarolyn Fisher_SWHC Final Presentation
Carolyn Fisher_SWHC Final Presentation
 
1st protective webinar
1st protective webinar1st protective webinar
1st protective webinar
 
FCF Pitch UPDATED, Carolyn Fisher
FCF Pitch UPDATED, Carolyn FisherFCF Pitch UPDATED, Carolyn Fisher
FCF Pitch UPDATED, Carolyn Fisher
 
Analyst presentation q2 2018 v13
Analyst presentation   q2 2018 v13Analyst presentation   q2 2018 v13
Analyst presentation q2 2018 v13
 
Data extract jul-2010 qbe business sentiment survey
Data extract jul-2010 qbe business sentiment surveyData extract jul-2010 qbe business sentiment survey
Data extract jul-2010 qbe business sentiment survey
 
15 jul 10.qbe business sentiment survey jul 2010 - data extract
15 jul 10.qbe business sentiment survey   jul 2010 - data extract15 jul 10.qbe business sentiment survey   jul 2010 - data extract
15 jul 10.qbe business sentiment survey jul 2010 - data extract
 
Xilin_Structured_Products_Group_Presentation
Xilin_Structured_Products_Group_PresentationXilin_Structured_Products_Group_Presentation
Xilin_Structured_Products_Group_Presentation
 
M&A Case Competition presentation
M&A Case Competition presentationM&A Case Competition presentation
M&A Case Competition presentation
 
Ratio analysis on Pharmaceutical Companies: A study of Bangladesh
Ratio analysis on Pharmaceutical Companies: A study of BangladeshRatio analysis on Pharmaceutical Companies: A study of Bangladesh
Ratio analysis on Pharmaceutical Companies: A study of Bangladesh
 
Value based management of Union pacific corp and UPS
Value based management of Union pacific corp and UPSValue based management of Union pacific corp and UPS
Value based management of Union pacific corp and UPS
 
UBS Project Presentation
UBS Project PresentationUBS Project Presentation
UBS Project Presentation
 
Equity bazaar 13.07.2016
Equity bazaar 13.07.2016Equity bazaar 13.07.2016
Equity bazaar 13.07.2016
 
CFA_Seattle_Team 7_Presentation
CFA_Seattle_Team 7_PresentationCFA_Seattle_Team 7_Presentation
CFA_Seattle_Team 7_Presentation
 
2020 Investment Outlook: Risks and Opportunities for Investors in Global Markets
2020 Investment Outlook: Risks and Opportunities for Investors in Global Markets2020 Investment Outlook: Risks and Opportunities for Investors in Global Markets
2020 Investment Outlook: Risks and Opportunities for Investors in Global Markets
 
University of Toronto - St. George - Presentation
University of Toronto - St. George - PresentationUniversity of Toronto - St. George - Presentation
University of Toronto - St. George - Presentation
 
Before the Open March 24 2017
Before the Open March 24 2017Before the Open March 24 2017
Before the Open March 24 2017
 
Indexed Universal Life Insurance
Indexed Universal Life InsuranceIndexed Universal Life Insurance
Indexed Universal Life Insurance
 

Similar to 3PL - equity research - initiation report

Infomedia (IFM) - equity research initiation report
Infomedia (IFM) - equity research initiation reportInfomedia (IFM) - equity research initiation report
Infomedia (IFM) - equity research initiation reportGeorge Gabriel
 
Citadel Group (CGL) - initiation report - latent value in a trusted it servic...
Citadel Group (CGL) - initiation report - latent value in a trusted it servic...Citadel Group (CGL) - initiation report - latent value in a trusted it servic...
Citadel Group (CGL) - initiation report - latent value in a trusted it servic...George Gabriel
 
Firstsource 1QFY18
Firstsource 1QFY18Firstsource 1QFY18
Firstsource 1QFY18Mohit Jn
 
FSOL 1QFY18
FSOL 1QFY18FSOL 1QFY18
FSOL 1QFY18Mohit Jn
 
Dr. Reddy's 1FY15: Strong sales in key markets drive growth, margins
 Dr. Reddy's 1FY15: Strong sales in key markets drive growth, margins Dr. Reddy's 1FY15: Strong sales in key markets drive growth, margins
Dr. Reddy's 1FY15: Strong sales in key markets drive growth, marginsIndiaNotes.com
 
Japara (JHC) equity research initiation report - riding the silver tsunami -...
Japara (JHC) equity research initiation report  - riding the silver tsunami -...Japara (JHC) equity research initiation report  - riding the silver tsunami -...
Japara (JHC) equity research initiation report - riding the silver tsunami -...George Gabriel
 
BT Funds Management - bigger, better, bolder BT - 20130501
BT Funds Management - bigger, better, bolder BT - 20130501BT Funds Management - bigger, better, bolder BT - 20130501
BT Funds Management - bigger, better, bolder BT - 20130501George Gabriel
 
BTT - bigger better bolder BT - 20130501
BTT -  bigger better bolder BT - 20130501BTT -  bigger better bolder BT - 20130501
BTT - bigger better bolder BT - 20130501George Gabriel
 
Financial services sector - implications of FOFA, possible acquires of SFW, S...
Financial services sector - implications of FOFA, possible acquires of SFW, S...Financial services sector - implications of FOFA, possible acquires of SFW, S...
Financial services sector - implications of FOFA, possible acquires of SFW, S...George Gabriel
 
SFW - FOFA implications, Sum of parts valuation, possible acquirers
SFW - FOFA implications, Sum of parts valuation, possible acquirers SFW - FOFA implications, Sum of parts valuation, possible acquirers
SFW - FOFA implications, Sum of parts valuation, possible acquirers George Gabriel
 
Flight Centre Travel Group (FLT:ASX)
Flight Centre Travel Group (FLT:ASX)Flight Centre Travel Group (FLT:ASX)
Flight Centre Travel Group (FLT:ASX)Som Ranga
 
Wessanen q3 2014 trading update
Wessanen q3 2014 trading updateWessanen q3 2014 trading update
Wessanen q3 2014 trading updateKlaus Arntz
 
Investing Concept Of Risk And Return PowerPoint Presentation Slides
Investing Concept Of Risk And Return PowerPoint Presentation Slides Investing Concept Of Risk And Return PowerPoint Presentation Slides
Investing Concept Of Risk And Return PowerPoint Presentation Slides SlideTeam
 
Delta Galil Reports Record 2015 First Quarter Results
Delta Galil Reports Record 2015 First Quarter ResultsDelta Galil Reports Record 2015 First Quarter Results
Delta Galil Reports Record 2015 First Quarter ResultsClutch animation house
 
Nirmal pi industries_03_aug15
Nirmal pi industries_03_aug15Nirmal pi industries_03_aug15
Nirmal pi industries_03_aug15IndiaNotes.com
 
Q4 FY 2015 Results Presentation
Q4 FY 2015 Results PresentationQ4 FY 2015 Results Presentation
Q4 FY 2015 Results Presentationnordangliair
 
Britannia Industries 1QFY15 results ahead of estimate; buy - Motilal Oswal
Britannia Industries 1QFY15 results ahead of estimate; buy - Motilal OswalBritannia Industries 1QFY15 results ahead of estimate; buy - Motilal Oswal
Britannia Industries 1QFY15 results ahead of estimate; buy - Motilal OswalIndiaNotes.com
 
Financial Statement Analysis Powerpoint Presentation Slides
Financial Statement Analysis Powerpoint Presentation SlidesFinancial Statement Analysis Powerpoint Presentation Slides
Financial Statement Analysis Powerpoint Presentation SlidesSlideTeam
 

Similar to 3PL - equity research - initiation report (20)

Infomedia (IFM) - equity research initiation report
Infomedia (IFM) - equity research initiation reportInfomedia (IFM) - equity research initiation report
Infomedia (IFM) - equity research initiation report
 
Citadel Group (CGL) - initiation report - latent value in a trusted it servic...
Citadel Group (CGL) - initiation report - latent value in a trusted it servic...Citadel Group (CGL) - initiation report - latent value in a trusted it servic...
Citadel Group (CGL) - initiation report - latent value in a trusted it servic...
 
IFM - optionality
IFM - optionality IFM - optionality
IFM - optionality
 
Firstsource 1QFY18
Firstsource 1QFY18Firstsource 1QFY18
Firstsource 1QFY18
 
FSOL 1QFY18
FSOL 1QFY18FSOL 1QFY18
FSOL 1QFY18
 
Dr. Reddy's 1FY15: Strong sales in key markets drive growth, margins
 Dr. Reddy's 1FY15: Strong sales in key markets drive growth, margins Dr. Reddy's 1FY15: Strong sales in key markets drive growth, margins
Dr. Reddy's 1FY15: Strong sales in key markets drive growth, margins
 
Japara (JHC) equity research initiation report - riding the silver tsunami -...
Japara (JHC) equity research initiation report  - riding the silver tsunami -...Japara (JHC) equity research initiation report  - riding the silver tsunami -...
Japara (JHC) equity research initiation report - riding the silver tsunami -...
 
CrowdInvest
CrowdInvestCrowdInvest
CrowdInvest
 
BT Funds Management - bigger, better, bolder BT - 20130501
BT Funds Management - bigger, better, bolder BT - 20130501BT Funds Management - bigger, better, bolder BT - 20130501
BT Funds Management - bigger, better, bolder BT - 20130501
 
BTT - bigger better bolder BT - 20130501
BTT -  bigger better bolder BT - 20130501BTT -  bigger better bolder BT - 20130501
BTT - bigger better bolder BT - 20130501
 
Financial services sector - implications of FOFA, possible acquires of SFW, S...
Financial services sector - implications of FOFA, possible acquires of SFW, S...Financial services sector - implications of FOFA, possible acquires of SFW, S...
Financial services sector - implications of FOFA, possible acquires of SFW, S...
 
SFW - FOFA implications, Sum of parts valuation, possible acquirers
SFW - FOFA implications, Sum of parts valuation, possible acquirers SFW - FOFA implications, Sum of parts valuation, possible acquirers
SFW - FOFA implications, Sum of parts valuation, possible acquirers
 
Flight Centre Travel Group (FLT:ASX)
Flight Centre Travel Group (FLT:ASX)Flight Centre Travel Group (FLT:ASX)
Flight Centre Travel Group (FLT:ASX)
 
Wessanen q3 2014 trading update
Wessanen q3 2014 trading updateWessanen q3 2014 trading update
Wessanen q3 2014 trading update
 
Investing Concept Of Risk And Return PowerPoint Presentation Slides
Investing Concept Of Risk And Return PowerPoint Presentation Slides Investing Concept Of Risk And Return PowerPoint Presentation Slides
Investing Concept Of Risk And Return PowerPoint Presentation Slides
 
Delta Galil Reports Record 2015 First Quarter Results
Delta Galil Reports Record 2015 First Quarter ResultsDelta Galil Reports Record 2015 First Quarter Results
Delta Galil Reports Record 2015 First Quarter Results
 
Nirmal pi industries_03_aug15
Nirmal pi industries_03_aug15Nirmal pi industries_03_aug15
Nirmal pi industries_03_aug15
 
Q4 FY 2015 Results Presentation
Q4 FY 2015 Results PresentationQ4 FY 2015 Results Presentation
Q4 FY 2015 Results Presentation
 
Britannia Industries 1QFY15 results ahead of estimate; buy - Motilal Oswal
Britannia Industries 1QFY15 results ahead of estimate; buy - Motilal OswalBritannia Industries 1QFY15 results ahead of estimate; buy - Motilal Oswal
Britannia Industries 1QFY15 results ahead of estimate; buy - Motilal Oswal
 
Financial Statement Analysis Powerpoint Presentation Slides
Financial Statement Analysis Powerpoint Presentation SlidesFinancial Statement Analysis Powerpoint Presentation Slides
Financial Statement Analysis Powerpoint Presentation Slides
 

More from George Gabriel

Adveritas (AV1) - Is Adveritas the next Dubber (DUB)
Adveritas (AV1) - Is Adveritas the next Dubber (DUB) Adveritas (AV1) - Is Adveritas the next Dubber (DUB)
Adveritas (AV1) - Is Adveritas the next Dubber (DUB) George Gabriel
 
Adveritas (AV1) - ARR Growth Tracker
Adveritas (AV1) - ARR Growth Tracker Adveritas (AV1) - ARR Growth Tracker
Adveritas (AV1) - ARR Growth Tracker George Gabriel
 
STOCK SNAPSHOT - De.mem Limited - Water treatment tech with growing recurring...
STOCK SNAPSHOT - De.mem Limited - Water treatment tech with growing recurring...STOCK SNAPSHOT - De.mem Limited - Water treatment tech with growing recurring...
STOCK SNAPSHOT - De.mem Limited - Water treatment tech with growing recurring...George Gabriel
 
Wilsons Aged care, Health services and Retirement villages conference monda...
Wilsons Aged care, Health services and Retirement villages conference   monda...Wilsons Aged care, Health services and Retirement villages conference   monda...
Wilsons Aged care, Health services and Retirement villages conference monda...George Gabriel
 
LatAm Autos (LAA) - Investor Presentation - 24 October 2017
LatAm Autos (LAA) -  Investor Presentation - 24 October 2017LatAm Autos (LAA) -  Investor Presentation - 24 October 2017
LatAm Autos (LAA) - Investor Presentation - 24 October 2017George Gabriel
 
Henderson Global Group (HGG) - equity research initiation report
Henderson Global Group (HGG) - equity research initiation reportHenderson Global Group (HGG) - equity research initiation report
Henderson Global Group (HGG) - equity research initiation reportGeorge Gabriel
 
Aged care sector - reviewing the investment case - 190215
Aged care sector - reviewing the investment case - 190215  Aged care sector - reviewing the investment case - 190215
Aged care sector - reviewing the investment case - 190215 George Gabriel
 
More Bank for your Buck - NAB
More Bank for your Buck - NAB More Bank for your Buck - NAB
More Bank for your Buck - NAB George Gabriel
 
Tech Mpire (TMP) Business Overview - August 2017
Tech Mpire (TMP) Business Overview - August 2017 Tech Mpire (TMP) Business Overview - August 2017
Tech Mpire (TMP) Business Overview - August 2017 George Gabriel
 
Tech Mpire (TMP) - Product Presentation - July 2017
Tech Mpire (TMP) - Product Presentation - July 2017 Tech Mpire (TMP) - Product Presentation - July 2017
Tech Mpire (TMP) - Product Presentation - July 2017 George Gabriel
 
Evolution of value investing - all roads lead to Graham and Doddsville
Evolution of value investing - all roads lead to Graham and DoddsvilleEvolution of value investing - all roads lead to Graham and Doddsville
Evolution of value investing - all roads lead to Graham and DoddsvilleGeorge Gabriel
 
MONEY IN THE BANK - bank sector outlook
MONEY IN THE BANK - bank sector outlook MONEY IN THE BANK - bank sector outlook
MONEY IN THE BANK - bank sector outlook George Gabriel
 
10 reasons we recommend NAB
10 reasons we recommend NAB 10 reasons we recommend NAB
10 reasons we recommend NAB George Gabriel
 
Bendigo Bank (EBN) - finding an earnings base
Bendigo Bank (EBN) - finding an earnings base Bendigo Bank (EBN) - finding an earnings base
Bendigo Bank (EBN) - finding an earnings base George Gabriel
 
George Gabriel presentation - Digital Disruptors Conference 2015
George Gabriel presentation - Digital Disruptors Conference 2015 George Gabriel presentation - Digital Disruptors Conference 2015
George Gabriel presentation - Digital Disruptors Conference 2015 George Gabriel
 
Computershare (CPU) initiation report - well-priced quality franchise with fr...
Computershare (CPU) initiation report - well-priced quality franchise with fr...Computershare (CPU) initiation report - well-priced quality franchise with fr...
Computershare (CPU) initiation report - well-priced quality franchise with fr...George Gabriel
 
MMS - earnings implications of management equity incentives
MMS - earnings implications of management equity incentivesMMS - earnings implications of management equity incentives
MMS - earnings implications of management equity incentivesGeorge Gabriel
 
FSA - equity research initiation report
FSA - equity research initiation reportFSA - equity research initiation report
FSA - equity research initiation reportGeorge Gabriel
 
Bank stock analytical framework
Bank stock analytical frameworkBank stock analytical framework
Bank stock analytical frameworkGeorge Gabriel
 

More from George Gabriel (20)

Adveritas (AV1) - Is Adveritas the next Dubber (DUB)
Adveritas (AV1) - Is Adveritas the next Dubber (DUB) Adveritas (AV1) - Is Adveritas the next Dubber (DUB)
Adveritas (AV1) - Is Adveritas the next Dubber (DUB)
 
Adveritas (AV1) - ARR Growth Tracker
Adveritas (AV1) - ARR Growth Tracker Adveritas (AV1) - ARR Growth Tracker
Adveritas (AV1) - ARR Growth Tracker
 
STOCK SNAPSHOT - De.mem Limited - Water treatment tech with growing recurring...
STOCK SNAPSHOT - De.mem Limited - Water treatment tech with growing recurring...STOCK SNAPSHOT - De.mem Limited - Water treatment tech with growing recurring...
STOCK SNAPSHOT - De.mem Limited - Water treatment tech with growing recurring...
 
Wilsons Aged care, Health services and Retirement villages conference monda...
Wilsons Aged care, Health services and Retirement villages conference   monda...Wilsons Aged care, Health services and Retirement villages conference   monda...
Wilsons Aged care, Health services and Retirement villages conference monda...
 
LatAm Autos (LAA) - Investor Presentation - 24 October 2017
LatAm Autos (LAA) -  Investor Presentation - 24 October 2017LatAm Autos (LAA) -  Investor Presentation - 24 October 2017
LatAm Autos (LAA) - Investor Presentation - 24 October 2017
 
Henderson Global Group (HGG) - equity research initiation report
Henderson Global Group (HGG) - equity research initiation reportHenderson Global Group (HGG) - equity research initiation report
Henderson Global Group (HGG) - equity research initiation report
 
Aged care sector - reviewing the investment case - 190215
Aged care sector - reviewing the investment case - 190215  Aged care sector - reviewing the investment case - 190215
Aged care sector - reviewing the investment case - 190215
 
More Bank for your Buck - NAB
More Bank for your Buck - NAB More Bank for your Buck - NAB
More Bank for your Buck - NAB
 
Tech Mpire (TMP) Business Overview - August 2017
Tech Mpire (TMP) Business Overview - August 2017 Tech Mpire (TMP) Business Overview - August 2017
Tech Mpire (TMP) Business Overview - August 2017
 
Tech Mpire (TMP) - Product Presentation - July 2017
Tech Mpire (TMP) - Product Presentation - July 2017 Tech Mpire (TMP) - Product Presentation - July 2017
Tech Mpire (TMP) - Product Presentation - July 2017
 
Evolution of value investing - all roads lead to Graham and Doddsville
Evolution of value investing - all roads lead to Graham and DoddsvilleEvolution of value investing - all roads lead to Graham and Doddsville
Evolution of value investing - all roads lead to Graham and Doddsville
 
MONEY IN THE BANK - bank sector outlook
MONEY IN THE BANK - bank sector outlook MONEY IN THE BANK - bank sector outlook
MONEY IN THE BANK - bank sector outlook
 
10 reasons we recommend NAB
10 reasons we recommend NAB 10 reasons we recommend NAB
10 reasons we recommend NAB
 
Bendigo Bank (EBN) - finding an earnings base
Bendigo Bank (EBN) - finding an earnings base Bendigo Bank (EBN) - finding an earnings base
Bendigo Bank (EBN) - finding an earnings base
 
George Gabriel presentation - Digital Disruptors Conference 2015
George Gabriel presentation - Digital Disruptors Conference 2015 George Gabriel presentation - Digital Disruptors Conference 2015
George Gabriel presentation - Digital Disruptors Conference 2015
 
Computershare (CPU) initiation report - well-priced quality franchise with fr...
Computershare (CPU) initiation report - well-priced quality franchise with fr...Computershare (CPU) initiation report - well-priced quality franchise with fr...
Computershare (CPU) initiation report - well-priced quality franchise with fr...
 
MMS - earnings implications of management equity incentives
MMS - earnings implications of management equity incentivesMMS - earnings implications of management equity incentives
MMS - earnings implications of management equity incentives
 
FSA - equity research initiation report
FSA - equity research initiation reportFSA - equity research initiation report
FSA - equity research initiation report
 
BUY Australian Banks
BUY Australian BanksBUY Australian Banks
BUY Australian Banks
 
Bank stock analytical framework
Bank stock analytical frameworkBank stock analytical framework
Bank stock analytical framework
 

Recently uploaded

CALL ON ➥8923113531 🔝Call Girls Vineet Khand Lucknow best Night Fun service 🧦
CALL ON ➥8923113531 🔝Call Girls Vineet Khand Lucknow best Night Fun service  🧦CALL ON ➥8923113531 🔝Call Girls Vineet Khand Lucknow best Night Fun service  🧦
CALL ON ➥8923113531 🔝Call Girls Vineet Khand Lucknow best Night Fun service 🧦anilsa9823
 
Cyberagent_For New Investors_EN_240424.pdf
Cyberagent_For New Investors_EN_240424.pdfCyberagent_For New Investors_EN_240424.pdf
Cyberagent_For New Investors_EN_240424.pdfCyberAgent, Inc.
 
High Profile Call Girls Kolkata Gayatri 🤌 8250192130 🚀 Vip Call Girls Kolkata
High Profile Call Girls Kolkata Gayatri 🤌  8250192130 🚀 Vip Call Girls KolkataHigh Profile Call Girls Kolkata Gayatri 🤌  8250192130 🚀 Vip Call Girls Kolkata
High Profile Call Girls Kolkata Gayatri 🤌 8250192130 🚀 Vip Call Girls Kolkataanamikaraghav4
 
Short-, Mid-, and Long-term gxxoals.pptx
Short-, Mid-, and Long-term gxxoals.pptxShort-, Mid-, and Long-term gxxoals.pptx
Short-, Mid-, and Long-term gxxoals.pptxHenryBriggs2
 
Methanex Investor Presentation (April 2024)
Methanex Investor Presentation (April 2024)Methanex Investor Presentation (April 2024)
Methanex Investor Presentation (April 2024)Methanex Corporation
 
如何办理(UTS毕业证书)悉尼科技大学毕业证学位证书
如何办理(UTS毕业证书)悉尼科技大学毕业证学位证书如何办理(UTS毕业证书)悉尼科技大学毕业证学位证书
如何办理(UTS毕业证书)悉尼科技大学毕业证学位证书Fis s
 
VIP 7001035870 Find & Meet Hyderabad Call Girls Abids high-profile Call Girl
VIP 7001035870 Find & Meet Hyderabad Call Girls Abids high-profile Call GirlVIP 7001035870 Find & Meet Hyderabad Call Girls Abids high-profile Call Girl
VIP 7001035870 Find & Meet Hyderabad Call Girls Abids high-profile Call Girladitipandeya
 
VIP Call Girl Amritsar 7001035870 Enjoy Call Girls With Our Escorts
VIP Call Girl Amritsar 7001035870 Enjoy Call Girls With Our EscortsVIP Call Girl Amritsar 7001035870 Enjoy Call Girls With Our Escorts
VIP Call Girl Amritsar 7001035870 Enjoy Call Girls With Our Escortssonatiwari757
 
OKC Thunder Reveal Game 2 Playoff T Shirts
OKC Thunder Reveal Game 2 Playoff T ShirtsOKC Thunder Reveal Game 2 Playoff T Shirts
OKC Thunder Reveal Game 2 Playoff T Shirtsrahman018755
 
Q3 FY24 Earnings Conference Call Presentation
Q3 FY24 Earnings Conference Call PresentationQ3 FY24 Earnings Conference Call Presentation
Q3 FY24 Earnings Conference Call PresentationSysco_Investors
 
Malad Escorts, (Pooja 09892124323), Malad Call Girls Service
Malad Escorts, (Pooja 09892124323), Malad Call Girls ServiceMalad Escorts, (Pooja 09892124323), Malad Call Girls Service
Malad Escorts, (Pooja 09892124323), Malad Call Girls ServicePooja Nehwal
 

Recently uploaded (20)

Rohini Sector 17 Call Girls Delhi 9999965857 @Sabina Saikh No Advance
Rohini Sector 17 Call Girls Delhi 9999965857 @Sabina Saikh No AdvanceRohini Sector 17 Call Girls Delhi 9999965857 @Sabina Saikh No Advance
Rohini Sector 17 Call Girls Delhi 9999965857 @Sabina Saikh No Advance
 
CALL ON ➥8923113531 🔝Call Girls Vineet Khand Lucknow best Night Fun service 🧦
CALL ON ➥8923113531 🔝Call Girls Vineet Khand Lucknow best Night Fun service  🧦CALL ON ➥8923113531 🔝Call Girls Vineet Khand Lucknow best Night Fun service  🧦
CALL ON ➥8923113531 🔝Call Girls Vineet Khand Lucknow best Night Fun service 🧦
 
Cyberagent_For New Investors_EN_240424.pdf
Cyberagent_For New Investors_EN_240424.pdfCyberagent_For New Investors_EN_240424.pdf
Cyberagent_For New Investors_EN_240424.pdf
 
Model Call Girl in Uttam Nagar Delhi reach out to us at 🔝9953056974🔝
Model Call Girl in Uttam Nagar Delhi reach out to us at 🔝9953056974🔝Model Call Girl in Uttam Nagar Delhi reach out to us at 🔝9953056974🔝
Model Call Girl in Uttam Nagar Delhi reach out to us at 🔝9953056974🔝
 
(👉゚9999965857 ゚)👉 VIP Call Girls Greater Noida 👉 Delhi 👈 : 9999 Cash Payment...
(👉゚9999965857 ゚)👉 VIP Call Girls Greater Noida  👉 Delhi 👈 : 9999 Cash Payment...(👉゚9999965857 ゚)👉 VIP Call Girls Greater Noida  👉 Delhi 👈 : 9999 Cash Payment...
(👉゚9999965857 ゚)👉 VIP Call Girls Greater Noida 👉 Delhi 👈 : 9999 Cash Payment...
 
High Profile Call Girls Kolkata Gayatri 🤌 8250192130 🚀 Vip Call Girls Kolkata
High Profile Call Girls Kolkata Gayatri 🤌  8250192130 🚀 Vip Call Girls KolkataHigh Profile Call Girls Kolkata Gayatri 🤌  8250192130 🚀 Vip Call Girls Kolkata
High Profile Call Girls Kolkata Gayatri 🤌 8250192130 🚀 Vip Call Girls Kolkata
 
Short-, Mid-, and Long-term gxxoals.pptx
Short-, Mid-, and Long-term gxxoals.pptxShort-, Mid-, and Long-term gxxoals.pptx
Short-, Mid-, and Long-term gxxoals.pptx
 
Vip Call Girls Vasant Kunj ➡️ Delhi ➡️ 9999965857 No Advance 24HRS Live
Vip Call Girls Vasant Kunj ➡️ Delhi ➡️ 9999965857 No Advance 24HRS LiveVip Call Girls Vasant Kunj ➡️ Delhi ➡️ 9999965857 No Advance 24HRS Live
Vip Call Girls Vasant Kunj ➡️ Delhi ➡️ 9999965857 No Advance 24HRS Live
 
Russian Call Girls Rohini Sector 22 💓 Delhi 9999965857 @Sabina Modi VVIP MODE...
Russian Call Girls Rohini Sector 22 💓 Delhi 9999965857 @Sabina Modi VVIP MODE...Russian Call Girls Rohini Sector 22 💓 Delhi 9999965857 @Sabina Modi VVIP MODE...
Russian Call Girls Rohini Sector 22 💓 Delhi 9999965857 @Sabina Modi VVIP MODE...
 
Rohini Sector 15 Call Girls Delhi 9999965857 @Sabina Saikh No Advance
Rohini Sector 15 Call Girls Delhi 9999965857 @Sabina Saikh No AdvanceRohini Sector 15 Call Girls Delhi 9999965857 @Sabina Saikh No Advance
Rohini Sector 15 Call Girls Delhi 9999965857 @Sabina Saikh No Advance
 
Methanex Investor Presentation (April 2024)
Methanex Investor Presentation (April 2024)Methanex Investor Presentation (April 2024)
Methanex Investor Presentation (April 2024)
 
Call Girls 🫤 Nehru Place ➡️ 9999965857 ➡️ Delhi 🫦 Russian Escorts FULL ENJOY
Call Girls 🫤 Nehru Place ➡️ 9999965857  ➡️ Delhi 🫦  Russian Escorts FULL ENJOYCall Girls 🫤 Nehru Place ➡️ 9999965857  ➡️ Delhi 🫦  Russian Escorts FULL ENJOY
Call Girls 🫤 Nehru Place ➡️ 9999965857 ➡️ Delhi 🫦 Russian Escorts FULL ENJOY
 
如何办理(UTS毕业证书)悉尼科技大学毕业证学位证书
如何办理(UTS毕业证书)悉尼科技大学毕业证学位证书如何办理(UTS毕业证书)悉尼科技大学毕业证学位证书
如何办理(UTS毕业证书)悉尼科技大学毕业证学位证书
 
VIP 7001035870 Find & Meet Hyderabad Call Girls Abids high-profile Call Girl
VIP 7001035870 Find & Meet Hyderabad Call Girls Abids high-profile Call GirlVIP 7001035870 Find & Meet Hyderabad Call Girls Abids high-profile Call Girl
VIP 7001035870 Find & Meet Hyderabad Call Girls Abids high-profile Call Girl
 
Call Girls In Vasant Kunj 📱 9999965857 🤩 Delhi 🫦 HOT AND SEXY VVIP 🍎 SERVICE
Call Girls In Vasant Kunj 📱  9999965857  🤩 Delhi 🫦 HOT AND SEXY VVIP 🍎 SERVICECall Girls In Vasant Kunj 📱  9999965857  🤩 Delhi 🫦 HOT AND SEXY VVIP 🍎 SERVICE
Call Girls In Vasant Kunj 📱 9999965857 🤩 Delhi 🫦 HOT AND SEXY VVIP 🍎 SERVICE
 
@9999965857 🫦 Sexy Desi Call Girls Vaishali 💓 High Profile Escorts Delhi 🫶
@9999965857 🫦 Sexy Desi Call Girls Vaishali 💓 High Profile Escorts Delhi 🫶@9999965857 🫦 Sexy Desi Call Girls Vaishali 💓 High Profile Escorts Delhi 🫶
@9999965857 🫦 Sexy Desi Call Girls Vaishali 💓 High Profile Escorts Delhi 🫶
 
VIP Call Girl Amritsar 7001035870 Enjoy Call Girls With Our Escorts
VIP Call Girl Amritsar 7001035870 Enjoy Call Girls With Our EscortsVIP Call Girl Amritsar 7001035870 Enjoy Call Girls With Our Escorts
VIP Call Girl Amritsar 7001035870 Enjoy Call Girls With Our Escorts
 
OKC Thunder Reveal Game 2 Playoff T Shirts
OKC Thunder Reveal Game 2 Playoff T ShirtsOKC Thunder Reveal Game 2 Playoff T Shirts
OKC Thunder Reveal Game 2 Playoff T Shirts
 
Q3 FY24 Earnings Conference Call Presentation
Q3 FY24 Earnings Conference Call PresentationQ3 FY24 Earnings Conference Call Presentation
Q3 FY24 Earnings Conference Call Presentation
 
Malad Escorts, (Pooja 09892124323), Malad Call Girls Service
Malad Escorts, (Pooja 09892124323), Malad Call Girls ServiceMalad Escorts, (Pooja 09892124323), Malad Call Girls Service
Malad Escorts, (Pooja 09892124323), Malad Call Girls Service
 

3PL - equity research - initiation report

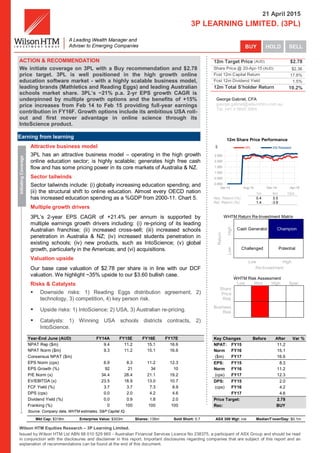
  • 1. Wilson HTM Equities Research – 3P Learning Limited. Issued by Wilson HTM Ltd ABN 68 010 529 665 - Australian Financial Services Licence No 238375, a participant of ASX Group and should be read in conjunction with the disclosures and disclaimer in this report. Important disclosures regarding companies that are subject of this report and an explanation of recommendations can be found at the end of this document. 21 April 2015 3P LEARNING LIMITED. (3PL) ACTION & RECOMMENDATION We initiate coverage on 3PL with a Buy recommendation and $2.78 price target. 3PL is well positioned in the high growth online education software market - with a highly scalable business model, leading brands (Mathletics and Reading Eggs) and leading Australian schools market share. 3PL’s ~21% p.a. 2-yr EPS growth CAGR is underpinned by multiple growth options and the benefits of +15% price increases from Feb 14 to Feb 15 providing full-year earnings contribution in FY16F. Growth options include its ambitious USA roll- out and first mover advantage in online science through its IntoScience product. Earning from learning InitiatingCoverage Attractive business model 3PL has an attractive business model – operating in the high growth online education sector; is highly scalable; generates high free cash flow and has some pricing power in its core markets of Australia & NZ. Sector tailwinds Sector tailwinds include: (i) globally increasing education spending; and (ii) the structural shift to online education. Almost every OECD nation has increased education spending as a %GDP from 2000-11. Chart 5. Multiple growth drivers 3PL’s 2-year EPS CAGR of +21.4% per annum is supported by multiple earnings growth drivers including: (i) re-pricing of its leading Australian franchise; (ii) increased cross-sell; (iii) increased schools penetration in Australia & NZ; (iv) increased students penetration in existing schools; (iv) new products, such as IntoScience; (v) global growth, particularly in the Americas; and (vi) acquisitions. Valuation upside Our base case valuation of $2.78 per share is in line with our DCF valuation. We highlight ~35% upside to our $3.60 bullish case. Risks & Catalysts  Downside risks: 1) Reading Eggs distribution agreement, 2) technology, 3) competition, 4) key person risk.  Upside risks: 1) IntoScience; 2) USA, 3) Australian re-pricing.  Catalysts: 1) Winning USA schools districts contracts, 2) IntoScience. 12m Target Price (AUD) $2.78 Share Price @ 20-Apr-15 (AUD) $2.36 Fcst 12m Capital Return 17.8% Fcst 12m Dividend Yield 1.5% 12m Total S’holder Return 19.2% George Gabriel, CFA george.gabriel@wilsonhtm.com.au Tel. +61 3 9640 3864 12m Share Price Performance 1m 6m 12m Abs. Return (%) 0.4 3.5 Rel. Return (%) 1.4 -3.9 WHTM Return Re-Investment Matrix Return High Cash Generator ChampionLow Challenged Potential Low High Re-Investment WHTM Risk Assessment Low Med High Spec Share Price Risk Business Risk Year-End June (AUD) FY14A FY15E FY16E FY17E NPAT Rep ($m) 9.4 11.2 15.1 16.6 NPAT Norm ($m) 9.3 11.2 15.1 16.6 Consensus NPAT ($m) EPS Norm (cps) 6.9 8.3 11.2 12.3 EPS Growth (%) 92 21 34 10 P/E Norm (x) 34.4 28.4 21.1 19.2 EV/EBITDA (x) 23.5 18.9 13.0 10.7 FCF Yield (%) 3.7 3.7 7.3 8.9 DPS (cps) 0.0 2.0 4.2 4.6 Dividend Yield (%) 0.0 0.9 1.8 2.0 Franking (%) 0 100 100 100 Source: Company data, WHTM estimates, S&P Capital IQ Key Changes Before After Var % NPAT: FY15 11.2 Norm FY16 15.1 ($m) FY17 16.6 EPS: FY15 8.3 Norm FY16 11.2 (cps) FY17 12.3 DPS: FY15 2.0 (cps) FY16 4.2 FY17 4.6 Price Target: 2.78 Rec: BUY Mkt Cap: $318m Enterprise Value: $303m Shares: 135m Sold Short: 0.7 ASX 300 Wgt: n/a MedianT’over/Day: $0.1m 0.000 0.500 1.000 1.500 2.000 2.500 Apr-14 Aug-14 Dec-14 Apr-15 $ 3PL XSI Rebased
  • 2. 21 April 2015 Consumer Services 3P Learning Limited. Wilson HTM Equities Research – 3P Learning Limited. 2 PRICE TARGET Valuation Discounted Cash Flow 2.78 INTERIMS ($m) Half-yr (AUD) Dec 13 Jun 14 Dec 14 Jun 15 1HA 2HA 1HA 2HE Sales Revenue 15.3 20.5 18.4 22.7 EBITDA 3.3 9.6 6.2 9.7 EBIT 2.5 8.5 4.9 8.0 Net Profit 2.4 6.9 4.0 7.2 Norm. EPS 1.7 5.1 3.0 5.3 EBIT/Sales (%) 16.1 41.4 26.8 35.3 Dividend (c) 0.0 0.0 0.0 2.0 Franking (%) 0.0 0.0 0.0 100.0 FINANCIAL STABILITY Year-end June (AUD) FY14A FY15E FY16E Net Debt -5.7 -4.0 -9.4 Net Debt / Equity (%) <0 <0 <0 Net Debt / EV (%) <0 <0 <0 Current Ratio (x) 1.2 2.8 3.3 Interest Cover (x) � <0 <0 Adj. Cash Int. Cover (x) <0 <0 Debt / CashFlow (x) 1.2 1.6 0.6 Net Debt (cash) / share ($) NTA / share ($) 0.1 0.2 0.3 Book Value / share ($) 0.1 0.2 0.3 Payout Ratio (%) 0 24 38 Adj. Payout Ratio (%) 0 3 0 EPS RECONCILIATION ($m) FY14A FY15E Rep. Norm . Rep. Norm .Sales Revenue 36 36 41 41 EBIT 11.0 10.9 12.9 12.9 Net Profit 9.4 9.3 11.2 11.2 Notional Earn. 0.0 0.0 0.0 0.0 Pref./Conv. Div. 0.0 0.0 0.0 0.0 Profit for EPS 9.4 9.3 11.2 11.2 Diluted Shrs(m) 135 135 135 135 Diluted EPS (c) 7.0 6.9 8.3 8.3 Feb 14 KEY ASSUMPTIONS Year-end June (AUD) FY14A FY15E FY16E FY17E Revenue Growth (%) 16.8 17.0 13.2 NPAT Growth (%) 16.8 17.0 13.2 EPS Growth (%) 24.0 46.0 21.4 EBITDA / Sales (%) 36.1 38.9 48.0 51.9 EBIT / Sales (%) 30.6 31.5 38.7 40.4 Tax Rate (%) 15.4 17.1 23.0 28.0 ROA (%) 21.7 24.0 29.2 28.8 ROE (%) 129.0 35.2 35.2 30.3 PROFIT & LOSS ($m) Year-end June (AUD) FY14A FY15E FY16E FY17E Sales Revenue 35.8 41.1 48.6 54.6 EBITDA 12.9 16.0 23.3 28.3 Depn & Amort 1.9 3.1 4.5 6.3 EBIT 10.9 12.9 18.8 22.1 Net Interest Expense 0.0 -0.6 -0.7 -1.0 Tax 1.7 2.3 4.5 6.5 Minorities / pref divs 0.0 0.0 0.0 0.0 Equity accounted NPAT 0.0 0.0 0.0 0.0 Net Profit pre Sig. Items 9.3 11.2 15.1 16.6 Abn’s / Ext’s / Signif. 0.1 0.0 0.0 0.0 Reported Net Profit 9.4 11.2 15.1 16.6 CASHFLOW ($m) Year-end June (AUD) FY14A FY15E FY16E FY17E EBITDA 12.9 16.0 23.3 28.3 Interest & Tax 0.0 0.6 0.7 1.0 Working Cap / Other -0.8 -4.8 -0.7 -1.0 Operating Cash Flow 12.1 11.8 23.3 28.3 Maintenance Capex -0.3 -0.1 0.0 0.0 Free Cash Flow 11.7 11.7 23.3 28.3 Dividends Paid 0.0 0.3 0.0 0.0 Growth Capex 0.0 -5.0 -10.0 -10.0 Invest. / Disposals -7.8 -3.7 0.0 0.0 Other Inv. Flows 0.0 0.0 0.0 0.0 Cash Flow Pre Financing 3.9 3.3 13.3 18.3 Funded by Equity 0.0 0.6 0.8 1.0 Funded by Debt 0.0 -1.7 -4.5 -6.5 Funded by Cash -3.9 -2.2 -9.6 -12.8 BALANCE SHEET SUMMARY ($m) Year-end June (AUD) FY14A FY15E FY16E FY17E Cash 24.4 17.7 23.1 31.3 Current Receivables 5.9 5.8 5.8 5.8 Current Inventories 0.0 1.5 1.5 1.5 Net PPE 1.3 1.1 1.1 1.1 Investments 0.0 0.0 0.0 0.0 Intangibles / Capitalised 16.5 25.4 30.9 34.6 Other 2.4 2.3 2.3 2.3 Total Assets 50.6 53.8 64.6 76.5 Current Payables 8.0 3.7 3.7 3.7 Total Debt 18.8 13.7 13.7 13.7 Other Liabilities 16.5 4.4 4.4 4.4 Total Liabilities 43.3 21.7 21.7 21.7 Minorities / Convertibles 0.1 0.1 0.1 0.1 Shareholder Equity 7.3 32.0 42.9 54.8 Total Funds Employed 26.0 45.7 56.6 68.5 RETURNS FY14A FY15E FY16E FY17E ROE (%) 85.1 57.1 40.2 34.0 ROIC (%) 95.5 61.1 42.9 43.7 Incremental ROE -31.3 22.3 21.6 13.4 Incremental ROIC -139.2 20.3 26.0 49.2
  • 3. 21 April 2015 Consumer Services 3P Learning Limited. Wilson HTM Equities Research – 3P Learning Limited. 3 Contents 1. Investment summary ……………………………………………………4 1.1 Business overview……………………………………………………………..…...4 1.2 Investment view........................................................................................... 4 1.3 Key catalysts............................................................................................... 5 1.4 Key risks and mitigants ............................................................................... 6 2. Valuation 7 2.1 Price target.................................................................................................. 7 2.2 Comparable companies analysis - listed online stocks ................................ 7 2.3 Comparable acquisitions - education sector acquisitions ........................... 10 2.4 Earnings analysis ...................................................................................... 10 2.5 Scenario analysis ...................................................................................... 12 3. Growth driver analysis 14 3.1 Average revenue per user (ARPU) ........................................................... 14 3.2 Cross-sell.................................................................................................. 15 3.3 Increased schools penetration................................................................... 16 3.4 Increased students penetration.................................................................. 17 3.5 New products ............................................................................................ 18 3.6 Global growth ........................................................................................... 18 3.7 Acquisitions............................................................................................... 19 4.Business description 19 4.1 History ...................................................................................................... 19 4.2 Business model ........................................................................................ 19 4.3 Revenue model ......................................................................................... 20 4.4 Competition............................................................................................... 20 4.5 Industry .................................................................................................... 23 5. Corporate overview 24 5.1 Board ........................................................................................................ 24 5.2 Management ............................................................................................. 24 5.3 Register .................................................................................................... 24 6. Risks and catalysts 25 6.1 Upside Risks ........................................................................................... 25 6.2 Downside Risks ....................................................................................... 25
  • 4. 21 April 2015 Consumer Services 3P Learning Limited. Wilson HTM Equities Research – 3P Learning Limited. 4 1.Investment summary – 3P Learning Ltd (3PL) 1.1 BUSINESS OVERVIEW 3P Learning Ltd (3PL) is a global online education company with a portfolio of brands and products for primary, middle and secondary school students from Kindergarden-Year 12 (“K-12”) across numeracy, literacy and science subjects. Numeracy. Mathletics is the flagship product – it is an online numeracy product for the school years from Kingergarden to Year 12 (“K-12”). It has ~48% penetration of Australian schools and is the leading Australian online mathematics education product. It is currently available in two languages and includes content aligned to 40 mathematics curricula around the world. Literacy - Reading Eggs. 3PL is the exclusive re-seller of Reading Eggs products in Australia and some offshore markets. These products provide an English literacy product targeted at grades K-6. - Spellodrome is 3PL’s online English literacy product which targets grades K-10. 3PL’s key focus is on Reading Eggs rather than Spellodrome. Science. IntoScience is a relatively new online science education product. 3PL is a global online education company. Mathletics is its flagship product, generating ~80% total revenue and with ~48% Australian schools penetration. 3PL is the exclusive re-seller of Reading Eggs in Australia and some offshore products. IntoScience is a relatively new product. 1.2 INVESTMENT VIEW Investment view We initiate coverage with a Buy recommendation and $2.78 price target. Our base case valuation is $2.78 per share. Valuation Our $2.78 price target is in line with our discounted cash flow valuation. We believe DCF valuation is an appropriate valuation method because it captures the expected returns from: 3PL’s current investment in its direct sales force in the USA. Product re-pricing upside. IntoScience product roll-out. Balanced base case risk-reward ratio supported by ~35% upside to bull case At current share prices, the risks are evenly balanced, with approximately equal upside to our base case of $2.78 and downside to our bear case of $2.01. However, we note that our bull case valuation $3.60 per share implies ~35% upside. The bull case implies 35% upside. Strong brands with leading market shares 3PL has a competitive advantage in that it provides a full suite of online education products for schools – including mathematics (Mathletics), reading (Reading Eggs), spelling (Spellodrome) and its newest science product (IntoScience). 3PL has leading market shares in Australia and New Zealand, with Mathletics and Reading Eggs in particular. 3PL has leading market shares with Mathletics in Australia & NZ. Highly scalable with high free cash flow generation 3PL’s business model is highly scalable, with upfront development costs, direct sales staff costs and very low incremental cost of sales. 3PL generates high free cashflow, with 223% cash conversion ratio in FY14 ($18.9m net cash from operations/ $8.5m proforma NPAT). 3PL has zero debt and A$15.8m cash on balance sheet as at 1H15, having financed its previous expansion through operating cashflow. The business model is highly scalable. 3PL has net cash on balance sheet.
  • 5. 21 April 2015 Consumer Services 3P Learning Limited. Wilson HTM Equities Research – 3P Learning Limited. 5 Recurrent revenues 3PL’s earnings are recurring in nature, given: Reasonably high customer switching costs. Switching to a new product involves a new investment of time before users are proficient with product usage. Customers generally result from the migration from offline learning to online, as opposed to winning market share from existing providers. The low absolute cost per user of $8.40 in 1H15. Students and schools who are familiar with the products are more likely to continue using them through their schooling. Revenues are generally recurring in nature. Multiple earnings growth drivers 3PL has multiple medium-term earnings growth drivers, including: Australian pricing power driving ARPU increases. 3PL has the potential to re- price Mathletics and Reading Eggs in Australia & NZ given their leading market positions and the ~$30-$60 cost of text books (ie. online education’s substitute product). Chart 1. Cross-sell potential. One of 3PL’s competitive advantages is the breadth of its product range – covering mathematics (Mathletics), literacy (Reading Eggs and Spellodrome) and science (IntoScience). This creates ongoing product cross- sell opportunities. This compares to many other companies which only focus on single products. Chart 2. Increased schools penetration. 3PL has the potential to increase the proportion of students within existing school customers using its products. Chart 3. New product growth. 3PL has potential to capture first mover advantage in online science education, given that this is a relatively new category. IntoScience was launched in Australia & NZ in 2014 and will be offered in all operational territories by 2016. In FY14, 3PL sold 46,650 IntoScience licences. However, growth is still off a low base, comprising only 1% of total 1H15 licence numbers. Global growth. Australia & NZ currently generate ~67% total revenues (1H15 licence revenue $18.4m). The USA is a key target for growth. 3PL has only penetrated ~1% of the USA schools population, highlighting the size of the potential prize. Recently, 3PL has been investing in its sales force expansion in North America to drive growth in FY16F. Global revenue contributions are increasing, up from 27% in 1H14 to 33% in 1H15. Acquisitions. 3PL has made some selective bolt-on acquisitions in recent years, and is well placed to continue with this strategy. We analyse these key growth drivers in Section 3 of this report. 3PL has multiple medium-term earnings growth drivers. IntoScience is 3PL’s fastest growing product in the emerging category of online science education. 1.4 KEY CATALYSTS Potential stock re-rating catalysts include: Australian re-pricing We believe 3PL has significant potential to leverage its leading market position in Australia & NZ to continue re-pricing its flagship Mathletics product (and to a lesser extent also Reading Eggs). Our bull case scenario analyses this and concludes that a $3.60 per share valuation would apply if the ARPU increased to $20 by FY20F, driven by Australian & NZ re-pricing. IntoScience sales traction We would expect 3PL to re-rate as IntoScience gains sales momentum through FY15F and FY16F. IntoScience was piloted in 2013 and fully launched into Australia for years 7 and 8 in 2014. 3PL aims to have IntoScience available globally by 2016.
  • 6. 21 April 2015 Consumer Services 3P Learning Limited. Wilson HTM Equities Research – 3P Learning Limited. 6 USA schools district contract wins Winning schools district contracts in the USA means high student volumes can be achieved through a single school district contract. In the USA, public schools are run by districts, which in turn are controlled by local and state governments. Schools can buy at an individual school level or across an entire district. 3PL’s strategy is both bottom up (ie. targeting individual schools in a district to achieve some scale and then leverage this into support at a district level) and top down (ie. targeting the entire district). Presently, 3PL is continuing its expansion into the US by investing in the salesforce infrastructure to then leverage for licence growth. In the USA, the focus for the US is on Mathletics and IntoScience, given that 3PL does not have the right to distribute Reading Eggs in the USA and Spellodrome is not a strategic priority for 3PL. Winning schools districts contracts can bring high volumes with one contract. 1.5 KEY RISKS AND MITIGANTS Key risks are competition, technology, and the Reading Eggs distribution licence. Competition The sector is fragmented, particularly offshore. In Australia, we believe 3PL is well placed to grow its Mathletics market share and Reading Eggs cross-sell given: Mathletics and Reading Eggs are superior products compared to local competition such as Skoolbo and Studyladder, in our view. 3PL has achieved dominant local market shares in Mathletics and Reading Eggs despite the existence of local competition. In offshore markets, there is more competition than in Australia. 3PL is growing its USA volumes, albeit off a low base. Technology 3PL relies on its cloud-based technology platform in order to deliver its online educational services. This technology may be adversely affected by developments such as staff misuse, damage, computer viruses and hackers. Any service disruption may cause significant damage to 3PL’s reputation and its ability to generate revenue. 3PL’s migration to public cloud services over time could result in service disruptions and/or be more time consuming and expensive than anticipated. Reading Eggs distribution licence. 3PL has a distribution agreement with Pascal Press/Blake Group to sell Reading Eggs products in Australia and New Zealand and some offshore markets. There are minimum sales volume requirements are part of this licencing arrangement. We understand that 3PL is trading ~2 years ahead of its minimum volume requirements, but the exact terms of the arrangement have not been disclosed. All other online education products are owned by 3PL.
  • 7. 21 April 2015 Consumer Services 3P Learning Limited. Wilson HTM Equities Research – 3P Learning Limited. 7 2. Valuation 2.1 PRICE TARGET We initiate coverage with a Buy recommendation and $2.78 share price target (in line with our discounted cash flow valuation). We believe that a DCF valuation is appropriate given that 3PL is investing in new staff hires in the USA to drive sales, which depresses near-term earnings but should be captured in long-term DCF valuation. Our share price target is $2.78 per share, in line with our DCF valuation. 2.2 COMPARABLE COMPANIES ANALYSIS – LISTED ONLINE STOCKS We discuss the results of our comparable companies analysis below. Table 2 summarises the valuation of various online companies, using Bloomberg consensus data. For the purposes of our analysis, we have divided listed online stocks into 3 segments: “Online Leaders”. These include REA Group Ltd (REA), Seek Limited (SEK), Carsales.com Ltd (CRZ) and Trademe Group Ltd (TME). “Online Midcap”. These include iSentia Group (ISD), Infomedia Ltd (IFM), iSelect Ltd (ISU), Webjet Ltd (WEB), 3P Learning Ltd (3PL), and Gentrack Group Ltd (GTK). “Online Early Stage and Microcap”. These include Aconex (ACX), Surfstitch (SRF), Reckon Ltd (RKN), Grays eCommerce (GEG) and onthehouse (OTH). We have excluded some listed online stocks from our analysis because they lacked sufficient consensus earnings forecasts to provide a basis for our analysis. We have segmented listed online stocks into (i) Online Leaders; (ii) Online Midcap and (iii) Online Early Stage and Microcap. 3PL has a higher EPS CAGR outlook than its online peers 3PL’s higher EPS CAGR outlook explains its higher FY16F PE of 22.0x compared to the 18.4x average of Online Midcap stocks. 3PL has a 2-yr EPS CAGR growth rate from FY16F to FY17F of 24.6%, compared to 16.3% average of Online Leaders and 14.1% for Online MidCap. 3PL’s growth is driven by (i) the full year impact of Australian Mathletics and Readings Eggs re- pricing by +15% from Feb 14 to Feb 15; and (ii) licence growth. Refer below Section 3 for more details. 3PL has a higher 2yr EPS CAGR outlook than its peers. 3PL is cheap on a price-earnings growth (PEG) multiple basis 3PL currently trades on a consensus FY16F PEG multiple of 0.7x, compared to the average FY16F Online Midcap PEG ratio of 1.4x and Online Leaders of 1.5x, because of 3PL’s higher EPS CAGR outlook. This is because 3PL has a higher 2-year EPS compound annual growth rate (CAGR) outlook of 24.6%, vs the Online MidCap average of 14.1% and Online Leaders of 16.3%. 3PL is cheap on a PEG multiple basis. Scale, combined with business quality, attracts a premium rating Online Leaders trade at a ~18% premium to Online MidCap (FY16F PE 21.7x, vs Online MidCap 18.4x). However, scale alone is not sufficient to result in a valuation premium. A business must also have attractive fundamental qualities to justify a premium rating, such as: pricing power; the network effect; high margins; cross-sell potential; customer switching costs etc. 3PL is well placed to re-rate as it grows.
  • 8. 21 April 2015 Consumer Services 3P Learning Limited. Wilson HTM Equities Research – 3P Learning Limited. 8 We believe that 3PL could re-rate in the medium term by up to 10-15% (ie. up towards REA’s rating of FY16F of 26x) if 3PL can demonstrate that it has captured the network effect in its core Australian market. Much like REA has captured the network of real estate buyers and sellers to capture a leading position in Australian real estate advertising, 3PL could also capture the network of students-parents- schools-competing schools to lock out potential new entrants in online education. 3PL could achieve the network effect through utilisation of its student performance database for benchmarking; engaging parents in analytical reporting and school interaction etc. TABLE 1: COMPARABLE COMPANIES VALUATION Source: WHTM, S&P Capital IQ, Bloomberg 2.3 COMPARABLE ACQUISITIONS ANALYSIS – EDUCATION SECTOR ACQUSITIONS In Table 2, our analysis of recent acquisitions of online education businesses indicates: EV/revenue multiple average of 4.8x, with a range from 2.1x to 10.0x. EV/EBITDA multiple average of 12.1x, with a range of 7.9x to 14.0x. Key insights are: The two highest EV/EBITDA acquisitions, both at 14.0x, were of similar businesses to 3PL. - In June 2010, Education City was acquired for 14.0x EV/EBITDA (~6.9% above 3PL FY16F consensus of 13.1x) by Archipelago Learning, which is a K-12 online education provider and also a distributor of Reading Eggs. Education City provides online education software for schools in the US and UK, targeting Kindergarden – Year 6. - In Oct 11, Blackboard Inc was acquired by Providence Equity. Blackboard provides online learning for K-12 in the USA. Recent transactions imply a much higher EV/revenue multiple for the sector: - On 15 April 2015, Linkedin paid 10.0x EV/revenue for the Lynda.com acquisition. - In Oct 2014, Bertelsmann paid 9.4x for Relias Learning. Professional private equity firms are active in this segment, accounting for 7 of the 15 identified acquisitions since May 2010. In June 2010, Education City, a similar business to 3PL, was acquired for a 7-17% premium to 3PL’s current multiple. Recent acquisitions were at ~10x EV/revenue. Private equity firms are active in this segment. Company Ticker Share Price Market Cap (A$m) Franking % EBITDA Margin Online Leaders FY15F FY16F FY17F FY15F FY16F FY17F FY15F FY16F FY17F 2yr CAGR FY15F FY16F FY15F FY16F FY15F FY16F FY17F FY15F REA Group Ltd REA $47.10 6,350 20.8x 16.8x 14.5x 32.3x 25.8x 21.4x 47.6% 25.5% 20.2% 22.8% 0.7x 1.0x 100% 1.5% 1.9% 11.6x 9.7x 8.8x 56% Seek Ltd SEK $16.90 5,751 18.6x 15.4x 13.6x 28.5x 23.2x 19.3x 54.1% 23.1% 20.0% 21.6% 0.5x 1.0x 100% 2.3% 2.7% 8.0x 6.8x 6.2x 43% CarSales.com Ltd CAR $9.90 2,389 16.5x 14.8x 13.5x 23.1x 20.2x 17.8x 21.8% 14.2% 13.5% 13.9% 1.1x 1.4x 100% 3.6% 4.1% 8.4x 7.6x 7.0x 50% Trade Me Group Ltd TME $3.65 1,446 12.1x 11.4x 10.5x 18.5x 17.6x 16.2x 15.2% 6.8% 6.9% 6.9% 1.2x 2.6x - 4.6% 4.7% 8.0x 7.5x 6.9x 67% Average 17.0x 14.6x 13.0x 25.6x 21.7x 18.7x 34.7% 17.4% 15.2% 16.3% 0.9x 1.5x 3.0% 3.4% 9.0x 7.9x 7.2x 54% Online MidCap iSentia Group Ltd ISD $3.53 700 17.3x 14.7x 13.1x 26.6x 22.1x 19.9x 9.4% 19.3% 12.6% 15.9% 2.8x 1.1x 0% 2.0% 2.5% 6.0x 5.5x 5.0x 34% Infomedia Ltd IFM $1.25 385 14.2x 12.8x 10.9x 28.1x 24.8x 19.8x 17.5% 10.6% 23.1% 16.7% 1.6x 2.3x 100% 3.1% 3.9% 6.1x 5.6x 5.1x 43% iSelect Ltd ISU $1.44 370 10.9x 8.0x 7.0x 17.3x 14.8x 12.8x 18.3% 10.7% 18.6% 14.6% 0.9x 1.4x - 0.0% 1.9% 1.9x 1.7x 1.6x 20% Webjet Ltd WEB $4.05 331 10.3x 9.0x 8.2x 17.0x 14.8x 13.4x -1.7% 14.8% 10.0% 12.4% - 1.0x 100% 3.5% 4.0% 2.5x 2.2x 2.1x 25% Gentrack Group Ltd GTK $2.32 169 10.3x 9.6x 9.0x 17.7x 15.3x 14.3x 24.9% 15.2% 6.9% 11.0% 0.7x 1.0x - 4.7% 5.6% 3.8x 3.6x 3.3x 36% Average 12.6x 10.8x 9.6x 21.3x 18.4x 16.1x 13.7% 14.1% 14.2% 14.1% 1.5x 1.4x 2.7% 3.6% 4.1x 3.7x 3.4x 32% 3P Learning Ltd 3PL $2.36 322 17.7x 13.1x 11.0x 28.7x 22.0x 18.7x 30.5% 18.9% 24.6% 0.2x 0.7x - 1.0% 1.2% 7.0x 5.8x 5.0x 39% Aconex Ltd ACX $2.05 339 - 22.6x 12.7x - 40.2x 19.0x - - 111.8% - - - - 0.0% 0.0% 4.2x 3.4x 2.8x 2% Surfstitch Group Ltd SRF $1.43 316 54.1x 24.3x 11.0x - 93.2x 25.6x - - - - - - - 0.0% 0.0% 1.4x 1.0x 0.7x 3% Reckon Ltd RKN $1.89 210 6.3x 5.9x 5.6x 11.9x 11.5x 10.6x 7.5% 5.7% 8.4% - 1.6x 2.0x 60% 5.1% 5.4% 2.4x 2.3x 2.2x 38% Grays eCommerce Ltd GEG $1.00 91 9.6x 4.7x 4.0x 28.7x 12.3x 10.8x - - 13.0% - - 0.1x 0% 0.0% 0.0% 0.2x 0.2x 0.1x - Onthehouse Holdings Ltd OTH $0.52 43 7.3x 6.2x 5.4x - 66.9x 15.3x -60.0% 100.0% - - - 0.7x 100% 0.0% 0.0% 1.5x 1.4x 1.3x 21% Average 19.3x 12.8x 7.7x 20.3x 44.8x 16.2x -26% 53% 44% - 1.6x 0.9x 1.0% 1.1% 1.9x 1.7x 1.4x 16% Online Early Stage & MicroCap EV/EBITDA (x) EV/Revenue (x)PERatio (x) EPS Growth % PEG Multiple (x) Dividend Yield %
  • 9. 21 April 2015 Consumer Services 3P Learning Limited. Wilson HTM Equities Research – 3P Learning Limited. 9 Other acquirers include publishing firms (eg. Pearson PLC), diversified media companies (eg. Bertelsmann), other online companies (eg. Linkedin) and trade players (eg. Edmentum). TABLE 2: COMPARABLE ACQUISITIONS Source: WHTM, S&P Capital IQ, Bloomberg Date Target Target Description Acquirer AcquirerDescription EV (A$M) EV/EBITDA EV/revenue May-10 Skillsoft Cloud-based online learning solutions and softw are for the enterprise and corporate sector, w ith 6,000 global customers. Acquired for US$2.3bn in 2014 by Charterhouse Capital. Bain, Berkshire Venture capital houses US$1,100 7.9x Jun-10 Education City Online education softw are and hardw are for schools in the US and UK targeting K-6 in literacy, numeracy and science, w ith 13,000 school customers in the USA and UK. Archipelago Learning Provides K-12 online learning softw are, also a Reading Eggs distributor US$87 14.0x 6.7x Oct-11 Renaissance Learning Online education softw are and hardw are for schools targeted at K-12. In 2014, Permira sold to Hellman & Friedman for $1.1bn after many years of double digit grow th. Permira European private equity US$455 11.0x 3.3x Oct-11 Blackboard Inc. Online learning and course management softw are in the US, targeting K-12, corporates and higher education Providence Equity US-based private equity US$1,770 14.0x 3.3x Sep-11 Connections Education Virtual schools' provided online, w hich are registered in a number of US states Pearson PLC UK-based global publishing firm US$400 2.1x Mar-12 Archipelago Learning Provides K-12 online learning softw are, also a Reading Eggs distributor Plato Learning Know n as Edmentum, provides interactive K-12 education softw are US$303 11.4x 3.8x Mar-13 Renaissance Learning Online education softw are and hardw are for schools targeted at K-12 Hellman & Friedman US private equity US$1100 5.5x Mar-14 Skillsoft Cloud-based online learning solutions and softw are for the enterprise and corporate sector Charterhouse Capital UK-based private equity US$2,300 13.5x 5.6x Apr-14 E-Learning S.A. Technological platform helping organisations and individuals to develop and deploy online distance learning and skills assessment programs John Wiley & Sons NYSE-listed, US based global academic publishing company $187.00 3.9x Aug-14 The Learning Lab Singaporean based firm developing primary and secondary education content across a broad field Advent International Corporation US-based global private equity firm $286 Oct-14 Relias Learning Learning management system providing custom courses to organisations Bertelsmann SE Europe's largest diversified media company, w hich also invests in education $414 9.4x Feb-15 Abril Educacao Brazilian diversified education company offering traditional materials and online games/content Tarpon Investimentos Brazilian-listed hedge fund $1,350 12.1x Mar-15 Nobel Learning Communities, Inc. US operator of schools, camps and before/after school programs Investcorp Bank / Bahrain Mumtalakat Investcorp is a Bahrain-based private equity firm. Mumtalakat is investment arm of Kingdom of Bahrain $530 Mar-15 Endeavour Learning Group Pty Ltd Provides various educational services for fields including naturopathy, health science and massage Study Group Pty Ltd Specialised tertiary education services $75 Apr-15 Lynda.com Provides video tutorials/courses in various areas such as softw are, technology and business skills. LinkedIn Professional social netw ork US$1,500 10.0x Average 12.0x 4.8x
  • 10. 21 April 2015 Consumer Services 3P Learning Limited. Wilson HTM Equities Research – 3P Learning Limited. 10 2.4 EARNINGS ANALYSIS Earnings guidance At its 1H15 results, 3PL re-confirmed its FY15F prospectus forecasts, though we believe it could have justified an upgrade to its earnings outlook. Table 3 compares 1H15 results to WHTM, consensus and 3PL’s prospectus forecasts. At the FY15F NPAT line, both WHTM’s forecast of A$11.1m and consensus FY15F forecasts of A$11.5m are ahead of 3PL prospectus forecasts of A$9.7m, driven by 1H15 result drivers are tracking ahead of prospectus. 3PL is ahead of prospectus on Average Revenue Per User (ARPU). 1H15 ARPU of $8.40 as at 31 Dec 2014 is above prospectus forecast of $8.32 as at June 2015. Management did not upgrade ARPU guidance at its 1H15 results, although 3PL is clearly well positioned to exceed prospectus FY15F ARPU. 3PL requires another +9% licence number growth to achieve FY15F. In 1H15, total licence numbers grew by +4.3% to 4.864m. ~9% growth in 2H15F will increase total licence numbers to FY15F prospectus of 5.301m. We believe +9% licence growth is achievable given (i) 3PL has been investing in new sales staff (particularly in the USA) and (ii) high historical growth rates, eg. 21% in FY14. 3PL is on track to beat its FY15F prospectus forecasts. TABLE 3: 1H15 RESULTS VS WHTM AND PROSPECTUS FORECASTS Source: WHTM, 3PL Revenue growth forecasts 3PL listed on 8 July 2014. At the time of the prospectus, 3PL forecast FY14 revenue of A$35.3m (and FY14 EBITDA of A$12.5m), followed by an increase of $8.5m in FY15F to A$43.8m (a 24% increase). 3PL’s FY15F prospectus revenue growth forecasts of A$8.5m comprise the following elements: $5.2m (+19%) increase in Mathletics revenue, driven by forecast growth in licence numbers across all geographic regions and an assumed 15% increase in average revenue per Australian Student Licence for Mathletics (contributing $2.5m incremental billings and $1.2m pro forma revenue). $2.3m forecast increase in net revenue from Reading Eggs licence number growth, driven by growth in licences across all geographic regions in which 3P is licensed to distribute Reading Eggs Products and a reduction in the royalty payable to Blake Group (reflecting a benefit of $0.7 million under the terms of the Sales Agency Agreement outlined in section 9.7.1) and $0.6m an assumed 15% increase in average revenue per Australian Student Licence for Reading Eggs Products; and As at 1H15, 3PL is on track to exceed its FY15F prospectus forecasts. Profitability 1H15 Prospectus FY15F WHTM FY15F WHTM FY15F vs Prospectus Profitability metrics EBITDA (A$m) 6.3 16.4 17.6 7.1% EBIT (A$m) 5 13.3 14.5 9.0% PBT (A$m) 5.3 15.1 NPAT (A$m) 4.1 11.9 Earnings drivers Average revenue per user (ARPU) $8.40 $8.32 $8.49 2.0% No. licenses (m) 4.864 5.301 5.301 0.0%
  • 11. 21 April 2015 Consumer Services 3P Learning Limited. Wilson HTM Equities Research – 3P Learning Limited. 11 $0.3 million forecast increase from revenue contribution from the South African operations which are to be acquired in conjunction with the Offer (see section 9.8.3 for further details). Earnings seasonality 3P’s business is highly seasonal and reliant on a concentration of activity at the beginning of each academic year which differs by geography. In particular, 3P derives a majority of revenues from sales transactions occurring in February and March (southern hemisphere geographies) and to a lesser degree in April, May and June (northern hemisphere geographies). ~75% of licenses are purchased at the start of the Australian school year (ie. Jan-Feb each year). While most revenue is recognised across the licence periods, cash flow is concentrated in the second half of the financial year During FY14, 3P is forecast to generate approximately 11%, 14%, 58% and 17% of Invoiced Billings and other revenue during the first, second, third and fourth quarters, respectively. The third and fourth quarters are typically 3P’s highest performing quarters as invoices are issued for approximately three quarters of annual billings, whilst the first quarter is typically 3P’s lowest performing quarter. (Source: 3PL prospectus). Accounting revenue is recognised over the licence period (typically 12 months), whilst cash flows are typically received around the time of invoicing. This results in cashflows being 75% weighted to 2H (Jan to June) each year. 3PL’s business is highly seasonal, with ~75% licences purchases in 2H each year. 25% revenue is forecast to be received in 1H14; 75% revenue in 2H14. TABLE 4: FINANCIAL HISTORY AND PROSPECTUS FORECASTS Source: WHTM, Bloomberg consensus, prospectus Key financial line items are described below. Employee expenses We forecast employee expenses to increase by 17% in FY15F driven by increased staff in the USA, particularly in sales. Employee expenses fell 28% in FY14 as; 3PL restructured its sales teams. Employee expenses are forecast to increase as new staff are hired in the USA A$m FY11 FY12 FY13 1H14 FY14 1H15 FY15F (WHTM) FY15F (consensus) FY15F (prospectus) Total revenue 23.7 28.5 32.0 15.2 36.5 18.4 43.4 43.9 43.8 Growth vs pcp 20% 12% 14% 21% 19% Employee expenses -17.8 -18.2 -21.2 -7.1 -15.3 -8.6 17.5 Growth vs pcp 2% 16% -28% 21% -215% Marketing expenses -1.6 -1.7 -1.8 -1.2 -2.0 -0.9 2.0 Growth vs pcp 6% 6% 11% -25% -198% Technology and occupancy expenses -1.9 -2.5 -3.2 -1.9 -3.6 -1.3 4.6 Growth vs pcp 32% 28% 13% -32% -227% Other expenses -2.6 -2.2 -2.3 -0.8 -2.6 -1.3 2.8 Growth vs pcp -15% 5% 13% 63% -208% Total expenses -23.9 -24.6 -28.5 -11.0 -23.5 -12.1 26.9 Growth vs pcp 3% 16% -18% 10% -214% EBITDA -0.1 3.8 3.6 4.3 13.0 6.3 16.0 17.0 16.4 Growth vs pcp -5% 261% 47% 23% Depreciation and amortisation -0.7 -1.3 -1.3 -0.8 -1.9 -1.3 3.1 Growth vs pcp 86% 0% 46% 63% -261% EBIT -0.8 2.5 2.2 3.5 11.0 5.0 12.9 14.0 13.3 Growth vs pcp 413% -12% 400% 43% 17% Interest 0.1 0.3 0.3 0.2 0.4 0.3 0.6 Growth vs pcp 200% 0% 33% 50% 50% Profit/(loss) before tax -0.7 2.8 2.5 3.6 11.4 5.3 13.5 Growth vs pcp 500% -11% 356% 47% 19% Tax (expense)/benefit -0.5 -0.2 0.2 -0.4 -2.8 -1.2 2.3 Growth vs pcp -60% -200% 1500% 200% -182% NPAT -1.2 2.6 2.7 3.2 8.5 4.1 11.2 11.5 9.7 Growth vs pcp 317% 4% 215% 28% 32%
  • 12. 21 April 2015 Consumer Services 3P Learning Limited. Wilson HTM Equities Research – 3P Learning Limited. 12 Marketing expenses We forecast marketing expenses to be $2.0m in FY15F, which is in line with FY14. Technology and occupancy expenses We forecast technology and occupancy expenses to remain flat in FY15F. Depreciation and amortisation Capitalisation of development costs to be behind the upwards trend in depreciation and amortisation expense. From FY14F onwards, 3PL intends to spend ~$10m on software development, of which 65% will be capitalised per annum. Dividend FY15F DPS of 1.8cps. Dividend policy is to pay out 20-30% of statutory NPAT, franked to the maximum extent possible. 2.5 SCENARIO ANALYSIS Table 5 summarises our discounted cash flow (DCF) valuations in bear, base and bull case scenarios. In each scenario, we vary the assumptions on two key shareholder value drivers: (i) average revenue per user and (ii) number of licences. Note that most of our scenario analysis involves variation of Australia & New Zealand’s assumptions, given the A&NZ geography currently provides ~67% total revenue (1H15), compared to 23% from EMEA and ~10% from the USA, on total 1H15 licence revenues of A$18.4m. TABLE 5: SCENARIO ANALYSIS Source: WHTM, 3PL prospectus. Note that the WHTM bull base assumes that FY20F licence growth vs FY15F is only 24% given that we assume the key driver of the bull case is +61% ARPU increases (mostly driven by Australia & NZ re-pricing), which results in increased customer churn. Base case valuation Our base case valuation is $2.78 per share. This assumes: Annual Australian & New Zealand licence growth of 5% per annum from 1H16F to FY20F. This may prove to be conservative given historical total licence growth rates of +45% in FY12 (to 3.464m), +11% in FY13 (to 3.859m), +21% in FY14 (4.665m) and +4.3% in 1H15 to 4.864m. Our base case valuation is $2.78 per share. Metric WHTM bear case WHTM base case WHTM bull case FY13 actual FY14 prospectus forecasts 1H15 actual FY15F prospectus ARPU ARPU Australia (A$) $10.21 $9.06 $8.67 Not disclosed $9.99 ARPU EMEA (A$) $7.01 $5.76 $6.50 Not disclosed $6.11 ARPU USA (A$) $7.03 $6.95 $6.86 Not disclosed $7.13 FY15F Average ARPU (A$) $8.49 $8.00 $7.82 $8.40 $8.32 FY20F Average ARPU (A$) $9.82 $10.89 $13.63 ARPU grow th % (FY20F - FY15F) 16% 28% 61% License numbers Australia (m) 2.789 2.368 2.543 2.659 2.789 EMEA (m) 1.811 0.958 1.285 1.541 1.811 USA (m) 0.701 0.337 0.464 0.664 0.701 FY15F total licences (m) 5.301 3.663 4.292 4.864 5.301 FY20F total licences (m) 6.545 7.052 6.563 Licence grow th % (FY20F - FY15F) 23% 33% 24% DCF valuation (A$) $2.01 $2.78 $3.60
  • 13. 21 April 2015 Consumer Services 3P Learning Limited. Wilson HTM Equities Research – 3P Learning Limited. 13 Average revenue per user (ARPU) of $13.37 by FY20F (vs $8.40 as at 1H15 and prospectus FY15F forecast of $8.32). Bull case valuation Our bull case valuation is $3.60 per share. This assumes: Annual Australian & New Zealand licence growth of 2% per annum (reduced from our base case of 5% p.a.) from 1H16F to FY20F. Average revenue per user (ARPU) of ~$20 by FY20F (vs base case assumption of $13.37). An obvious upside risk for 3PL is increasing Australian & New Zealand ARPU from ~$10.21 (WHTM FY15F estimate) per user to ~$20 per user. We believe that this re-pricing may be possible because: Online education may eventually replace textbooks completely, which currently retail in the range of $20-$60 per subject. 3PL successfully rolled out a +15% price increase in 1H15 in Australia, as forecast in the prospectus, with “little impact on retention rates to date” (source: 1H15 investor presentation commentary, page 12). Our base case only assumes Australian ARPU increases to $13.37 by FY20F. However, if we assume that Australian ARPU increases to $20 by FY20F, then (all else equal) our DCF valuation increases to $4.13. However, this scenario requires aggressive annual re-pricing from FY16F to FY20F of all products by ~15% per annum, with a 5% annual increase for Spellodrome. In this scenario, we would expect that customer churn would increase, and so we believe that the more appropriate bull case scenario is to assume Australian & New Zealand ARPU of $20 by FY20F, whilst annual licence volume growth in Australia & NZ declines from our base case assumption of 5% p.a. to 2% p.a. Combined, these assumptions comprise our bull case valuation of $3.60 per share. Another potential source of upside to our $3.60 per share valuation is success in driving volumes in the USA. It is too early to tell whether there is upside risk to our base case USA forecasts. Our base case valuation assumes the following assumptions for 3PL’s USA business” Annual USA licence volume growth of ~10% per annum, increasing total USA volumes off the low base of 664k to 1.164m by FY20F. Note that 3PL has been investing in its direct salesforce in the USA, has recently ended a distribution arrangement with a third party (which did not perform) and is focusing on driving USA volumes. However, at this stage, we remain cautious, given the USA is a competitive market and we will await evidence of above-expectations USA volume growth before rewarding 3PL with upgrades to our base case DCF valuation. USA ARPU increases from ~$7 in FY15F (WHTM estimate) to $8.36 in FY20F (WHTM estimate). Our bull case valuation is $3.60 per share. An obvious upside risk is re-pricing Australian ARPU more aggressively, leveraging 3PL’s local market dominance. If we assume Australian ARPU increases to $20 by FY20F without any increase in customer churn, then our DCF valuation would be $4.13 per share. Another potential upside risk is above-expectations USA sales volumes. It is too early to tell how 3PL’s USA sales drive will perform. Bear case valuation The keys risks to our base case valuation are (i) lower ARPU growth rates; and (ii) lower licence volume growth, particularly in the USA. Our bear case valuation is $2.01 per share. This assumes: Annual Australian & New Zealand ARPU growth of 3% per annum from 1H16F to FY20F, with low price growth used as a competitive response to undermine the business case of potential new entrants in the Australian market and retain 3PL’s existing local market dominance. Note that our initial analysis of competing products in the Australian market indicated little direct competition to 3PL’s local market dominance. This may prove to be conservative given historical total licence growth rates of +45% in FY12 (to 3.464m), +11% in FY13 (to 3.859m), +21% in FY14 (4.665m) and +4.3% in 1H15 to 4.864m. Our bear case valuation is $2.01 per share. This assumes 3PL limits price growth to retain its local market share dominance and that total licence volume growth is zero. Our initial competition review revealed little direct competition for 3PL’s local market dominance.
  • 14. 21 April 2015 Consumer Services 3P Learning Limited. Wilson HTM Equities Research – 3P Learning Limited. 14 Average revenue per user (ARPU) of $13.37 by FY20F (vs $8.40 as at 1H15 and prospectus FY15F forecast of $8.32). Another potential downside risk is the loss of the Reading Eggs distribution arrangement with the Blake Group. We believe that this risk is acceptable given: Reading Eggs currently only contributes A$1.0m revenue or 5.4% of total 1H15 revenue of A$18.4m (vs Mathletics A$15.4m, or 84% total revenue). We understand that 3PL is ~2 years ahead of the minimum sales volumes required to retain the Reading Eggs distribution arrangement. Another potential downside risk is loss of 3PL’s Reading Eggs distribution licence. However, we believe this risk is currently a low risk of limited impact. 3. Growth driver analysis In this section, we analyse 3PL’s 7 key growth drivers: ARPU. Cross-sell potential. Increased schools penetration. Increased student population penetration. New products. Global growth opportunity. Acquisitions 3.1 AVERAGE REVENUE PER USER (ARPU) ARPU is the average price per licence across the 3PL product range. As at 1H15, ARPU was $8.40, ahead of prospectus FY15F of $8.32. Chart 1 illustrates ARPU trends. From FY11 to FY14, ARPU declined from $9.83 to $8.41 driven by: Increasing relative contribution of lower-priced Americas and EMEA. Change in product mix/customer mix towards more of the lower priced products. In 1H15 (July – Dec 2014), ARPU was $8.40. Until FY15, 3PL had not implemented a significant price increase since 2000. From Feb 2014 to Feb 2015, 3PL re-priced its Australian Mathletics and Reading Eggs products by ~15%, with customer churn only increasing by 0.5-1% (to ~15% p.a.), despite the existence of competing products such as Skoolbo and Studyladder. WHTM forecasts FY15F ARPU of A$8.49, which captures a partial period impact of 3PL’s repricing of Australian licences by +15% from Feb 14 to Feb 15. The full impact of Australian re-pricing will be captured in 1H16F for the first time. Our bull case scenario assumes aggressive annual re-pricing from FY16F to FY20F of all products by ~15% per annum, with a 5% annual increase for Spellodrome. This may be achievable, given 3PL’s local market dominance, but we would expect that customer churn rates would consequently increase. We believe that 3PL has limited pricing power outside Australia & New Zealand. We believe 3PL has potential to be more aggressive in re-pricing its Australian Mathletics and Reading Eggs products given its local market dominance confers some pricing power in Mathletics and to a lesser degree also in Reading Eggs. Its pricing power is evident in its +15% Mathletics re-pricing from Feb 14 to Feb 15, without only ~1% increase in customer churn. Also, 3PL’s Australian Mathletics average revenue per user (ARPU) of ~A$10 (WHTM estimate) seems underweight relative to the cost of hard-copy textbooks of $30 per user and the cost of a 12-month at-home subscription for a parent of ~$80 (Reading Eggs) to $99 (Mathletics). ARPU is currently tracking ahead of prospectus forecasts. ARPU declined from FY11 to FY14 as the product and geographic mix changed. 3PL had not repriced its products since 2000. From Feb 14 to Feb 15, it increased Mathletics and Reading Eggs by +15%. We believe that there is ARPU upside risk from repricing Australian & NZ licences.
  • 15. 21 April 2015 Consumer Services 3P Learning Limited. Wilson HTM Equities Research – 3P Learning Limited. 15 CHART 1: AVERAGE REVENUE PER USER (ARPU) TRENDS Source: WHTM 3.2 CROSS-SELL POTENTIAL Online stocks frequently enjoy the medium-term upside potential to cross-sell/up- sell new or higher value products to their existing customer base. 3PL has this potential. Australian cross-sell An upside risk to our base case is that the Australian Reading Eggs/Mathletics penetration ratio exceeds our FY16F of ~37%. 3PL has significant potential to cross-sell Reading Eggs into its existing Australian & New Zealand Mathletics customer’s base. (Spellodrome is not being prioritised by 3PL and IntoScience is still a relatively new product). We estimate that in 1H15, 3PL had an Australian & NZ Reading Eggs/Mathletics customer penetration ratio (“RE/ML penetration ratio”) of ~32% (1,887 Mathletics licences and 598 Reading Eggs licences), which increases to ~37% by FY16F in our base case. Chart 2. Offshore cross-sell Offshore cross-selling potential is less material than Australia & NZ because: 3PL’s relatively low offshore revenue base (~67% 1H15 revenues were in Australia & NZ). 3PL is not licensed to sell Reading Eggs in the USA. 3PL is currently licenced to sell Reading Eggs in Australia, New Zealand, UK, Ireland, Malaysia, South Africa, Singapore, Hong Kong, Pakistan, Arabic-speaking nations, International Schools worldwide (exc. US and Canada) and other markets as may be agreed to on a case by case basis.. An upside risk to our base case is that the A&NZ Reading Eggs/Mathletics penetration ratio exceeds our FY16F of ~37%. Offshore cross-selling potential is less material than Australian & New Zealand. $6.00 $6.50 $7.00 $7.50 $8.00 $8.50 $9.00 $9.50 $10.00 $10.50 FY11 FY12 FY13 FY14 1H15 FY15F ARPU ARPU (Prosp.) ARPU (WHTMe)
  • 16. 21 April 2015 Consumer Services 3P Learning Limited. Wilson HTM Equities Research – 3P Learning Limited. 16 CHART 2: READING EGGS/ MATHLETICS AUSTRALIAN CUSTOMER PENETRATION RATIO TRENDS Source: WHTM 3.3 INCREASED SCHOOLS PENETRATION 3PL has leading market share in Australia & NZ schools, particularly with Mathletics and Reading Eggs in Australia. Chart 3. Leading market share confers pricing power and the potential to lock-out new entrants through capture of the network effect. 48% of Australian primary & secondary schools Mathletics penetration. 44% of Australian primary schools Reading Eggs penetration. 31% of NZ primary & secondary schools Mathletics penetration. 19% of NZ primary schools Reading Eggs penetration. Leading market share confers pricing power to 3PL in Australia, evidenced by its Feb 14 to Feb 15 price increases with “little impact on retention rates to date” (source: 1H15 investor presentation). Chart 3. Furthermore, we believe that 3PL has potential to increase barriers to new entrants through capturing the network effect implicit in its leading Australian market share. 3PL could capture the network effect by utilising its historical database of student performance to provide performance benchmarking data for parents and schools, and increase parental engagement, which is likely to in turn increase customer retention rates and help drive increased schools’ penetration. Leading market share confers pricing power and the potential to lock-out new entrants through capture of the network effect. 0% 5% 10% 15% 20% 25% 30% 35% 40% FY12 FY13 FY14 1H15 2H15e Australia & NZ RE/ML penetration raio (%) RE/ML penetration ratio WHTM forecasts (%)
  • 17. 21 April 2015 Consumer Services 3P Learning Limited. Wilson HTM Equities Research – 3P Learning Limited. 17 CHART 3: SCHOOLS PENETRATION RATIOS Source: WHTM 3.4 INCREASED STUDENT POPULATION PENETRATION 3PL has the potential to increase the percentage of students within any single school using 3PL products. We believe that this is a relatively low risk form of growth for 3PL. Chart 4. Currently, 3PL’s student population ratios are relatively low because: A number of schools are at an early stage of adoption, having adopted 3PL’s products for only a few classes. Student licences are more concentrated within students in school grades Kinder – Year 8. CHART 4: STUDENT POPULATION PENETRATION RATIO Source: WHTM 48% 44% 1% 31% 19% 0% 24% 4% 0% 7% 0% 0%1% 0% 0% 0% 10% 20% 30% 40% 50% 60% Mathletics Reading Eggs IntoScience Aus NZ UK Canada US % of primary and secondary schools 37% 29% 1% 15% 7% 0% 12% 3% 0% 3% 0% 0% 1% 0% 0% 0% 5% 10% 15% 20% 25% 30% 35% 40% Mathletics Reading Eggs IntoScience Aus NZ UK Canada US % of primary and secondary students % of primary students % of primary and secondary students
  • 18. 21 April 2015 Consumer Services 3P Learning Limited. Wilson HTM Equities Research – 3P Learning Limited. 18 3.5 NEW PRODUCTS 3PL currently has products which cover mathematics (Mathletics), literacy (Reading Eggs), spelling (Spellodrome) and science (IntoScience). IntoScience – a new online education category 3PL has potential to capture first mover advantage in online science education, given that this is a relatively new segment. IntoScience is 3PL’s latest product offering. It was fully launched into Australia and New Zealand in 2014 and is set to be offered in all operational territories by 2016. IntoScience is building considerable momentum, growing to 46,000 licences in 1H15, with prospectus forecasts of 98,000 by 2H15F. 3PL has potential to capture first mover advantage in online science education, given that this is a relatively new category. 3.6 GLOBAL GROWTH “The Americas” The Americas are the key global growth focus for 3PL. In 1H15, the Americas (ie. USA and Canada) contributed ~10% total licence revenue of A$18.4m. At the end of FY14, 3PL had a 110 strong global salesforce. In 1H15, 3PL increases its staff investment by ~A$1.5m, establishing a USA direct salesforce. Chart 3 illustrates that 3PL has only penetrated ~1% of the USA schools population, highlighting the size of the potential prize. Given 3PL has only penetrated 1% of US schools with Mathletics, there is significant scope for strong licence growth as their presence becomes more established. The USA is a key target for growth. 3PL has only penetrated ~1% of the USA schools population, highlighting the size of the potential prize. Europe, Middle East, Africa (EMEA) In 1H15, EMEA contributed ~23% of total licence revenue of $18.4m. The majority of this revenue is from the UK. In 2014, 3PL commenced the development of a Chinese language version of Mathletics. The launch of this product may create first mover advantage in the relatively underdeveloped Chinese online education sector. 3.7 ACQUISITIONS 3PL has potential to acquire value-adding bolt-on acquisitions. Some recent acquisitions include: In 1H14, 3PL acquired Whatiph. 3PL acquired Whatiph for A$1.3m plus an earn out of up to $0.6m. Whatiph was a distributor of products including Mathletics and Spellodrome in South Africa. As part of the agreement, Whatiph will continue to be 3PL’s distributor of the products in South Africa and other parts of southern Africa. In 2014, 3PL acquired the remaining 35% of IntoScience. In March 2015, 3PL acquired a 17% stake in US online education company Desmos, for A$5m. Desmos provides a free online graphics calculator and other mathematical activities for teachers and students. Desmos generates revenue through publishing companies buying the right to integrate the online calculator into their own digital textbooks. Desmos gives 3PL the opportunity to diversify their mathematics business into calculator technology and related activities, which primarily targets secondary students – a demographic of perceived weakness for Mathletics and 3PL. Other potential acquisitions include: Product distributors, such as Whatiph. Content creators, such as Blake Group (owner of Reading Eggs).
  • 19. 21 April 2015 Consumer Services 3P Learning Limited. Wilson HTM Equities Research – 3P Learning Limited. 19 4. Business description 4.1 HISTORY 3PL listed on the ASX in July 2014 at $2.50 per share. 3PL was established in Australia in 2004 by Shane Hill and Matthew Sandblom, initially only producing a Mathletics CD-ROM for student in grades Kindergarten-10. 3PL subsequently expanded into cloud based e-learning and broadened its product offerings to also include: Spelling (Spellodrome 2006). Reading (Reading Eggs 2011). Science (IntoScience 2013). 3PL also pursued an international and multi-lingual expansion, commencing operations in:  New Zealand (2006).  Europe, the Middle East and Africa (EMEA) (2006).  US (2007).  Canada (2009).  Hong Kong (2010). In 2014, 3PL commenced the development of a Chinese language version of Mathletics. 3PL was established in 2004 and listed in 2014 at $2.50 per share. 4.2 BUSINESS MODEL Business model 3PL provides online education products in numeracy, literacy and science. The products are described below. The key products are Mathletics and Reading Eggs. IntoScience is a new growth product and Spellodrome is an alternative to Reading Eggs, but not an emphasis of 3PL. Mathletics Mathletics is 3PL’s flagship product. It is an interactive online numeracy program which has captured substantial market share in Australian schools, with ~48% using the product for at least one class. Mathletics generated ~84% of 1H15 licence revenue of A$18.4m. Reading Eggs and Reading Eggspress (“Reading Eggs products”) Reading Eggs is a literacy program targeted at students in Kindergarden to Year 2, providing a combination of interactive games, songs and animations. Reading Eggspress is designed for Kindergarden to Year 6, and provides access to >1700 eBooks and related activities. 3PL does not own the Reading Eggs products. Instead, 3PL is merely a distributor under a licence agreement with the Blake Group. 3PL pays a 40% sales royalty to the Blake Group, with the Blake Group responsible for hosting the online platforms. 3PL has minimum sales volumes required under the contract, which are tested annually at June year. Reading Eggs generated ~5% of 1H15 licence revenue of A$18.4m. Spellodrome Spellodrome is a literacy program focused on increasing student engagement through live competition amongst students and word games. It is not a core focus on 3PL. Spellodrome generated $0.8m in 1H15, ~4% of 1H15 licence revenue. Mathletics is 3PL’s flagship product, generating ~84% 1H15 licence revenue. Reading Eggs is sold under a licence arrangement with the Blake Group. Spellodrome is not a key focus.
  • 20. 21 April 2015 Consumer Services 3P Learning Limited. Wilson HTM Equities Research – 3P Learning Limited. 20 IntoScience IntoScience targets secondary school students. It is the most recent of 3PL’s products and is expected to be launched into all of 3PL’s main territories by 2016. It provides simulations, experiments and activities to demonstrate scientific concepts to students. In 1H15, it generated A$0.2m revenue. IntoScience is a new product. 4.3 REVENUE MODEL Revenue model Products are sold on a per student basis in the form of Student and Home licences that typically have a one year term Approx. 91% of 3PL’s revenue is from Student Licences through schools. The remaining ~9% of revenue is from the sale of Home Licences, copyright fees, sponsorships and licensing agreements. Revenue is generated by selling one-year student and home licences. ~91% revenue is from Student Licences through schools. Revenue mix Table 6 summarises 3PL’s revenue mix by geography and product. . TABLE 6: REVENUE MIX Source: WHTM, 3PL 4.4 COMPETITION Global competition The global online education market is competitive and fragmented. Private equity firms are quite active in this segment (refer Comparable Acquisitions Table 8). In Australia and NZ, in contrast, 3PL has leading market positions with both Mathletics and Reading Eggs. There is a range of different business models/companies with potential to or currently competing in the market. These companies include: Traditional publishing companies such as Pearson Education, McGraw Hill, and Oxford University Press. This group generates significant revenue from printed materials and many are currently developing strategies for the online learning segment including acquisitions, combined online/print offerings and new online product development. Online education resource companies such as Kahn Academy and Dreambox. This group offers free or freemium (ie. free product with payment required for feature upgrades) products. Many are focused on a particular segment, geography or subject. The global online education market is competitive and fragmented. In Australia and NZ, 3PL has leading market share with Mathletics and Reading Eggs. A$M %FY14 FY14 %1H15 1H15 Revenue mix by geography Aust & NZ 67.4% 24.6 66.8% 12.3 Europe, Mid-East, Africa (EMEA) 23.6% 8.6 22.8% 4.2 Americas 9.0% 3.3 10.3% 1.9 Totals 100.0% 36.5 100.0% 18.4 Revenue mix by product Mathletics 78.3% 28.5 83.7% 15.4 Reading Eggs 11.0% 4.0 5.4% 1.0 Spellodrome 4.4% 1.6 4.3% 0.8 IntoScience 0.0% 0.0 1.1% 0.2 Other 6.3% 2.3 5.4% 1.0 Totals 100.0% 36.4 100.0% 18.4
  • 21. 21 April 2015 Consumer Services 3P Learning Limited. Wilson HTM Equities Research – 3P Learning Limited. 21 Large software corporations such as Apple, Microsoft and Amazon. These are well resourced organisation with the flexibility to offer a range of learning tools. Educational technology and platform providers such as Edmodo, Moodle and Knewton. Some are open source; many offer free or freemium products and cross-curricula virtual learning environments. TABLE 7: A SELECTION OF CURRENT AND POTENTIAL COMPETITORS Source: 3PL prospectus Australian competition Competition includes Skoolbo, Studyladder and Literacy Planet. We describe these competitors below Skoolbo Skoolbo is an online provider of literacy and numeracy programs targeted at grades Kindergarden – Year 4. Shane Hill, the CEO and founder of Skoolbo, is a former teacher and was a 3PL co- founder and employee until 2008. Skoolbo has a high quality shareholder register. Skoolbo is backed by the University of Wollongong, Save the Children and most recently Fairfax Media took a minority stake (undisclosed quantum) in late 2014. Skoolbo’s model is to give the product away to schools for free, with fees charged for product upgrades. Skoolbo plans a Gold licence account upgrade in mid-2015. It remains to be seen whether Skoolbo can actually monetise the high market share it has claimed through its product give-away. It is a risky, but potentially disruptive, business strategy. However, to date, its product features do not compare with the quality of 3PL’s products. Skoolbo is yet to prove the viability of its “free then monetise” pricing strategy. Studyladder Studyladder is a free but upgradable online education platform developed by teachers offering programs including numeracy, literacy, science, language, art and music. The programs have been adapted and expanded into 20 countries.
  • 22. 21 April 2015 Consumer Services 3P Learning Limited. Wilson HTM Equities Research – 3P Learning Limited. 22 We do not consider Studyladder to be a substantial threat to 3PL for two reasons. Studyladder has co-existed with 3PL in Australia for years whilst 3PL has achieved outstanding licence and ARPU growth. Studyladder is a much broader offering of a range of free products across a range of disciplines, as opposed to 3PL’s more narrow, limited offering of higher quality products. We do not consider Studyladder to be a substantial threat to 3PL because it has co-existed with 3PL for years, with limited adverse impact on 3PL’s ongoing growth. Literacy Planet Intrepica (owner of Literacy Planet) was established in 2008. Literacy Planet offers a product competing with Reading Eggs in the Australian & New Zealand markets and has recently been recapitalised by significant investors with online education experience. Investors include Ellerston Capital and Nine Entertainment Co. Nine invested ~$6m in cash and advertising contras in July 2014 for a 30% stake, making it Intrepica’s largest single shareholder. Nine was previously an investor in 3PL, but exited after Nine’s owner, CVC Asia Pacific, required a quick exit to reduce debt. Our initial view is that Literacy Planet will not adversely impact 3PL given differences in: Channel marketing strategics. Literacy Planet targets the K-9 demographic by selling direct to consumers/parents (compared to 3PL’s focus on schools). Product pricing. Literacy Planet is priced at ~$95 per annum, compared to 3PL ARPU for Australia of A$10.21. At this stage, the evidence suggests that 3PL has not been adversely impacted by Literacy Planet, with Literacy Planet having only ~85,000 users across Australia and overseas compared to 3PL’s 2.659m Australian & NZ licences. Our initial view is that Literacy Planet will not adversely impact 3PL. USA competition Competition includes Deambox, IXL, Amplify and Edmentum. Dreambox Dreambox operates predominantly in the United States and Canada offering a similar numeracy product to Mathletics. Similar to 3PL, it has received a number of innovation awards in the US and appears to possess a high quality product like Mathletics. Dreambox is priced at US$120 per annum direct to consumers, which will favour 3PL during its expansion into the Americas. It also sells directly into schools. Mathletics is cheaper than Dreambox. IXL IXL targets the K-12 demographic with an interactive eLearning numeracy product which functions in a similar way to Dreambox and 3PL’s respective offerings. IXL charges $79 per annum for direct annual licence use and also markets direct to schools. . Amplify One hurdle for Amplify is its pricing – it requires users to purchase its Amplify Tablet for US$359 per user. Amplify provides learning via its Android based Amplify Tablet in the US. It targets the K-12 demographic but competes in a different manner to 3PL – it requires schools to switch to its tablet for the products, instead of using any device. Amplify’s advantage is its backers – it is backed by NewsCorp, which has invested over US$500m in its products. However, its expansion is still in its early stages. One hurdle for Amplify is that is requires schools and students to purchase its Amplify Tablet at US$359 per tablet.
  • 23. 21 April 2015 Consumer Services 3P Learning Limited. Wilson HTM Equities Research – 3P Learning Limited. 23 Edmentum Edmentum will directly compete with 3PL in its planned expansion into the USA. Edmentum operates an online learning platform in the USA with numeracy, literacy, science and ESL products. It is also a distributor of Reading Eggs/Eggspress. 3PL does not have the rights to distribute Reading Eggs in the USA. Similar to 3PL, its product suite is interactive with teacher/parent ease of monitoring student progress. It also facilitates tailored teaching to prevent ‘drop-outs’ and enhance graduation rates, which is over and above the suite offered by 3PL. Edmentum is a direct competitor to 3PL in its USA expansion plans. 4.5 INDUSTRY Online education is a high growth sector. IBIS Capital predicts that the Prep-12 online education sector will quadruple in size from US$16.6 billion in 2012 to US$69.0 billion in 2017 Key drivers of this tailwind are: Increasing education spending by Governments seeking national competitive advantage. For almost every OECD nation, education spending as a percentage of GDP has increased from 2000 to 2011. Chart 5. Transition from print to online resources. Online education is a high growth sector. CHART 5: TRENDS IN EDUCATION SPENDING
  • 24. 21 April 2015 Consumer Services 3P Learning Limited. Wilson HTM Equities Research – 3P Learning Limited. 24 5. Corporate 5.1 BOARD Samuel Weiss, Independent Non-Executive Chairperson Joined in June 2014. Mr Weiss has over 20 years of experience in senior management and directorship roles, as well as broad experience in education, technology and retail companies across the world. Mr Weiss’s other current appointments include Chairman of Altium Limited and Independent Director of Oroton Group Limited, Breville Group Limited and iBuy Limited. Timothy Power, Chief Executive Officer Mr Power has played a key role in 3PL since its early stages. Joined in 2004 and became CEO in 2007. Mr Power has 15 years of experience in education technology development, and was the co-founder of World Education Games, Into Science Pty Ltd, ClickView Pty Ltd and Coraggio Pty Ltd. Roger Amos, Independent Non-Executive Director Joined in June 2014. Mr Amos possesses over 25 years of experience in finance, business and accounting and was previously a partner at KPMG for 25 years. Formerly a director of Austar United Communication Limited, Mr Amos’ other current engagements include Non-Executive Director of REA Group Limited, Chairman of Tyrian Diagnostics Limited and Deputy Chairman of Enero Group Limited. Claire Hatton, Independent Non-Executive Director Joined in June 2014. Ms Hatton has over 20 years of experience in strategy, sales, marketing and operations, including significant experience in the digital and technology market. Ms Hatton has previously held senior positions at Google, Travelport and Zuji.com. CEO Tim Power has been with 3PL since 2004. Roger Amos has online experience at REA Group. Claire Hatton has significant digital and technology experience. 5.2 MANAGEMENT Timothy Power, Chief Executive Officer Refer description above. Jonathan Kenny, Chief Financial Officer Mr Kenny has over 20 years of experience in finance and operations roles for ASX listed and multinational companies, as well as broad industry experience in fields such as publishing, software, property development, data and analytics. Prior to joining 3PL, Mr Kenny was CFO of RP Data Limited and Bravura Solutions Pty Ltd. 5.3 REGISTER Table 8 summarises the pre-IPO and post-IPO shareholdings. The key points are: CEO Tim Power holds 3.036 m shares. Pascal Press owns 10.2% of 3PL. 3PL’s initial private equity backers, Macquaire Special Situations Master Fund and Insight Venture Partners, have exited 3PL completely. 16.2% of ordinary shares (21.9m) will be held in escrow the day after 3PL’s FY15 results release.
  • 25. 21 April 2015 Consumer Services 3P Learning Limited. Wilson HTM Equities Research – 3P Learning Limited. 25 TABLE 8: SHARE REGISTER 16.2% of stock is in escrow until FY15 results release. Source: WHTM, 3PL prospectus 6. Risks and catalysts 6.1 UPSIDE RISKS ARPU increases An obvious upside risk for 3PL is increasing Australian & New Zealand ARPU from ~$10.21 (WHTM FY15F estimate) per user to ~$20 per user. We believe that this re-pricing may be possible because: Online education may eventually replace textbooks completely, which currently retail in the range of $20-$60 per subject. 3PL successfully rolled out a +15% price increase in 1H15 in Australia, as forecast in the prospectus, with “little impact on retention rates to date” (source: 1H15 investor presentation commentary, page 12). Bolt-on acquisitions 3PL has already demonstrated a propensity to execute small bolt-on acquisitions such as Whatiph, IntoScience and Desmos. Sector growth The online learning sector is expected to quadruple in size to US$69bn compared to 2012. Sector growth may exceed expectations. New product momentum IntoScience is 3PL’s fastest growing product in the emerging category of online science education. In FY14, 3PL sold 46,650 IntoScience licences, a significant increase from 4,000 licences in 2013. However, growth is still off a low base, comprising only 1% of total FY14 licence numbers. The IntoScience pilot program commenced in 2013 and was fully launched into Australia for grades 7 and 8 in 2014. It is expected to be expanded into all of 3PL’s operating territories by 2016. 6.2 DOWNSIDE RISKS Blake Group licensing arrangement Blake Group’s licensing arrangement with 3PL presents renewal and product quality maintenance risks. 3PL has an agreement with the Blake Group to distribute the Reading Eggs products, paying the Blake Group a 40% royalty. The risks are: Blake Group’s licensing arrangement with 3PL presents renewal and product quality maintenance risks.
  • 26. 21 April 2015 Consumer Services 3P Learning Limited. Wilson HTM Equities Research – 3P Learning Limited. 26 This distribution agreement may be terminated. The distribution agreement may by renewed on less favourable terms. 3PL has no control over maintenance of product quality. 3PL can only distribute Reading Eggs in Australia, New Zealand, UK, Ireland, Malaysia, South Africa, Singapore, Hong Kong, Pakistan, Arabic-speaking nations, International Schools worldwide (exc. US and Canada) and other markets as may be agreed to on a case by case basis. Technology risks Use of technology presents inherent risks such as: Data disruption from the hosting platforms. Need to be interoperable with other technologies used by schools. Data loss or theft. These events could incur significant costs in rectification and reputational damage. Competition Global markets are fragmented and competitive. In Australia &NZ, 3PL has leading market shares in Mathletics and Reading Eggs, but the threat of emerging competition remains. In response, 3PL has the potential to erect entry barriers over time, leveraging its leading market shares to capture the network effect. Customer churn Increasing ARPU aggressively may lead to increased customer churn. However, 3PL noted it has increased its Australian prices by +15% from Feb 14 with “little impact on retention rates to date”. Government related risks 3PL is exposed to: Changes in government policy pertaining to education providers and/or education expenditure. Government selection of a particular provider other than 3PL. Changing curricula. Key person risk CEO Tim Power’s stock will be released from escrow around August 2015. It is not clear what succession planning strategies may or may not currently be in place.
  • 27. 21 April 2015 Consumer Services 3P Learning Limited. Wilson HTM Equities Research – 3P Learning Limited. 27 RETURN RE-INVESTMENT MATRIX RISK MEASURES Return High Cash Generator Champion Low Challenged Potential Low High Re-investment Low Med High Spec Share Price Risk Business Risk BUSINESS DESCRIPTION 3P Learning (3PL) is a global provider of interactive online learning software and is the dominant market firm in Australia, New Zealand and the UK. Listed on the ASX in July 2014, 3PL is the only firm of its kind to have gone public in Australia. 3PL’s flagship product is Mathletics, with other products in its suite including Reading Eggs, Spellodrome and, after a successful acquisition, IntoScience. The target demographic for 3PL’s products remains grades Kindergarten-12. 3PL’s multi award-winning product suite and competitive pricing has provided for strong growth over the past decade as well as expansion into key markets in North America and the Middle East. 3PL was founded in 2004 and is based in Sydney, Australia. INVESTMENT THESIS We believe that 3PL is strongly positioned to capitalise on structural sector growth through its expanding market presence, brand recognition and leading suite of products. 3PL occupies a dominant market position in ANZ as well as the UK, allowing for margin expansion by leveraging Mathletics penetration to cross-sell products and increase ARPU. A foothold has been established in the key North America market which creates a significant licence number growth opportunity. 3PL is in the process of developing Chinese language versions of their products, and the firm has high levels of cash to pursue an aggressive expansion into China. The underlying reason for 3PL’s success remains the high quality of its product suite, and it is our belief that this provides a unique competitive advantage which will create opportunities in its expansion markets. The new product momentum of IntoScience will also drive earnings growth over time. 3PL possesses a capital light, highly scalable business model to provide a basis for margin growth. When 3PL consolidates its positions in the new markets, there is scope for the utilisation of the pricing lever to boost ARPU, EBITDA and margins further, as has been the case in ANZ. We believe 3PL will deliver strong earnings growth in the years to come as it c apitalises on structural sector growth with its scalable business model and high quality products. REVENUE DRIVERS BALANCE SHEET  Increase the number of licences and school customers.  Increase penetration of products in existing school customer base.  Cross-sell products to new and existing customers principally leveraged off Mathletics.  Improve ARPU through price increases over time.  Cash: $15.81m  Debt: $0  Net debt: - $15.81m MARGIN DRIVERS BOARD  Number of licences.  Increase in ARPU.  Developing and maintaining product suite.  Cross-selling products.  Highly scalable software infrastructure  Samuel Weiss, Independent Non-Executive Chairperson  Timothy Power, Director & CEO  Roger Amos, Independent NED  Claire Hatton, Independent NED KEY ISSUES/CATALYSTS MANAGEMENT  ARPU increases over time boosting EBITDA and margins.  Strong structural sector growth.  New product momentum of IntoScience.  US expansion into huge market.  Consolidation of EMEA operations should drive margin.  Medium-long term expansion into China.  Timothy Power, CEO  Jonathan Kenny, CFO and Company Secretary RISK TO VIEW CONTACT DETAILS  Competition, particularly in the US, restricting licence and ARPU growth.  Technology being superseded and/or internal software breakdown.  Regulatory changes affecting education spending and/or online education providers.  Customer churn with price increases.  Reading Eggs distribution agreement with Blake Group breaking down or becoming unfavourable.  Personnel risk. Losing Tim Power or a failure to innovate. Address: Level 18, 124 Walker St, North Sydney NSW 2060 Australia Phone: 1300 850 331 Website: www.3plearning.com
  • 28. 21 April 2015 Consumer Services 3P Learning Limited. Wilson HTM Equities Research – 3P Learning Limited. 28 Head of Research Head of Institutional Sales Shane Storey (07) 3212 1351 Richard Moulder (02) 8247 6603 Industrials Sydney James Ferrier (03) 9640 3827 Jonathan Scales (02) 8247 6613 Stewart Oldfield (03) 9640 3818 Duncan Gamble (02) 8247 6629 George Gabriel (03) 9640 3864 Michael Pegum (02) 8247 6602 Andrew Dalziel (07) 3212 1946 Anthony Wilson (02) 8247 3113 Liam Schofield (02) 8247 3173 Peter Tebbutt (02) 8247 6682 Healthcare and Biotechnology Melbourne Shane Storey (07) 3212 1351 David Permezel (03) 9640 3885 Joseph Michael (02) 8247 3101 Adam Dellaway (03) 9640 3824 Resources Phillip Chippindale (02) 8247 3149 Wealth Management Research James Redfern (02) 8247 6609 Peter McManus (02) 8247 3186 Quantitative John Lockton (02) 8247 3118 Nathan Szeitli (03) 9640 3806 Rebecca Sandys (02) 8247 6670 Email: firstname.lastname@wilsonhtm.com.au National Offices Brisbane Ph: (07) 3212 1333 Sydney Ph: (02) 8247 6600 Melbourne Ph: (03) 9640 3888 Gold Coast Ph: (07) 5509 5500 Dalby Ph: (07) 4660 8000 Hervey Bay Ph: (07) 4197 1600 Our website: www.wilsonhtm.com.au Return Reinvestment Matrix and Risk Measures Definitions at http://www.wilsonhtm.com.au/Disclosures Recommendation Structure and Other Definitions Definitions at http://www.wilsonhtm.com.au/Disclosures Disclaimer Whilst Wilson HTM Ltd believes the information contained in this communication is based on reliable information, no warranty is given as to its accuracy and persons relying on this information do so at their own risk.To the extent permitted by law Wilson HTM Ltd disclaims all liability to any person relying on the information contained in this communication in respect of any loss or damage (including consequential loss or damage) however caused, which may be suffered or arise directly or indirectly in respect of such information.Any projections contained in this communication are estimates only.Such projections are subject to market influences and contingent upon matters outside the control of Wilson HTM Ltd and therefore may not be realised in the future. The advice contained in this document is general advice.It has been prepared without taking account of any person’s objectives, financial situation or needs and because of that, any person should, before acting on the advice, consider the appropriateness of the advice, having regard to the client’s objectives, financial situation and needs.Those acting upon such information without first consulting one of Wilson HTM Ltd investment advisors do so entirely at their own risk.This report does not constitute an offer or invitation to purchase any securities and should not be relied upon in connection with any contract or commitment whatsoever.If the advice relates to the acquisition, or possible acquisition, of a particular financial product – the client should obtain a Product Disclosure Statement relating to the product and consider the Statement before making any decision about whether to acquire the product.This communication is not to be disclosed in whole or part or used by any other party without Wilson HTM Ltd’s prior written consent. Disclosure of Interest. 3P Learning Limited. The Directors of Wilson HTM Ltd advise that at the date of this report they and their associates have relevant interests in 3P Learning Limited.. They also advise that Wilson HTM Ltd and Wilson HTM Corporate Finance Ltd A.B.N. 65 057 547 323 and their associates have received and may receive commissions or fees from 3P Learning Limited. in relation to advice or dealings in securities.Some or all of Wilson HTM Ltd authorised representatives may be remunerated wholly or partly by way of commission. In producing research reports, members of Wilson HTM Ltd Research may attend site visits and other meetings hosted by the issuers the subject of its research reports. In some instances the costs of such site visits or meetings may be met in part or in whole by the issuers concerned if Wilson HTM Ltd considers it is appropriate and reasonable in the specific circumstances relating to the site visit or meeting. Please see disclosures at http://www.wilsonhtm.com.au/Disclosures. Disclosures applicable to companies included in this reportcan be found in the latest relevant published research.