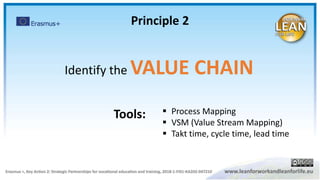
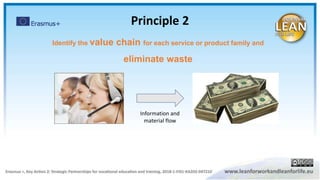
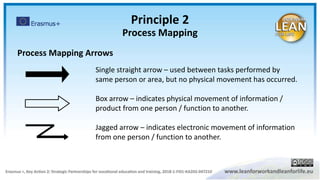
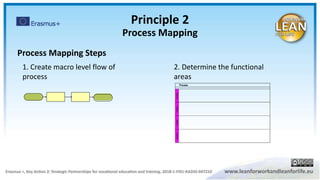
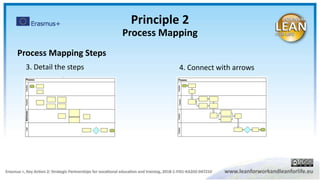
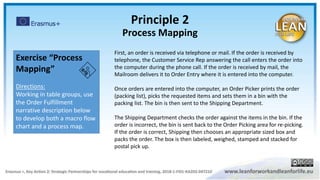
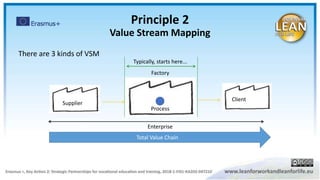
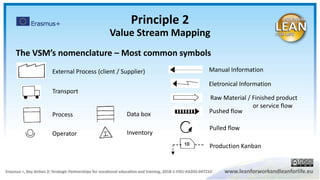
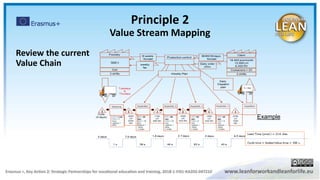
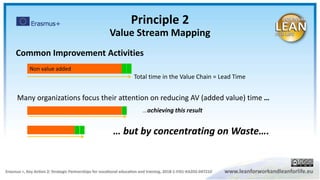
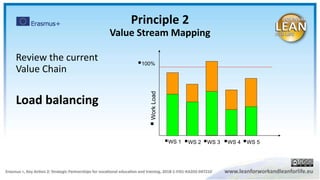
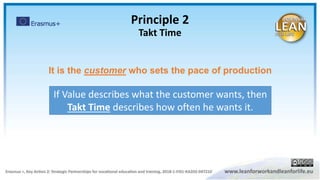
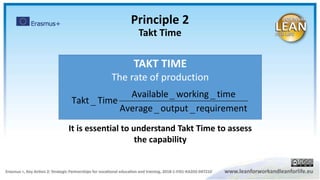
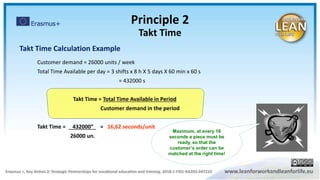
T02
BASIC LEAN TRAINING
Principle 2
Identify the value chain
Objectives
The objectives of this chapter are:
Identify the Value chain using lean methods
Principle 2
Identify the VALUE CHAIN
 Process Mapping
 VSM (Value Stream Mapping)
 Takt time, cycle time, lead time
Tools:
Information and
material flow
Identify the value chain for each service or product family and
eliminate waste
Principle 2
Advantages:
The global view of all processes and not just the
visualization of individual processes
Understand the relationships between the
various process steps and the various times and
the effect of balancing the flow
Identify Waste
Optimization of the whole
Dynamic document
Mapping of the
Value Chain
Principle 2
Principle 2
Process Mapping
Process Maps are used to:
 Capture current & new process information
 Identify flow of transaction
 Identify responsibility of different business functions
 Clearly show hand-off between functions
 Identify Value Added (VA) & Non Value Added (NVA) activities
Principle 2
Process Mapping
4 Steps to Create a Process Map
1. Create macro level flow of process
2. Determine functional areas
3. Detail the steps
4. Connect with arrows
Process Mapping Shapes
Function Functional areas within a
process
Beginningandendpoints of
the process.
Any task / activity where work is
performed. Usually written as a
noun and a verb.
Places where information is checked
against established criteria (standards)
& decision is made on what to do next.
Any time information is waiting before
the next process or decision (i.e. in-
baskets, out-baskets, waiting to be
batched)
When information / product is placed in
inventory (i.e. a file cabinet, directory).
Principle 2
Process Mapping
Single straight arrow – used between tasks performed by
same person or area, but no physical movement has occurred.
Box arrow – indicates physical movement of information /
product from one person / function to another.
Jagged arrow – indicates electronic movement of information
from one person / function to another.
Process Mapping Arrows
Principle 2
Process Mapping
1. Create macro level flow of
process
2. Determine the functional
areas
Process
FunctionFunctionFunctionFunction
Principle 2
Process Mapping
Process Mapping Steps
3. Detail the steps 4. Connect with arrows
Process Mapping Steps
Principle 2
Process Mapping
Exercise “Process
Mapping”
Directions:
Working in table groups, use
the Order Fulfillment
narrative description below
to develop both a macro flow
chart and a process map.
First, an order is received via telephone or mail. If the order is received by
telephone, the Customer Service Rep answering the call enters the order into
the computer during the phone call. If the order is received by mail, the
Mailroom delivers it to Order Entry where it is entered into the computer.
Once orders are entered into the computer, an Order Picker prints the order
(packing list), picks the requested items and sets them in a bin with the
packing list. The bin is then sent to the Shipping Department.
The Shipping Department checks the order against the items in the bin. If the
order is incorrect, the bin is sent back to the Order Picking area for re-picking.
If the order is correct, Shipping then chooses an appropriate sized box and
packs the order. The box is then labeled, weighed, stamped and stacked for
postal pick up.
Principle 2
Process Mapping
There are 3 kinds of VSM
Process
Factory
Enterprise
Supplier
Client
Total Value Chain
Typically, starts here...
Principle 2
Value Stream Mapping
Example
Principle 2
Value Stream Mapping
External Process (client / Supplier)
Transport
Process Data box
Inventory
Eletronical Information
Manual Information
Raw Material / Finished product
or service flow
Pushed flow
Pulled flow
Production Kanban
Operator
Principle 2
Value Stream Mapping
The VSM’s nomenclature – Most common symbols
Example
Principle 2
Value Stream Mapping
Review the current
Value Chain
…achieving this result
Many organizations focus their attention on reducing AV (added value) time …
Non value added
… but by concentrating on Waste….
Total time in the Value Chain = Lead Time
Principle 2
Value Stream Mapping
Common Improvement Activities
100%
WS 1 WS 2 WS 3 WS 4 WS 5
WorkLoad
Principle 2
Value Stream Mapping
Review the current
Value Chain
Load balancing
It is the customer who sets the pace of production
Principle 2
Takt Time
If Value describes what the customer wants, then
Takt Time describes how often he wants it.
TAKT TIME
The rate of production
trequiremenoutputAverage
timeworkingAvailable
TimeTakt
__
__
_
It is essential to understand Takt Time to assess
the capability
Principle 2
Takt Time
Customer demand = 26000 units / week
Total Time Available per day = 3 shifts x 8 h X 5 days X 60 min x 60 s
= 432000 s
Takt Time = Total Time Available in Period
Customer demand in the period
Takt Time = 432000” = 16,62 seconds/unit
26000 un.
Maximum, at every 16
seconds a piece must be
ready, so that the
customer’s order can be
matched at the right time!
Takt Time Calculation Example
Principle 2
Takt Time
https://www.youtube.com/watch?v=3osu7aJHwk0
Video: Improved Coffee Kaizen
LEAN FOR WORK AND LEAN FOR LIFE
Train the trainer to teach Lean skills in VET

Lean for work and Lean for life - 2 - Value chain

  • 1.
    T02 BASIC LEAN TRAINING Principle2 Identify the value chain
  • 2.
    Objectives The objectives ofthis chapter are: Identify the Value chain using lean methods
  • 3.
    Principle 2 Identify theVALUE CHAIN  Process Mapping  VSM (Value Stream Mapping)  Takt time, cycle time, lead time Tools:
  • 4.
    Information and material flow Identifythe value chain for each service or product family and eliminate waste Principle 2
  • 5.
    Advantages: The global viewof all processes and not just the visualization of individual processes Understand the relationships between the various process steps and the various times and the effect of balancing the flow Identify Waste Optimization of the whole Dynamic document Mapping of the Value Chain Principle 2
  • 6.
    Principle 2 Process Mapping ProcessMaps are used to:  Capture current & new process information  Identify flow of transaction  Identify responsibility of different business functions  Clearly show hand-off between functions  Identify Value Added (VA) & Non Value Added (NVA) activities
  • 7.
    Principle 2 Process Mapping 4Steps to Create a Process Map 1. Create macro level flow of process 2. Determine functional areas 3. Detail the steps 4. Connect with arrows
  • 8.
    Process Mapping Shapes FunctionFunctional areas within a process Beginningandendpoints of the process. Any task / activity where work is performed. Usually written as a noun and a verb. Places where information is checked against established criteria (standards) & decision is made on what to do next. Any time information is waiting before the next process or decision (i.e. in- baskets, out-baskets, waiting to be batched) When information / product is placed in inventory (i.e. a file cabinet, directory). Principle 2 Process Mapping
  • 9.
    Single straight arrow– used between tasks performed by same person or area, but no physical movement has occurred. Box arrow – indicates physical movement of information / product from one person / function to another. Jagged arrow – indicates electronic movement of information from one person / function to another. Process Mapping Arrows Principle 2 Process Mapping
  • 10.
    1. Create macrolevel flow of process 2. Determine the functional areas Process FunctionFunctionFunctionFunction Principle 2 Process Mapping Process Mapping Steps
  • 11.
    3. Detail thesteps 4. Connect with arrows Process Mapping Steps Principle 2 Process Mapping
  • 12.
    Exercise “Process Mapping” Directions: Working intable groups, use the Order Fulfillment narrative description below to develop both a macro flow chart and a process map. First, an order is received via telephone or mail. If the order is received by telephone, the Customer Service Rep answering the call enters the order into the computer during the phone call. If the order is received by mail, the Mailroom delivers it to Order Entry where it is entered into the computer. Once orders are entered into the computer, an Order Picker prints the order (packing list), picks the requested items and sets them in a bin with the packing list. The bin is then sent to the Shipping Department. The Shipping Department checks the order against the items in the bin. If the order is incorrect, the bin is sent back to the Order Picking area for re-picking. If the order is correct, Shipping then chooses an appropriate sized box and packs the order. The box is then labeled, weighed, stamped and stacked for postal pick up. Principle 2 Process Mapping
  • 13.
    There are 3kinds of VSM Process Factory Enterprise Supplier Client Total Value Chain Typically, starts here... Principle 2 Value Stream Mapping
  • 14.
  • 15.
    External Process (client/ Supplier) Transport Process Data box Inventory Eletronical Information Manual Information Raw Material / Finished product or service flow Pushed flow Pulled flow Production Kanban Operator Principle 2 Value Stream Mapping The VSM’s nomenclature – Most common symbols
  • 16.
    Example Principle 2 Value StreamMapping Review the current Value Chain
  • 17.
    …achieving this result Manyorganizations focus their attention on reducing AV (added value) time … Non value added … but by concentrating on Waste…. Total time in the Value Chain = Lead Time Principle 2 Value Stream Mapping Common Improvement Activities
  • 18.
    100% WS 1 WS2 WS 3 WS 4 WS 5 WorkLoad Principle 2 Value Stream Mapping Review the current Value Chain Load balancing
  • 20.
    It is thecustomer who sets the pace of production Principle 2 Takt Time If Value describes what the customer wants, then Takt Time describes how often he wants it.
  • 21.
    TAKT TIME The rateof production trequiremenoutputAverage timeworkingAvailable TimeTakt __ __ _ It is essential to understand Takt Time to assess the capability Principle 2 Takt Time
  • 22.
    Customer demand =26000 units / week Total Time Available per day = 3 shifts x 8 h X 5 days X 60 min x 60 s = 432000 s Takt Time = Total Time Available in Period Customer demand in the period Takt Time = 432000” = 16,62 seconds/unit 26000 un. Maximum, at every 16 seconds a piece must be ready, so that the customer’s order can be matched at the right time! Takt Time Calculation Example Principle 2 Takt Time
  • 23.
  • 24.
    LEAN FOR WORKAND LEAN FOR LIFE Train the trainer to teach Lean skills in VET

Editor's Notes

  • #5 A value chain is all activities (value added and / or no added value) needed to transform a product or service from raw material to the customer.
  • #13 The Teacher places brown paper on the Wall and tells students to develop the Process Mapping using post-its
  • #14 Process: information and material flow of a given process or work cell Factory: flow of information and material within the 4 walls of the factory
  • #17 Additional information that may (or may not) be used
  • #20 In this image it’s possible to verify the cycle and lead time. Definitions: Cycle Time definition: Cycle time is the time between consecutive parts (parts, units, or customers) that an operations system can produce or serve. It is defined by the slowest of the processes or steps. This process is often called bottleneck. This time is measured in unit time (eg [min / customer] or [sec / part]) and does not include non-productive times such as: malfunctions, defects, accidents or other. Due to the presence of process failures, it is common to find deviations between the planned cycle time (reference value or target cycle time) and the current cycle time. The relation between the two times can be understood as a measure of efficiency (E) of the process, that is:   E = target cycle time/actual cycle time * 100%   Cycle time does not have to be calculated, resulting from the bottleneck process or workstation (ie, from the slowest of steps). This time does not consider losses, since it is only determined when the process is in operation.     Takt Time definition: The takt time (Tt) (also a cycle time, but in this case defined by consumption), results from the following calculation: Tt = available time / search in this time [time / unit] Takt time considers losses and stops in processes. If in a given "available time period" (eg a shift or a week) the demand varies, then the takt time also varies. In contrast, the cycle time remains constant because it does not depend on the consumption (demand or customer) but on the slower of the operations. The higher the customer demand the smaller the takt time. In the situation in which the takt time is greater than the cycle time, results in wastage for the Organization due to the low resource utilization.
  • #21 Usually the focus is on reducing time in value added activities, achieving small results. When the focus is turned in to waste, the same % of improvement corresponds to a bigger slice of reduction.
  • #22 The Teacher can refer exemples that were achieved during the Ball Point Pen game.
  • #24 Takt Time definition: The takt time (Tt) (also a cycle time, but in this case defined by consumption), results from the following calculation: Tt = available time / search in this time [time / unit] Takt time considers losses and stops in processes. If in a given "available time period" (eg a shift or a week) the demand varies, then the takt time also varies. In contrast, the cycle time remains constant because it does not depend on the consumption (demand or customer) but on the slower of the operations. The higher the customer demand the smaller the takt time. In the situation in which the takt time is greater than the cycle time, results in wastage for the Organization due to the low resource utilization.
  • #27 This vídeo is only shown after the students have developed and presented the exercise