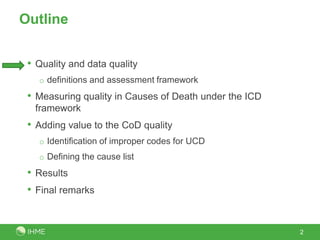
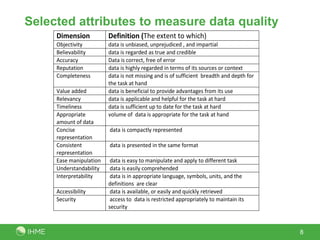
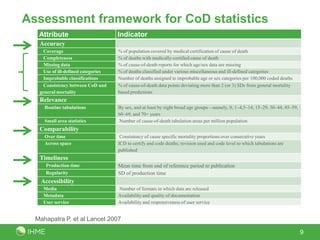
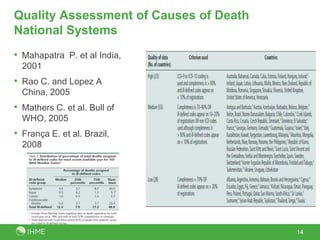
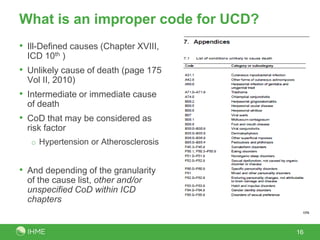
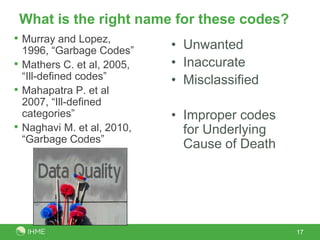
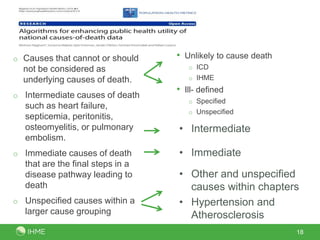
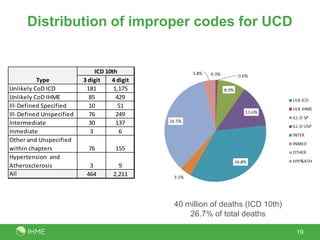
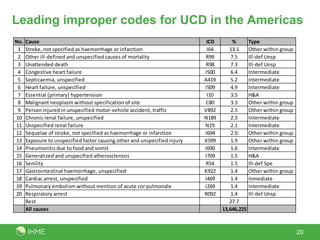
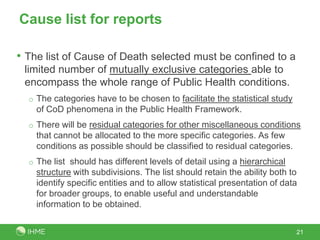
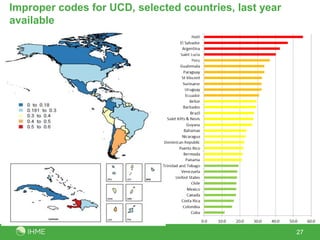
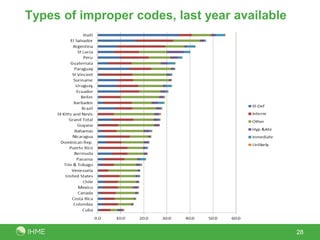
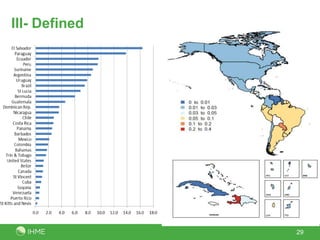
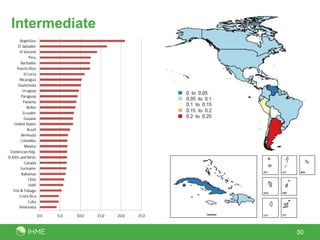
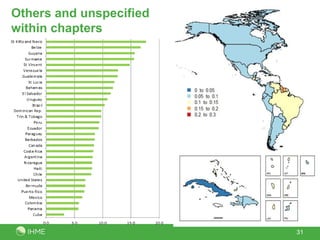
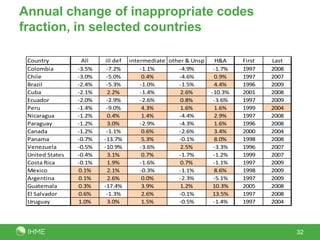
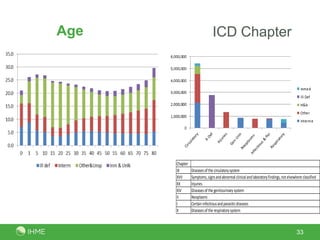
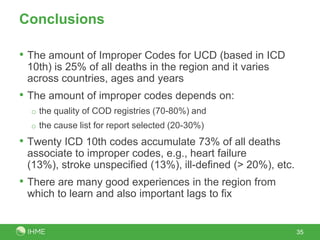
Quality Assessment of Mortality
Information
Causes of death


March 26, 2012


Rafael Lozano
Professor, IHME
Outline


 • Quality and data quality
   o definitions and assessment framework

 • Measuring quality in Causes of Death under the ICD
  framework
 • Adding value to the CoD quality
   o Identification of improper codes for UCD
   o Defining the cause list

 • Results
 • Final remarks


                                                        2
3
What is quality?

• Quality (from Latin qualitas) is an attribute or a property
    o Attributes are given, by a subject, whereas properties are owned
• For Locke, a quality is an idea of a sensation or a perception
    o primary qualities are intrinsic to an object
    o secondary qualities are dependent on the interpretation of the subjective
      mode and the context of appearance
• From the neutral point of view, the quality of something is
    the sum of its essential attributes or properties
•   Something might be good because it is
    o Useful                           Quality means the
    o Beautiful                        understanding of

    o Exists


                                                                                  4
What is data quality?
• It is difficult to determine the exact definition, but in our daily lives we
  have a pretty good sense of what is poor data quality
• Sometimes it is easier to identify inaccurate data – data that are not
  relevant, data that are not timely, data that are misleading, etc.


                                                                                 5
What do you mean by “data quality?”


 The majority of people consider accuracy the most relevant
 dimension of data quality. Completeness, currency, and
 consistency come next on the list. However, we need to
 understand better the multidimensional concept of data
 quality.


                                                          6
Approaches used in the literature to
study data quality
• An intuitive is based on the researchers´ experience trying to
 understand which attributes of data are important.


• A theoretical focuses on how data may become deficient
 during the data manufacturing process. Highly recommended
 but with few examples. Through this approach we can assess
 the intrinsic attributes to a data product.


• An empirical captures the attributes of data quality that are
 important for consumers. How data fit for use in their task.
 Capture the voice of customers and reveal characteristics that
 researchers have not considered.

                                                                   7
Selected attributes to measure data quality
     Dimension           Definition (The extent to which)
     Objectivity         data is unbiased, unprejudiced , and impartial
     Believability       data is regarded as true and credible
     Accuracy            Data is correct, free of error
     Reputation          data is highly regarded in terms of its sources or context
     Completeness        data is not missing and is of sufficient breadth and depth for
                         the task at hand
     Value added         data is beneficial to provide advantages from its use
     Relevancy           data is applicable and helpful for the task at hard
     Timeliness          data is sufficient up to date for the task at hard
     Appropriate         volume of data is appropriate for the task at hand
     amount of data
     Concise             data is compactly represented
     representation
     Consistent          data is presented in the same format
     representation
     Ease manipulation    data is easy to manipulate and apply to different task
     Understandability    data is easily comprehended
     Interpretability     data is in appropriate language, symbols, units, and the
                         definitions are clear
     Accessibility        data is available, or easily and quickly retrieved
     Security             access to data is restricted appropriately to maintain its
                         security


                                                                                          8
Assessment framework for CoD statistics
   Attribute                         Indicator
   Accuracy
     Coverage                        % of population covered by medical certification of cause of death
     Completeness                    % of deaths with medically-certified cause of death
     Missing data                    % of cause-of-death reports for which age/sex data are missing
     Use of ill-defined categories   % of deaths classified under various miscellaneous and ill-defined categories
     Improbable classifications      Number of deaths assigned to improbable age or sex categories per 100,000 coded deaths
     Consistency between CoD and     % of cause-of-death data points deviating more than 2 (or 3) SDs from general mortality
   general mortality                 based predictions
   Relevance
     Routine tabulations             By sex, and at least by eight broad age groups—namely, 0, 1–4,5–14, 15–29, 30–44, 45–59,
                                     60–69, and 70+ years
     Small area statistics           Number of cause-of-death tabulation areas per million population
   Comparability
     Over time                        Consistency of cause specific mortality proportions over consecutive years
     Across space                    ICD to certify and code deaths; revision used and code level to which tabulations are
                                     published
   Timeliness
     Production time                 Mean time from end of reference period to publication
     Regularity                      SD of production time
   Accessibility
    Media                            Number of formats in which data are released
    Metadata                         Availability and quality of documentation
    User service                     Availability and responsiveness of user service


  Mahapatra P. et al Lancet 2007

                                                                                                                                9
Outline


  • Quality and data quality
  • Measuring quality in Causes of Death under the ICD
   framework
  • Adding value to the CoD quality
    o Identification of improper codes for UCD
    o Defining the cause list


  • Results
  • Final remarks


                                                         10
11
Critical concepts


• One cause - one death (UCD)
  o General principle and selection rules
  o Modification of the selected cause
  o The modification rules

   –   Underlying cause of death (UCD)
   –   Intervening cause
   –   Highly improbable, unlikely to cause death
   –   Ill- defined (symptoms, signs and abnormal clinical
       and laboratory findings, not elsewhere classified)


                                                             12
4.1.11 Notes for use in underlying cause of
death mortality
• E86 Volume depletion with mention of A00-A09 (intestinal infectious
  diseases) code A00-A09


• What happen when E86 or I10 appear alone or
  the sequence turn into I10 as UCD…
 Source: ICD 10th Vol II, Second Edition 2010, pages 37 and 39
                                                                        13
Quality Assessment of Causes of Death
National Systems
• Mahapatra P. et al India,
  2001
• Rao C. and Lopez A
  China, 2005
• Mathers C. et al. Bull of
  WHO, 2005
• França E. et al. Brazil,
  2008


                                        14
Outline


 • Quality and data quality
 • Measuring quality in Causes of Death under the ICD
  framework
 • Adding value to the CoD quality
   o Identification of improper codes for UCD
   o Defining the cause list


 • Results
 • Final remarks


                                                        15
What is an improper code for UCD?
• Ill-Defined causes (Chapter XVIII,
  ICD 10th )
• Unlikely cause of death (page 175
  Vol II, 2010)
• Intermediate or immediate cause
  of death
• CoD that may be considered as
  risk factor
   o Hypertension or Atherosclerosis


• And depending of the granularity
  of the cause list, other and/or
  unspecified CoD within ICD
  chapters


                                       16
What is the right name for these codes?
• Murray and Lopez,
    1996, “Garbage Codes”     • Unwanted
•   Mathers C. et al, 2005,   • Inaccurate
    “Ill-defined codes”       • Misclassified
•   Mahapatra P. et al
    2007, “Ill-defined
    categories”               • Improper codes
•   Naghavi M. et al, 2010,     for Underlying
    “Garbage Codes”
                                Cause of Death


                                                 17
o Causes that cannot or should    • Unlikely to cause death
  not be considered as               o ICD

  underlying causes of death.        o IHME
                                  • Ill- defined
o Intermediate causes of death
                                     o Specified
  such as heart failure,
                                     o Unspecified
  septicemia, peritonitis,
  osteomyelitis, or pulmonary     • Intermediate
  embolism.
o Immediate causes of death       • Immediate
  that are the final steps in a
  disease pathway leading to      • Other and unspecified
  death                             causes within chapters
o Unspecified causes within a     • Hypertension and
  larger cause grouping             Atherosclerosis
                                                              18
Distribution of improper codes for UCD


                               ICD 10th
          Type            3 digit    4 digit
Unlikely CoD ICD           181        1,175
Unlikely CoD IHME           85         429
Ill-Defined Specified       10          51
Ill-Defined Unspecified     76         249
Intermediate                30         137
Inmediate                    3          6
Other and Unspecified
within chapters             76        155
Hypertension and
Atherosclerosis             3          9
All                        464       2,211


                                               40 million of deaths (ICD 10th)
                                                   26.7% of total deaths

                                                                                 19
Leading improper codes for UCD in the Americas
No.   Cause                                                                  ICD        %     Type
 1    Stroke, not specified as haemorrhage or infarction                     I64      13.1    Other within group
 2    Other ill-defined and unspecified causes of mortality                 R99        7.5    Ill-def Unsp
 3    Unattended death                                                      R98        7.3    Ill-def Unsp
 4    Congestive heart failure                                              I500       6.4    Intermediate
 5    Septicaemia, unspecified                                              A419       5.2    Intermediate
 6    Heart failure, unspecified                                            I509       4.9    Intermediate
 7    Essential (primary) hypertension                                       I10       3.5    H&A
 8    Malignant neoplasm without specification of site                      C80        3.3    Other within group
 9    Person injured in unspecified motor-vehicle accident, traffic         V892       2.5    Other within group
10    Chronic renal failure, unspecified                                    N189       2.3    Intermediate
11    Unspecified renal failure                                             N19        2.1    Intermediate
12    Sequelae of stroke, not specified as haemorrhage or infarction        I694       2.0    Other within group
13    Exposure to unspecified factor causing other and unspecified injury   X599       1.9    Other within group
14    Pneumonitis due to food and vomit                                     J690       1.6    Intermediate
15    Generalized and unspecified atherosclerosis                           I709       1.5    H&A
16    Senility                                                              R54        1.5    Ill-def Spe
17    Gastrointestinal haemorrhage, unspecified                             K922       1.4    Other within group
18    Cardiac arrest, unspecified                                           I469       1.4    Inmediate
19    Pulmonary embolism without mention of acute cor pulmonale             I269       1.4    Intermediate
20    Respiratory arrest                                                    R092       1.4    Ill-def Unsp
      Rest                                                                            27.7
      All causes                                                                   13,646,225


                                                                                                                   20
Cause list for reports

• The list of Cause of Death selected must be confined to a
 limited number of mutually exclusive categories able to
 encompass the whole range of Public Health conditions.
  o The categories have to be chosen to facilitate the statistical study
    of CoD phenomena in the Public Health Framework.
  o There will be residual categories for other miscellaneous conditions
    that cannot be allocated to the more specific categories. As few
    conditions as possible should be classified to residual categories.
  o The list should has different levels of detail using a hierarchical
    structure with subdivisions. The list should retain the ability both to
    identify specific entities and to allow statistical presentation of data
    for broader groups, to enable useful and understandable
    information to be obtained.


                                                                           21
Examples of short cause list for reports
                                                                     GBD 2010 Cause list
                                 Level              Group                    Group                    Group                        Total
•   Taucher E., 1978                                  I                        II                       III

•   Avoidable Mortality, 1990    First                     1                        1                        1                      3
                                 Second                    7                        8                        4                      19
•   BTL (ICD 9th), 1979
                                 Third                   50                       83                       14                      147
•   Tab 1 (ICD   10th),   1994   Fourth                  75                      128                       22                      225
•   PAHO 6/67, 2002
                                 A   Communicable, maternal, perinatal and nutritional Conditions
•   Becker R. et al 2006             A.1     HIV and tuberculosis
                                             A.1.1      Tuberculosis
                                             A.1.2      HIV/AIDS
•   GBD 1990                                            A.1.2.1 HIV disease resulting in mycobacterial infection
                                                        A.1.2.2 HIV disease resulting in other specified or unspecified diseases
                                     A.2     Infectious diseases predominantly in children
•   GBD 2010                                 A.2.1      Diarrheal diseases
                                                        A.2.1.1 Cholera
                                                        A.2.1.2 Other salmonella infections
                                                        A.2.1.3 Shigellosis
                                                        A.2.1.4 Enteropathogenic Escherichia coli infection
                                                        A.2.1.5 Enterotoxigenic Escherichia coli infection

• New one ??                                            A.2.1.6 Campylobacter enteritis
                                                        A.2.1.7 Amoebiasis
                                                        A.2.1.8 Cryptosporidiosis
                                                        A.2.1.9 Rotaviral enteritis
                                                        A.2.1.10 Other diarrheal disease

                                                                                                                                        22
I60-I69 Cerebrovascular diseases
• Ischemic stroke
   o I63 Cerebral infarction
   o I65 Occlusion and stenosis of pre-cerebral arteries, not resulting in cerebral infarction
   o I66 Occlusion and stenosis of cerebral arteries, not resulting in cerebral infarction
   o I67(except I67.4) Other cerebrovascular diseases (Hypertensive encephalopathy)
   o I69.3 Sequelae of cerebral infarction

• Hemorrhagic and other non-ischemic stroke
   o I60 Subarachnoid hemorrhage
   o I61 Intra-cerebral hemorrhage
   o I62 Other no traumatic intracranial hemorrhage
   o I69.0-I69.2 Sequelae of: subarachnoid hemorrhage, intra-cerebral hemorrhage, and other no
     traumatic intracranial hemorrhage
   o I67.4 Hypertensive encephalopathy

• Stroke not specified as hemorrhagic or Ischemic
   o I64 Stroke, not specified as hemorrhage or infarction
   o I69.4 Sequelae of stroke, not specified as hemorrhage or infarction
   o I69.8 Sequelae of other and unspecified cerebrovascular diseases


                                                                                                 23
Assumptions
• The proportion of deaths assigned to unspecified stroke is negatively
    associated with the proportion of deaths assigned to individual target
    codes.
• The epidemiological distribution of causes, as well as the nosological
    paradigms within the stroke universe, tend to be similar within given
    country.

        %Target = α+ β(% Unspecified Stroke) + Ζ(μ) + ε

Where:
•    %Target = proportion of deaths attributable to a given target code (either
     ischemic or hemorrhagic) within the stroke universe
•    % Unspecified Stroke = proportion of deaths attributable to a unspecified
     stroke within the Stroke universe
•    μ = a vector of normally-distributed random effects with mean Ε(μ)=0


                                                                                  24
New ways to group causes

              Hypertensive
                 Heart
               Diseases         Chronic               Diabetes
                                 Kidney
                                Diseases


                                  Nephropathies


CKD due to Diabetes: E10.2, E11.2, E12.2, E13.2, E14.2
CKD due to Hypertension: I12.0, I12.9, I13.0, I13.1, I13.2, I13.9
Other CKD: N02‐N07, N15.0
                                                                    25
Outline


 • Quality and data quality
 • Measuring quality in Causes of Death under the ICD
  framework
 • Adding value to the CoD quality
   o Identification of improper codes for UCD
   o Defining the cause list

 • Results
 • Final remarks


                                                        26
Improper codes for UCD, selected countries, last year
available


                                                        27
Types of improper codes, last year available


                                               28
Ill- Defined


               29
Intermediate


               30
Others and unspecified
within chapters


                         31
Annual change of inappropriate codes
fraction, in selected countries

 Country          All     ill def   intermediate other & Unsp     H&A    First   Last
 Colombia        -3.5%    -7.2%         -1.1%       -4.9%        -1.7%   1997    2008
 Chile           -3.0%    -5.0%          0.4%       -4.6%        0.9%    1997    2007
 Brazil          -2.4%    -5.3%         -1.0%       -1.5%        4.4%    1996    2009
 Cuba            -2.1%     2.2%         -1.4%        2.6%       -10.3%   2001    2008
 Ecuador         -2.0%    -2.9%         -2.6%        0.8%        -3.6%   1997    2009
 Peru            -1.4%    -9.0%          4.3%        1.6%        1.6%    1999    2004
 Nicaragua       -1.2%     0.4%          1.4%       -4.4%        2.9%    1997    2008
 Paraguay        -1.2%     3.0%         -2.9%       -4.3%        1.6%    1996    2008
 Canada          -1.2%    -1.1%          0.6%       -2.6%        3.4%    2000    2004
 Panama          -0.7%   -13.7%          5.3%       -0.1%        8.0%    1998    2008
 Venezuela       -0.5%   -10.9%         -3.6%        2.5%        -3.3%   1996    2007
 United States   -0.4%     3.1%          0.7%       -1.7%        -1.2%   1999    2007
 Costa Rica      -0.1%     1.9%         -1.6%        0.7%        -1.1%   1997    2009
 Mexico          0.1%      2.1%         -0.3%       -1.1%        8.6%    1998    2009
 Argentina       0.1%      2.6%          0.0%       -2.3%        -5.1%   1997    2009
 Guatemala       0.3%    -17.4%          3.9%        1.2%        10.3%   2005    2008
 El Salvador     0.6%     -1.3%          2.6%       -0.1%        13.5%   1997    2008
 Uruguay         1.0%      3.0%          1.5%       -0.5%        -1.4%   1997    2004


                                                                                        32
Age                           ICD Chapter


      Chapter
      IX        Diseases of the circulatory system
      XVII      Symptoms, signs and abnormal clinical and laboratory findings, not elsewhere classified
      XX        Injuries
      XIV       Diseases of the genitourinary system
      II        Neoplasms
      I         Certain infectious and parasitic diseases
      X         Diseases of the respiratory system


                                                                                         33
Outline


 • Quality and data quality
 • Measuring quality in Causes of Death under the ICD
  framework
 • Adding value to the CoD quality
   o Defining the cause list
   o Identification of improper codes for UCD

 • Results
 • Final remarks


                                                        34
Conclusions

• The amount of Improper Codes for UCD (based in ICD
 10th) is 25% of all deaths in the region and it varies
 across countries, ages and years
• The amount of improper codes depends on:
  o the quality of COD registries (70-80%) and
  o the cause list for report selected (20-30%)

• Twenty ICD 10th codes accumulate 73% of all deaths
 associate to improper codes, e.g., heart failure
 (13%), stroke unspecified (13%), ill-defined (> 20%), etc.
• There are many good experiences in the region from
 which to learn and also important lags to fix


                                                              35
What do we need to do on the data quality
front?
• Are we “ok” with the current
 indicators or do we need to
 expand the scope?
• Do we need a different cause
 list for reports?
• Shall we set up a common
 framework as users of data
 and producers of information?
 (new studies of validation of
 the accuracy of death
 certificates)
• Do we have to explore and
 learn more from our
 customers?

                                            36
To improve the quality … is not only raising the bar


The most achieved was 1.97 m   In 1968 (Mex), Richard Fosbury (USA)
                               revolutionized the technic and jumped 2.18 m


                                    The current global record is 2.45m
                                    and belongs to Javier Sotomayor
                                    (Cuba)


                                                                          37
THANKS


Acknowledgments to the Causes of Death Research Team, IHME.
Data Analysts: David Philips, Charles Atkinson, Diego Gonzalez-Medina
Researchers: Kyle Foreman MPH, Prof. Mohsen Naghavi, Prof. Christopher Murray


                                                                         38

Quality Assessment of Mortality Information

  • 1.
    Quality Assessment ofMortality Information Causes of death March 26, 2012 Rafael Lozano Professor, IHME
  • 2.
    Outline • Qualityand data quality o definitions and assessment framework • Measuring quality in Causes of Death under the ICD framework • Adding value to the CoD quality o Identification of improper codes for UCD o Defining the cause list • Results • Final remarks 2
  • 3.
  • 4.
    What is quality? •Quality (from Latin qualitas) is an attribute or a property o Attributes are given, by a subject, whereas properties are owned • For Locke, a quality is an idea of a sensation or a perception o primary qualities are intrinsic to an object o secondary qualities are dependent on the interpretation of the subjective mode and the context of appearance • From the neutral point of view, the quality of something is the sum of its essential attributes or properties • Something might be good because it is o Useful Quality means the o Beautiful understanding of o Exists 4
  • 5.
    What is dataquality? • It is difficult to determine the exact definition, but in our daily lives we have a pretty good sense of what is poor data quality • Sometimes it is easier to identify inaccurate data – data that are not relevant, data that are not timely, data that are misleading, etc. 5
  • 6.
    What do youmean by “data quality?” The majority of people consider accuracy the most relevant dimension of data quality. Completeness, currency, and consistency come next on the list. However, we need to understand better the multidimensional concept of data quality. 6
  • 7.
    Approaches used inthe literature to study data quality • An intuitive is based on the researchers´ experience trying to understand which attributes of data are important. • A theoretical focuses on how data may become deficient during the data manufacturing process. Highly recommended but with few examples. Through this approach we can assess the intrinsic attributes to a data product. • An empirical captures the attributes of data quality that are important for consumers. How data fit for use in their task. Capture the voice of customers and reveal characteristics that researchers have not considered. 7
  • 8.
    Selected attributes tomeasure data quality Dimension Definition (The extent to which) Objectivity data is unbiased, unprejudiced , and impartial Believability data is regarded as true and credible Accuracy Data is correct, free of error Reputation data is highly regarded in terms of its sources or context Completeness data is not missing and is of sufficient breadth and depth for the task at hand Value added data is beneficial to provide advantages from its use Relevancy data is applicable and helpful for the task at hard Timeliness data is sufficient up to date for the task at hard Appropriate volume of data is appropriate for the task at hand amount of data Concise data is compactly represented representation Consistent data is presented in the same format representation Ease manipulation data is easy to manipulate and apply to different task Understandability data is easily comprehended Interpretability data is in appropriate language, symbols, units, and the definitions are clear Accessibility data is available, or easily and quickly retrieved Security access to data is restricted appropriately to maintain its security 8
  • 9.
    Assessment framework forCoD statistics Attribute Indicator Accuracy Coverage % of population covered by medical certification of cause of death Completeness % of deaths with medically-certified cause of death Missing data % of cause-of-death reports for which age/sex data are missing Use of ill-defined categories % of deaths classified under various miscellaneous and ill-defined categories Improbable classifications Number of deaths assigned to improbable age or sex categories per 100,000 coded deaths Consistency between CoD and % of cause-of-death data points deviating more than 2 (or 3) SDs from general mortality general mortality based predictions Relevance Routine tabulations By sex, and at least by eight broad age groups—namely, 0, 1–4,5–14, 15–29, 30–44, 45–59, 60–69, and 70+ years Small area statistics Number of cause-of-death tabulation areas per million population Comparability Over time Consistency of cause specific mortality proportions over consecutive years Across space ICD to certify and code deaths; revision used and code level to which tabulations are published Timeliness Production time Mean time from end of reference period to publication Regularity SD of production time Accessibility Media Number of formats in which data are released Metadata Availability and quality of documentation User service Availability and responsiveness of user service Mahapatra P. et al Lancet 2007 9
  • 10.
    Outline •Quality and data quality • Measuring quality in Causes of Death under the ICD framework • Adding value to the CoD quality o Identification of improper codes for UCD o Defining the cause list • Results • Final remarks 10
  • 11.
  • 12.
    Critical concepts • Onecause - one death (UCD) o General principle and selection rules o Modification of the selected cause o The modification rules – Underlying cause of death (UCD) – Intervening cause – Highly improbable, unlikely to cause death – Ill- defined (symptoms, signs and abnormal clinical and laboratory findings, not elsewhere classified) 12
  • 13.
    4.1.11 Notes foruse in underlying cause of death mortality • E86 Volume depletion with mention of A00-A09 (intestinal infectious diseases) code A00-A09 • What happen when E86 or I10 appear alone or the sequence turn into I10 as UCD… Source: ICD 10th Vol II, Second Edition 2010, pages 37 and 39 13
  • 14.
    Quality Assessment ofCauses of Death National Systems • Mahapatra P. et al India, 2001 • Rao C. and Lopez A China, 2005 • Mathers C. et al. Bull of WHO, 2005 • França E. et al. Brazil, 2008 14
  • 15.
    Outline • Qualityand data quality • Measuring quality in Causes of Death under the ICD framework • Adding value to the CoD quality o Identification of improper codes for UCD o Defining the cause list • Results • Final remarks 15
  • 16.
    What is animproper code for UCD? • Ill-Defined causes (Chapter XVIII, ICD 10th ) • Unlikely cause of death (page 175 Vol II, 2010) • Intermediate or immediate cause of death • CoD that may be considered as risk factor o Hypertension or Atherosclerosis • And depending of the granularity of the cause list, other and/or unspecified CoD within ICD chapters 16
  • 17.
    What is theright name for these codes? • Murray and Lopez, 1996, “Garbage Codes” • Unwanted • Mathers C. et al, 2005, • Inaccurate “Ill-defined codes” • Misclassified • Mahapatra P. et al 2007, “Ill-defined categories” • Improper codes • Naghavi M. et al, 2010, for Underlying “Garbage Codes” Cause of Death 17
  • 18.
    o Causes thatcannot or should • Unlikely to cause death not be considered as o ICD underlying causes of death. o IHME • Ill- defined o Intermediate causes of death o Specified such as heart failure, o Unspecified septicemia, peritonitis, osteomyelitis, or pulmonary • Intermediate embolism. o Immediate causes of death • Immediate that are the final steps in a disease pathway leading to • Other and unspecified death causes within chapters o Unspecified causes within a • Hypertension and larger cause grouping Atherosclerosis 18
  • 19.
    Distribution of impropercodes for UCD ICD 10th Type 3 digit 4 digit Unlikely CoD ICD 181 1,175 Unlikely CoD IHME 85 429 Ill-Defined Specified 10 51 Ill-Defined Unspecified 76 249 Intermediate 30 137 Inmediate 3 6 Other and Unspecified within chapters 76 155 Hypertension and Atherosclerosis 3 9 All 464 2,211 40 million of deaths (ICD 10th) 26.7% of total deaths 19
  • 20.
    Leading improper codesfor UCD in the Americas No. Cause ICD % Type 1 Stroke, not specified as haemorrhage or infarction I64 13.1 Other within group 2 Other ill-defined and unspecified causes of mortality R99 7.5 Ill-def Unsp 3 Unattended death R98 7.3 Ill-def Unsp 4 Congestive heart failure I500 6.4 Intermediate 5 Septicaemia, unspecified A419 5.2 Intermediate 6 Heart failure, unspecified I509 4.9 Intermediate 7 Essential (primary) hypertension I10 3.5 H&A 8 Malignant neoplasm without specification of site C80 3.3 Other within group 9 Person injured in unspecified motor-vehicle accident, traffic V892 2.5 Other within group 10 Chronic renal failure, unspecified N189 2.3 Intermediate 11 Unspecified renal failure N19 2.1 Intermediate 12 Sequelae of stroke, not specified as haemorrhage or infarction I694 2.0 Other within group 13 Exposure to unspecified factor causing other and unspecified injury X599 1.9 Other within group 14 Pneumonitis due to food and vomit J690 1.6 Intermediate 15 Generalized and unspecified atherosclerosis I709 1.5 H&A 16 Senility R54 1.5 Ill-def Spe 17 Gastrointestinal haemorrhage, unspecified K922 1.4 Other within group 18 Cardiac arrest, unspecified I469 1.4 Inmediate 19 Pulmonary embolism without mention of acute cor pulmonale I269 1.4 Intermediate 20 Respiratory arrest R092 1.4 Ill-def Unsp Rest 27.7 All causes 13,646,225 20
  • 21.
    Cause list forreports • The list of Cause of Death selected must be confined to a limited number of mutually exclusive categories able to encompass the whole range of Public Health conditions. o The categories have to be chosen to facilitate the statistical study of CoD phenomena in the Public Health Framework. o There will be residual categories for other miscellaneous conditions that cannot be allocated to the more specific categories. As few conditions as possible should be classified to residual categories. o The list should has different levels of detail using a hierarchical structure with subdivisions. The list should retain the ability both to identify specific entities and to allow statistical presentation of data for broader groups, to enable useful and understandable information to be obtained. 21
  • 22.
    Examples of shortcause list for reports GBD 2010 Cause list Level Group Group Group Total • Taucher E., 1978 I II III • Avoidable Mortality, 1990 First 1 1 1 3 Second 7 8 4 19 • BTL (ICD 9th), 1979 Third 50 83 14 147 • Tab 1 (ICD 10th), 1994 Fourth 75 128 22 225 • PAHO 6/67, 2002 A Communicable, maternal, perinatal and nutritional Conditions • Becker R. et al 2006 A.1 HIV and tuberculosis A.1.1 Tuberculosis A.1.2 HIV/AIDS • GBD 1990 A.1.2.1 HIV disease resulting in mycobacterial infection A.1.2.2 HIV disease resulting in other specified or unspecified diseases A.2 Infectious diseases predominantly in children • GBD 2010 A.2.1 Diarrheal diseases A.2.1.1 Cholera A.2.1.2 Other salmonella infections A.2.1.3 Shigellosis A.2.1.4 Enteropathogenic Escherichia coli infection A.2.1.5 Enterotoxigenic Escherichia coli infection • New one ?? A.2.1.6 Campylobacter enteritis A.2.1.7 Amoebiasis A.2.1.8 Cryptosporidiosis A.2.1.9 Rotaviral enteritis A.2.1.10 Other diarrheal disease 22
  • 23.
    I60-I69 Cerebrovascular diseases •Ischemic stroke o I63 Cerebral infarction o I65 Occlusion and stenosis of pre-cerebral arteries, not resulting in cerebral infarction o I66 Occlusion and stenosis of cerebral arteries, not resulting in cerebral infarction o I67(except I67.4) Other cerebrovascular diseases (Hypertensive encephalopathy) o I69.3 Sequelae of cerebral infarction • Hemorrhagic and other non-ischemic stroke o I60 Subarachnoid hemorrhage o I61 Intra-cerebral hemorrhage o I62 Other no traumatic intracranial hemorrhage o I69.0-I69.2 Sequelae of: subarachnoid hemorrhage, intra-cerebral hemorrhage, and other no traumatic intracranial hemorrhage o I67.4 Hypertensive encephalopathy • Stroke not specified as hemorrhagic or Ischemic o I64 Stroke, not specified as hemorrhage or infarction o I69.4 Sequelae of stroke, not specified as hemorrhage or infarction o I69.8 Sequelae of other and unspecified cerebrovascular diseases 23
  • 24.
    Assumptions • The proportionof deaths assigned to unspecified stroke is negatively associated with the proportion of deaths assigned to individual target codes. • The epidemiological distribution of causes, as well as the nosological paradigms within the stroke universe, tend to be similar within given country. %Target = α+ β(% Unspecified Stroke) + Ζ(μ) + ε Where: • %Target = proportion of deaths attributable to a given target code (either ischemic or hemorrhagic) within the stroke universe • % Unspecified Stroke = proportion of deaths attributable to a unspecified stroke within the Stroke universe • μ = a vector of normally-distributed random effects with mean Ε(μ)=0 24
  • 25.
    New ways togroup causes Hypertensive Heart Diseases Chronic Diabetes Kidney Diseases Nephropathies CKD due to Diabetes: E10.2, E11.2, E12.2, E13.2, E14.2 CKD due to Hypertension: I12.0, I12.9, I13.0, I13.1, I13.2, I13.9 Other CKD: N02‐N07, N15.0 25
  • 26.
    Outline • Qualityand data quality • Measuring quality in Causes of Death under the ICD framework • Adding value to the CoD quality o Identification of improper codes for UCD o Defining the cause list • Results • Final remarks 26
  • 27.
    Improper codes forUCD, selected countries, last year available 27
  • 28.
    Types of impropercodes, last year available 28
  • 29.
  • 30.
  • 31.
  • 32.
    Annual change ofinappropriate codes fraction, in selected countries Country All ill def intermediate other & Unsp H&A First Last Colombia -3.5% -7.2% -1.1% -4.9% -1.7% 1997 2008 Chile -3.0% -5.0% 0.4% -4.6% 0.9% 1997 2007 Brazil -2.4% -5.3% -1.0% -1.5% 4.4% 1996 2009 Cuba -2.1% 2.2% -1.4% 2.6% -10.3% 2001 2008 Ecuador -2.0% -2.9% -2.6% 0.8% -3.6% 1997 2009 Peru -1.4% -9.0% 4.3% 1.6% 1.6% 1999 2004 Nicaragua -1.2% 0.4% 1.4% -4.4% 2.9% 1997 2008 Paraguay -1.2% 3.0% -2.9% -4.3% 1.6% 1996 2008 Canada -1.2% -1.1% 0.6% -2.6% 3.4% 2000 2004 Panama -0.7% -13.7% 5.3% -0.1% 8.0% 1998 2008 Venezuela -0.5% -10.9% -3.6% 2.5% -3.3% 1996 2007 United States -0.4% 3.1% 0.7% -1.7% -1.2% 1999 2007 Costa Rica -0.1% 1.9% -1.6% 0.7% -1.1% 1997 2009 Mexico 0.1% 2.1% -0.3% -1.1% 8.6% 1998 2009 Argentina 0.1% 2.6% 0.0% -2.3% -5.1% 1997 2009 Guatemala 0.3% -17.4% 3.9% 1.2% 10.3% 2005 2008 El Salvador 0.6% -1.3% 2.6% -0.1% 13.5% 1997 2008 Uruguay 1.0% 3.0% 1.5% -0.5% -1.4% 1997 2004 32
  • 33.
    Age ICD Chapter Chapter IX Diseases of the circulatory system XVII Symptoms, signs and abnormal clinical and laboratory findings, not elsewhere classified XX Injuries XIV Diseases of the genitourinary system II Neoplasms I Certain infectious and parasitic diseases X Diseases of the respiratory system 33
  • 34.
    Outline • Qualityand data quality • Measuring quality in Causes of Death under the ICD framework • Adding value to the CoD quality o Defining the cause list o Identification of improper codes for UCD • Results • Final remarks 34
  • 35.
    Conclusions • The amountof Improper Codes for UCD (based in ICD 10th) is 25% of all deaths in the region and it varies across countries, ages and years • The amount of improper codes depends on: o the quality of COD registries (70-80%) and o the cause list for report selected (20-30%) • Twenty ICD 10th codes accumulate 73% of all deaths associate to improper codes, e.g., heart failure (13%), stroke unspecified (13%), ill-defined (> 20%), etc. • There are many good experiences in the region from which to learn and also important lags to fix 35
  • 36.
    What do weneed to do on the data quality front? • Are we “ok” with the current indicators or do we need to expand the scope? • Do we need a different cause list for reports? • Shall we set up a common framework as users of data and producers of information? (new studies of validation of the accuracy of death certificates) • Do we have to explore and learn more from our customers? 36
  • 37.
    To improve thequality … is not only raising the bar The most achieved was 1.97 m In 1968 (Mex), Richard Fosbury (USA) revolutionized the technic and jumped 2.18 m The current global record is 2.45m and belongs to Javier Sotomayor (Cuba) 37
  • 38.
    THANKS Acknowledgments to theCauses of Death Research Team, IHME. Data Analysts: David Philips, Charles Atkinson, Diego Gonzalez-Medina Researchers: Kyle Foreman MPH, Prof. Mohsen Naghavi, Prof. Christopher Murray 38

Editor's Notes

  • #5 Some philosophers assert that a quality cannot be defined.In contemporary philosophy, the idea of qualities and especially how to distinguish certain kinds of qualities from one another remains controversial