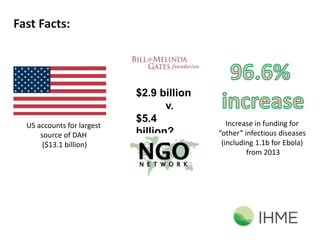
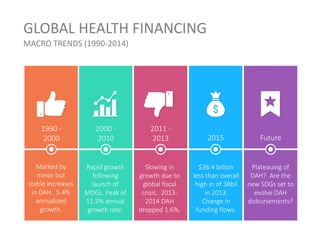
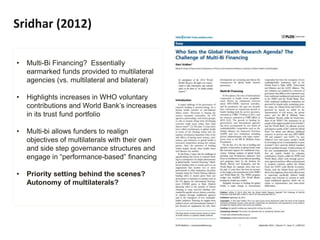
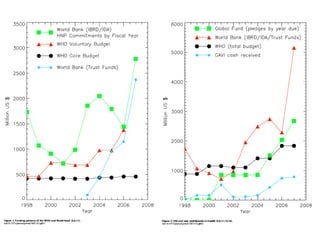
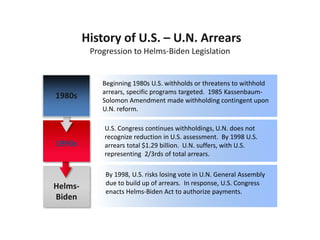
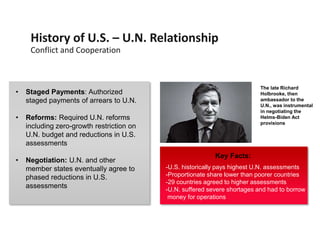
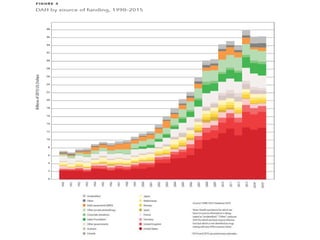
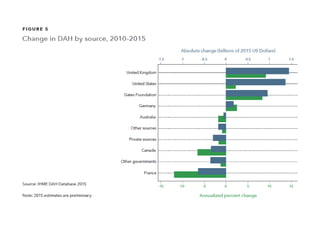
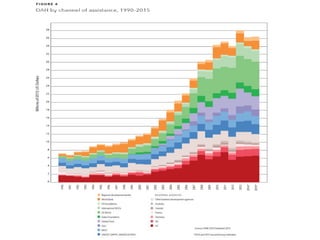
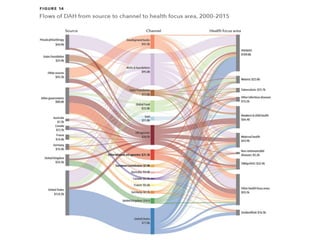
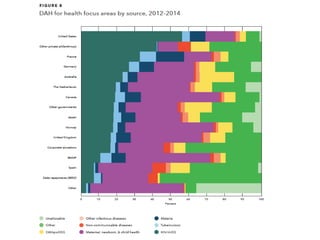
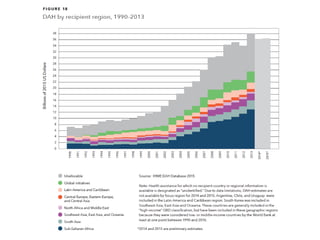
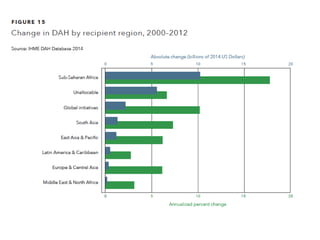
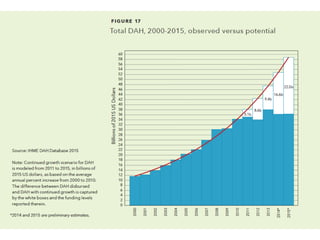
Global Health Financing
“Follow the money” in order to better understand the
framework for global health governance
Timothy K. Mackey, MAS, PhD
Fundamentals of Global Health
Summer 2016
$35.9
billion
Fast Facts:
US accounts for largest
source of DAH
($13.1 billion)
$2.9 billion
v.
$5.4
billion?
Increase in funding for
“other” infectious diseases
(including 1.1b for Ebola)
from 2013
GLOBAL HEALTH FINANCING
MACRO TRENDS (1990-2014)
1990 -
2000
2000 -
2010
2011 -
2013 2015 Future
Marked by
minor but
stable increases
in DAH. 5.4%
annualized
growth.
Rapid growth
following
launch of
MDGs. Peak of
11.3% annual
growth rate.
Slowing in
growth due to
global fiscal
crisis. 2013-
2014 DAH
dropped 1.6%.
$36.4 billion
less than overall
high in of 38bil
in 2013.
Change in
funding flows.
Plateauing of
DAH? Are the
new SDGs set to
evolve DAH
disbursements?
McCoy et al. (2009)
• Older article from 2009; most analysis on
DAC OECD donors
• Data sources comprised of secondary
data from published literature; annual
reports of actors; and unpublished data
(grants etc.)
• Maps and differentiates the source,
management, and spending of global
health funds
• Fragmentation of funding, complicated
and inadequately tracked
• Proliferation of actors with impact not
well known
Funding Instruments
Funding Instruments
Szlezak et al. (2010)
• PLoS Med, Harvard, funded,
commissioned as part of 4 series on
Global Health financing
• (1) essential characteristics of functioning
national health system; (2) case study of
Malaria and changes in partnerships,
research, and delivery; (3) further
research on 3 primary questions of
project.
• Improvement of coordination necessary to
avoid waste, inefficiency and turf wars
• Sustainable financing and equitable
resource sharing
• Ensuring sufficient long-term investment
and creating mechanisms for M&E
• Role and effectiveness?
Funding Instruments - IHME
“SOURCE”
“CHANNEL”
“RECIPIENT”
Sridhar (2012)
• Multi-Bi Financing? Essentially
earmarked funds provided to multilateral
agencies (vs. multilateral and bilateral)
• Highlights increases in WHO voluntary
contributions and World Bank’s increases
in its trust fund portfolio
• Multi-bi allows funders to realign
objectives of multilaterals with their own
and side step governance structures and
engage in “performance-based” financing
• Priority setting behind the scenes?
Autonomy of multilaterals?
Beginning 1980s U.S. withholds or threatens to withhold
arrears, specific programs targeted. 1985 Kassenbaum-
Solomon Amendment made withholding contingent upon
U.N. reform.
U.S. Congress continues withholdings, U.N. does not
recognize reduction in U.S. assessment. By 1998 U.S.
arrears total $1.29 billion. U.N. suffers, with U.S.
representing 2/3rds of total arrears.
By 1998, U.S. risks losing vote in U.N. General Assembly
due to build up of arrears. In response, U.S. Congress
enacts Helms-Biden Act to authorize payments.
Progression to Helms-Biden Legislation
History of U.S. – U.N. Arrears
1990s
1980s
Helms-
Biden
Conflict and Cooperation
History of U.S. – U.N. Relationship
• Staged Payments: Authorized
staged payments of arrears to U.N.
• Reforms: Required U.N. reforms
including zero-growth restriction on
U.N. budget and reductions in U.S.
assessments
• Negotiation: U.N. and other
member states eventually agree to
phased reductions in U.S.
assessments
The late Richard
Holbrooke, then
ambassador to the
U.N., was instrumental
in negotiating the
Helms-Biden Act
provisions
Key Facts:
-U.S. historically pays highest U.N. assessments
-Proportionate share lower than poorer countries
-29 countries agreed to higher assessments
-U.N. suffered severe shortages and had to borrow
money for operations
0.000
100.000
200.000
300.000
400.000
500.000
600.000
700.000
2001 2002 2003 2004 2005 2006 2007 2008 2009 2010*
Inmillionsof$US
U.S. Contributions to U.N. and U.N. Specialized Agencies
(FY2001-2010)
World Health Organization
United Nations
World Intellectual Property Organization
International Labor Organization
International Atomic Energy Agency
Food and Agriculture Organization
0.000
20.000
40.000
60.000
80.000
100.000
120.000
2001 2002 2003 2004 2005 2006 2007 2008 2009 2010*
Inmillionsof$US
U.S. Contributions to U.N. Specialized Agencies (FY2001-2010)
World Health Organization
World Intellectual Property Organization
International Labor Organization
International Atomic Energy Agency
Food and Agriculture Organization
World Health
Organization
NEXT:
In-class workshop: Global Health
Financing?
In-class Workshop (if time permits): Groups of 4
1) Pick a Global Health Actor: Pick a global health actor to explore.
It can be a country, a multilateral, a bilateral agency, an
NGO/private foundation, or a private sector actor.
2) Identify Key Characteristics: Search the internet to identify the
following key characteristics:
a) Type of actor: What type of actor is this (state government, UN agency,
bilateral, public-private partnership etc.)?
b) What type of instrument is it? : Is it a source, channel, recipient, or some
combination thereof?
c) Organization budget: Google search to try to find out what the
organization’s overall budget is. If information is available, check to see
what it is generally spent on (diseases, health projects, etc.)
3) Student Presentation: Report findings and tell us in general how
influential you think this organization is in the context of the entire
global health system.

Global Health Financing

  • 1.
    Global Health Financing “Followthe money” in order to better understand the framework for global health governance Timothy K. Mackey, MAS, PhD Fundamentals of Global Health Summer 2016
  • 2.
  • 3.
    Fast Facts: US accountsfor largest source of DAH ($13.1 billion) $2.9 billion v. $5.4 billion? Increase in funding for “other” infectious diseases (including 1.1b for Ebola) from 2013
  • 4.
    GLOBAL HEALTH FINANCING MACROTRENDS (1990-2014) 1990 - 2000 2000 - 2010 2011 - 2013 2015 Future Marked by minor but stable increases in DAH. 5.4% annualized growth. Rapid growth following launch of MDGs. Peak of 11.3% annual growth rate. Slowing in growth due to global fiscal crisis. 2013- 2014 DAH dropped 1.6%. $36.4 billion less than overall high in of 38bil in 2013. Change in funding flows. Plateauing of DAH? Are the new SDGs set to evolve DAH disbursements?
  • 8.
    McCoy et al.(2009) • Older article from 2009; most analysis on DAC OECD donors • Data sources comprised of secondary data from published literature; annual reports of actors; and unpublished data (grants etc.) • Maps and differentiates the source, management, and spending of global health funds • Fragmentation of funding, complicated and inadequately tracked • Proliferation of actors with impact not well known
  • 9.
  • 10.
  • 13.
    Szlezak et al.(2010) • PLoS Med, Harvard, funded, commissioned as part of 4 series on Global Health financing • (1) essential characteristics of functioning national health system; (2) case study of Malaria and changes in partnerships, research, and delivery; (3) further research on 3 primary questions of project. • Improvement of coordination necessary to avoid waste, inefficiency and turf wars • Sustainable financing and equitable resource sharing • Ensuring sufficient long-term investment and creating mechanisms for M&E • Role and effectiveness?
  • 15.
    Funding Instruments -IHME “SOURCE” “CHANNEL” “RECIPIENT”
  • 16.
    Sridhar (2012) • Multi-BiFinancing? Essentially earmarked funds provided to multilateral agencies (vs. multilateral and bilateral) • Highlights increases in WHO voluntary contributions and World Bank’s increases in its trust fund portfolio • Multi-bi allows funders to realign objectives of multilaterals with their own and side step governance structures and engage in “performance-based” financing • Priority setting behind the scenes? Autonomy of multilaterals?
  • 18.
    Beginning 1980s U.S.withholds or threatens to withhold arrears, specific programs targeted. 1985 Kassenbaum- Solomon Amendment made withholding contingent upon U.N. reform. U.S. Congress continues withholdings, U.N. does not recognize reduction in U.S. assessment. By 1998 U.S. arrears total $1.29 billion. U.N. suffers, with U.S. representing 2/3rds of total arrears. By 1998, U.S. risks losing vote in U.N. General Assembly due to build up of arrears. In response, U.S. Congress enacts Helms-Biden Act to authorize payments. Progression to Helms-Biden Legislation History of U.S. – U.N. Arrears 1990s 1980s Helms- Biden
  • 19.
    Conflict and Cooperation Historyof U.S. – U.N. Relationship • Staged Payments: Authorized staged payments of arrears to U.N. • Reforms: Required U.N. reforms including zero-growth restriction on U.N. budget and reductions in U.S. assessments • Negotiation: U.N. and other member states eventually agree to phased reductions in U.S. assessments The late Richard Holbrooke, then ambassador to the U.N., was instrumental in negotiating the Helms-Biden Act provisions Key Facts: -U.S. historically pays highest U.N. assessments -Proportionate share lower than poorer countries -29 countries agreed to higher assessments -U.N. suffered severe shortages and had to borrow money for operations
  • 21.
    0.000 100.000 200.000 300.000 400.000 500.000 600.000 700.000 2001 2002 20032004 2005 2006 2007 2008 2009 2010* Inmillionsof$US U.S. Contributions to U.N. and U.N. Specialized Agencies (FY2001-2010) World Health Organization United Nations World Intellectual Property Organization International Labor Organization International Atomic Energy Agency Food and Agriculture Organization
  • 22.
    0.000 20.000 40.000 60.000 80.000 100.000 120.000 2001 2002 20032004 2005 2006 2007 2008 2009 2010* Inmillionsof$US U.S. Contributions to U.N. Specialized Agencies (FY2001-2010) World Health Organization World Intellectual Property Organization International Labor Organization International Atomic Energy Agency Food and Agriculture Organization
  • 43.
  • 44.
  • 45.
    In-class Workshop (iftime permits): Groups of 4 1) Pick a Global Health Actor: Pick a global health actor to explore. It can be a country, a multilateral, a bilateral agency, an NGO/private foundation, or a private sector actor. 2) Identify Key Characteristics: Search the internet to identify the following key characteristics: a) Type of actor: What type of actor is this (state government, UN agency, bilateral, public-private partnership etc.)? b) What type of instrument is it? : Is it a source, channel, recipient, or some combination thereof? c) Organization budget: Google search to try to find out what the organization’s overall budget is. If information is available, check to see what it is generally spent on (diseases, health projects, etc.) 3) Student Presentation: Report findings and tell us in general how influential you think this organization is in the context of the entire global health system.

Editor's Notes

  • #3 79 countries in the world that have less than 35billion in GDP (World Bank) $400 billion overbudget for F-35 JSF for 2457 planes Total global health spending less than 1% of what countries use to maintain and improve their own health domestically.
  • #5 10% decrease in DAH disbursed by collection of UN Agencies.
  • #33 The disability-adjusted life year (DALY) is a measure of overall disease burden, expressed as the number of years lost due to ill-health, disability or early death. One DALY can be thought of as one lost year of "healthy" life. The sum of these DALYs across the population, or the burden of disease, can be thought of as a measurement of the gap between current health status and an ideal health situation where the entire population lives to an advanced age, free of disease and disability. The overall burden of disease is assessed using the disability-adjusted life year (DALY), a time-based measure that combines years of life lost due to premature mortality (YLLs) and years of life lost due to time lived in states of less than full health, or years of healthy life lost due to disability (YLDs). WHO has adopted the simpler form of DALY used in the GBD 2010 study. Age-weighting and time discounting are dropped, and the YLDs are calculated from prevalence estimates rather than incidence estimates. The WHO DALY estimates also incorporate some revisions to disability weights and epidemiological estimates, as well as a new WHO standard life table for calculation of YLLs. For results of IHME GBD 2010 study, please visit the IHME website. In some areas, the results of the GBD differ substantially from analyses done by WHO and other UN agencies. In many other areas, the GBD results update and are broadly similar to previous WHO analyses.