SlideShare a Scribd company logo
1 of 17
World Health Organization
                                     Organisation Mondiale de la Santé
                                               Department of                                                                 NOTES FOR TABLES
                                      Measurement and Health Information
                                                  December 2004


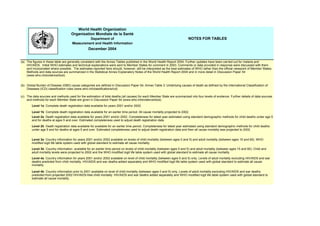
(a) The figures in these table are generally consistent with the Annex Tables published in the World Health Report 2004. Further updates have been carried out for malaria and
    HIV/AIDS. Initial WHO estimates and technical explanations were sent to Member States for comment in 2003. Comments or data provided in response were discussed with them
    and incorporated where possible. The estimates reported here should, however, still be interpreted as the best estimates of WHO rather than the official viewpoint of Member States.
    Methods and data sources are summarized in the Statistical Annex Explanatory Notes of the World Health Report 2004 and in more detail in Discussion Paper 54
    (www.who.int/evidence/bod)


(b) Global Burden of Disease (GBD) cause categories are defined in Discussion Paper 54, Annex Table 3. Underlying causes of death as defined by the International Classification of
    Diseases (ICD) classification rules (www.who.int/classifications/icd)

(c) The data sources and methods used for the estimation of total deaths (all causes) for each Member State are summarized into four levels of evidence. Further details of data sources
    and methods for each Member State are given in Discussion Paper 54 (www.who.int/evidence/bod).
        Level 1a Complete death registration data available for years 2001 and/or 2002.

        Level 1b Complete death registration data available for an earlier time period. All cause mortality projected to 2002.
        Level 2a Death registration data available for years 2001 and/or 2002. Completeness for latest year estimated using standard demographic methods for child deaths under age 5
        and for deaths at ages 5 and over. Estimated completeness used to adjust death registration data.
        Level 2b Death registration data available for available for an earlier time period. Completeness for latest year estimated using standard demographic methods for child deaths
        under age 5 and for deaths at ages 5 and over. Estimated completeness used to adjust death registration data and then all cause mortality was projected to 2002.


        Level 3a Country information for years 2001 and/or 2002 available on levels of child mortality (between ages 0 and 5) and adult mortality (between ages 15 and 60). WHO
        modified logit life table system used with global standard to estimate all cause mortality.
        Level 3b Country information available for an earlier time period on levels of child mortality (between ages 0 and 5) and adult mortality (between ages 15 and 60). Child and
        adult mortality levels were projected to 2002 and the WHO modified logit life table system used with global standard to estimate all cause mortality.
        Level 4a Country information for years 2001 and/or 2002 available on level of child mortality (between ages 0 and 5) only. Levels of adult mortality excluding HIV/AIDS and war
        deaths predicted from child mortality. HIV/AIDS and war deaths added separately and WHO modified logit life table system used with global standard to estimate all cause
        mortality.

        Level 4b Country information prior to 2001 available on level of child mortality (between ages 0 and 5) only. Levels of adult mortality excluding HIV/AIDS and war deaths
        predicted from projected 2002 HIV/AIDS-free child mortality. HIV/AIDS and war deaths added separately and WHO modified logit life table system used with global standard to
        estimate all cause mortality.
(d) The data sources and methods used for the estimation of deaths by cause for each Member State are summarized into four levels of evidence. Additional information for estimating
    country-level deaths due to certain specific causes were obtained from studies, WHO technical Programmes and UNAids for the following conditions: AIDS, tuberculosis, measles,
    pertussis, poliomyelitis, tetanus, acute lower respiratory infections, Chagas, maternal conditions, perinatal conditions, cancers, drug use disorders, rhumathoid arthritis and war.
    Further details of data sources and methods for each Member State are given in Discussion Paper 54 (www.who.int/evidence/bod).

         Level 1a Complete death registration data with cause of death coded using ICD-9 or ICD-10 available for years 2001 and/or 2002. Less than 10% of deaths coded to ICD codes
         for “symptoms, signs, and ill-defined conditions”, injuries where the intent is not determined; cardiovascular "garbage" codes, and cancer deaths coded to categories for
         secondary or unspecified sites.

         Level 1b Complete death registration data available . Complete death registration data with cause of death coded using ICD-9 or ICD-10 available for for an earlier time period.
         Less than 10% of deaths coded to ICD codes for “symptoms, signs, and ill-defined conditions”, injuries where the intent is not determined; and cardiovascular and cancer
         "garbage" codes.

         Level 2a Death registration data available for years 2001 and/or 2002. Adjustments to cause of death distribution required for incomplete registration and/or for use of non-ICD-9
         or ICD-10 coding and/or for the more than 10% of deaths coded to ill-defined conditions, and cardiovascular, cancer and injury "garbage" codes.
         Level 2b Death registration data available for latest year earlier than 2001. Adjustments to cause of death distribution required for incomplete registration and/or for use of non-
         ICD-9 or ICD-10 coding and/or for the more than 10% of deaths coded to ill-defined conditions, and cardiovascula, cancer and injury "garbage" codes.
         Level 3 Country information on causes of death available based on verbal autopsy methods.

         Level 4. Country information on causes of death not available for most causes. Cause of death modelling used to estimate broad distribution of causes of death for Groups I, II
         and III by age and sex for the country level of all cause mortality and per capita income. Cause of death patterns within the three major cause groups based on death registration
         data from other countries in the region. Further country-level information and data on specific causes listed above was also used.

(e) UN estimates of de-facto population (2002 Revision). Estimated death rates by age, sex for underlying causes of death as defined by the ICD classification rules, are applied to the
    UN estimates of de-facto resident population for 2002 to give numbers of expected deaths by cause for each Member State.

(f)   Estimated 95% uncertainty ranges for the expected number of total deaths for 2002. Uncertainty in population estimates is not included and the uncertainty ranges relate to underlying
      death rates estimated in the life table for each Member State not to the realized numbers of deaths actually occurring in 2002. Methods for estimating life table uncertainty are
      summarized in the Statistical Annex Explanatory Notes of the World Health Report 2004 and in more detail in Discussion Paper 10 (www.who.int/evidence). In countries with a
      substantial HIV epidemic or a war, estimates of the level and uncertainty range of the magnitude of the HIV epidemic or of war deaths were incorporated into the life table uncertainty
      analysis.

(g) Does not include liver cancer and cirrhosis deaths or DALYs resulting from chronic hepatitis virus infection.
(h) This cause category includes 'Causes arising in the perinatal period' as defined in the International Classification of Diseases, principally low birthweight, prematurity, birth asphyxia
    and birth trauma, and does not include all causes occurring in the perinatal period.

(i)   Standard DALYs with age-weighting and time discounting as reported in World Health Report 2004 (see second box below).
(j)   The data sources and methods used for the estimation of the YLL (premature mortality) component of DALYs are summarized as described in notes (c) and (d). YLD estimates by
      cause for Member States are based on the GBD analyses of incidence, prevalence, duration and severity of conditions for the relevant epidemiological subregion, together with
      country-level and subregional mortality differentials, and other national and subnational level information available to WHO. Two levels of evidence are distinguished as listed below.
      Further details of data sources and methods for each Member State are given in Discussion Paper 54 (www.who.int/evidence/bod).


         Level 3 Country data on causes of death (Levels 1 to 3) used to adjust regional YLD distributions for causes with significant case fatality. Partial country-specific information on
         incidence or prevalence of non-fatal causes available.
Level 4. Level 4 information on causes of death and regional estimates of YLD used for most causes. Partial country-specific information on incidence or prevalence of some
         non-fatal causes available.
(j)   Cause-specific death rates were age-standardized to the WHO global standard population (see Discussion Paper 31, www.who.int/evidence). Age-standardized death rates are
      calculated by applying age-specific death rates for the Member State to a global standard population. Comparison of cause-specific mortality risks across countries is facilitated by the
      use of age-standardized death rates to adjust for differences in population age distributions.


MORTALITY AND BURDEN OF DISEASE ESTIMATES FOR WHO MEMBER STATES IN 2002

      This workbook contains WHO estimates of mortality and burden of disease for WHO Member States for the year 2002. These estimates are based on version 3 of the Global Burden
      of Disease (GBD) study (1) as published in the World Health Report 2004 (2), with some additional adjustments for later revisions in HIV/AIDS mortality and burden (3) and draft
      revisions for malaria, schistosomiasis and intestinal helminth infections. Mortality estimates are based on analysis of latest available national information on levels of mortality and
      cause distributions as at late 2003. YLD estimates are based on the GBD analyses of incidence, prevalence, duration and severity of conditions for the relevant epidemiological
      subregion, together with national and subnational level information available to WHO (1). The GBD uses the latest population estimates for WHO Member States prepared by the UN
      Population Division (4).

      These summary tables represent the best estimates of WHO, based on the evidence available to it in mid-2004, rather than the official estimates of Member States. They have been
      computed using standard categories and methods to ensure cross-national comparability and may not be the same as official national estimateis produced using alternate, potentially
      equally rigorous methods. Data and methods used for estimating mortality and burden of disease for WHO Member states, and for quantifying uncertainty, are also summarized in a
      Working Paper (5).

      The work leading to these prior estimates of national burden of disease was undertaken by the WHO Evidence and Information for Policy cluster in collaboration with WHO technical
      programmes and with scientists worldwide. Documentation and GBD 2000 summary tables are available on the WHO website (http://www.who.int/evidence/bod), together with
      software tools and a National Burden of Disease Manual providing guidelines for conducting an NBD study (6).


      References
      1. Mathers CD, Bernard C, Iburg K, Inoue M, Ma Fat D, Shibuya K, Stein C, Tomijima, N (2003). The Global Burden of Disease in 2002: data sources, methods and results. Geneva,
      World Health Organization (GPE Discussion Paper No. 54). Available at http://www.who.int/evidence
      2. World Health Organization. World Health Report 2004: changing history. Available at http://www.who.int/whr
      3. UNAIDS. 2004 report on the global AIDS epidemic. 4th global report. Geneva: UNAIDS, 2004. Available at http://www.unaids.org
      4. United Nations Population Division. World Population Prospects - the 2002 revision. New York: United Nations, 2003.
      5. Mathers CD (2005). Uncertainty and data availability for the global burden of disease estimates 2000-2002. Evidence and Information for Policy Working Paper. Geneva, World
      Health Organization. Available at http://www.who.int/evidence/bod
      6. Mathers CD, Vos T, Lopez AD, Ezzati M. National Burden of Disease Studies: A Practical Guide. Edition 1.1. 2001. Geneva, World Health Organization, Global Program on
      Evidence for Health Policy. Available at http://www.who.int/evidence/nbd


DISABILITY ADJUSTED LIFE YEARS

      The Disability Adjusted Life Year or DALY is a health gap measure that extends the concept of potential years of life lost due to premature death (PYLL) to include equivalent years of
      ‘healthy’ life lost by virtue of being in states of poor health or disability (1). The DALY combines in one measure the time lived with disability and the time lost due to premature
      mortality. One DALY can be thought of as one lost year of ‘healthy’ life and the burden of disease as a measurement of the gap between current health status and an ideal situation
      where everyone lives into old age free of disease and disability.
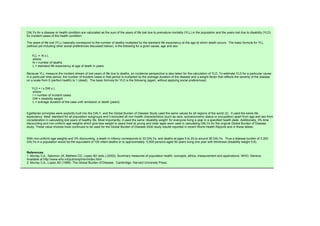
DALYs for a disease or health condition are calculated as the sum of the years of life lost due to premature mortality (YLL) in the population and the years lost due to disability (YLD)
for incident cases of the health condition:

The years of life lost (YLL) basically correspond to the number of deaths multiplied by the standard life expectancy at the age at which death occurs. The basic formula for YLL
(without yet including other social preferences discussed below), is the following for a given cause, age and sex:


   YLL = N x L
   where:
   N = number of deaths
   L = standard life expectancy at age of death in years

Because YLL measure the incident stream of lost years of life due to deaths, an incidence perspective is also taken for the calculation of YLD. To estimate YLD for a particular cause
in a particular time period, the number of incident cases in that period is multiplied by the average duration of the disease and a weight factor that reflects the severity of the disease
on a scale from 0 (perfect health) to 1 (dead). The basic formula for YLD is the following (again, without applying social preferences):

   YLD = I x DW x L
   where:
   I = number of incident cases
   DW = disability weight
   L = average duration of the case until remission or death (years)


Egalitarian principles were explicitly built into the DALY, and the Global Burden of Disease Study used the same values for all regions of the world (2) . It used the same life
expectancy ‘ideal’ standard for all population subgroups and it excluded all non-health characteristics (such as race, socioeconomic status or occupation) apart from age and sex from
consideration in calculating lost years of healthy life. Most importantly, it used the same ‘disability weight’ for everyone living a year in a specified health state. Additionally, 3% time
discounting and non-uniform age weights which give less weight to years lived at young and older ages were used in calculating DALYs for the original Global Burden of Disease
study. These value choices have continued to be used for the Global Burden of Disease 2000 study results reported in recent World Health Reports and in these tables.


With non-uniform age weights and 3% discounting, a death in infancy corresponds to 33 DALYs, and deaths at ages 5 to 20 to around 36 DALYs. Thus a disease burden of 3,300
DALYs in a population would be the equivalent of 100 infant deaths or to approximately 5,500 persons aged 50 years living one year with blindness (disability weight 0.6).


References
1. Murray CJL, Salomon JA, Mathers CD, Lopez AD (eds.) (2002). Summary measures of population health: concepts, ethics, measurement and applications. WHO, Geneva.
Available at http://www.who.int/pub/smph/en/index.html
2. Murray CJL, Lopez AD (1996). The Global Burden of Disease. Cambridge: Harvard University Press.
World Health Organization
                                             Organisation Mondiale de la Santé
                                                       Department of                                              COLOUR CODES FOR LEVELS OF EVIDENCE
                                              Measurement and Health Information
                                                          December 2004


Columns containing estimates of deaths or DALYs for WHO Member States in 2002 are colour-coded in the following sheets to summarize the levels of evidence and uncertainty. Four levels
of evidence for all cause mortality, cause-specific mortality, and DALYs are defined in the Notes sheet. Three colour codes are used to denote the following levels:


                Total          Causes of
                mortality      death      YLD
                Level 1        Level 1    Level 3      Death registration data, complete or incomplete, containing useable information on causes of death is available for the country, and
                or Level 2     or Level 2              used to adjust regional YLD distributions for causes with significant case fatality. Partial country-specific information on incidence or
                                                       prevalence of non-fatal causes available.


                Total mortality or causes of death     Other forms of information on child and adult mortality or causes of death (eg. verbal autopsy) available. Country-specific information on
                have level 3 evidence, neither is      mortality for specific causes available.Partial country-specific information on incidence or prevalence of non-fatal causes available.
                level 4.


                Level 4 OR Level 4         Level 4     Country information on level of adult mortality not available and it was predicted from child mortality level OR cause of death information
                                                       for most causes not available, and cause pattern predicted using cause-of-death models. Partial country-specific information on
                                                       incidence or prevalence of non-fatal causes available.


   Note that levels of evidence will vary for specific causes within a country, and the above colour coded scheme does not attempt to provide that level of detail for most causes. For
   tuberculosis, HIV/AIDS, CHagas disease and maternal mortality, specific colour codes have been used to provide an indication of when country-level data were used for those causes, for
   countries where the general level of evidence is level 4 (pink).

   Estimated 95% uncertainty ranges for the expected number of total deaths for 2002 are given for each country in the 'Deaths 2002' sheet and provide some indication of the level of
   uncertainty for estimates in that country. Cause-specific estimates will generally have even greater relative uncertainty ranges, as will DALY estimates, with the possible exception of some
   causes such as HIV/AIDS where separate country-specific analyses have been used. For more details on data source, methods and uncertainty refer to the GBD working papers
   referenced below.


   References
   1. Mathers CD, Bernard C, Iburg K, Inoue M, Ma Fat D, Shibuya K, Stein C, Tomijima, N (2003). The Global Burden of Disease in 2002: data sources, methods and results. Geneva, World
   Health Organization (GPE Discussion Paper No. 54). Available at http://www.who.int/evidence

   2. Mathers CD (2005). Uncertainty and data availability for the global burden of disease estimates 2000-2002. Evidence and Information for Policy Working Paper. Geneva, World Health
   Organization. Available at http://www.who.int/evidence/bod
GBD                                                                                                                                  Antigua and
code      GBD cause (b)                             Afghanistan     Albania          Algeria          Andorra          Angola         Barbuda          Argentina      Armenia       Australia
          Data sources - level of evidence
               All cause mortality (c)               Level 4b       Level 2b         Level 3b         Level 3b         Level 4b       Level 3b         Level 1a       Level 2a      Level 1a
               Cause-specific mortality (d)           Level 4       Level 2b          Level 4          Level 4          Level 4       Level 2b         Level 2a       Level 2a      Level 2b

          Population ('000) (e)                           22,930          3,141           31,266                 69         13,184               73         37,981          3,072        19,544

W000      All Causes                                        484.5             22.1         173.3                 0.6         306.6               0.6          281.4          26.1          126.6
               Lower uncertainty bound (f)                  347.6             19.3         158.0                 0.5         255.3               0.5          276.6          23.6          124.1
               Upper uncertainty bound (f)                  695.8             28.0         188.4                 0.6         434.8               0.6          286.6          33.8          128.8
W001   I. Communicable, maternal, perinatal and             317.2              1.8             56.9              0.0         230.3               0.1           36.2           1.3            5.5
W002      nutritional conditions
          A. Infectious and parasitic diseases              169.3              0.2             30.2              0.0         143.0               0.0           15.6           0.5            1.8
W003           1. Tuberculosis                               21.1              0.0              0.6              0.0           4.8                -             0.8           0.2            0.1
W004           2. STDs excluding HIV                          0.3              0.0              2.1              0.0           2.3               0.0            0.0           0.0            0.0
W005               a. Syphilis                                0.1              0.0              2.0              0.0           2.3               0.0            0.0           0.0            0.0
W006               b. Chlamydia                               0.1               -               0.0               -            0.0                -              -             -              -
W007               c. Gonorrhoea                              0.0               -               0.0               -            0.0                -              -            0.0             -
W009           3. HIV/AIDS                                    0.0              0.0              0.3              0.0          21.1               0.0            1.8           0.2            0.1
W010           4. Diarrhoeal diseases                        41.2              0.0              8.1              0.0          48.8               0.0            0.4           0.1            0.0
W011           5. Childhood-cluster diseases                 15.5              0.0              4.1              0.0          12.4               0.0            0.0           0.0            0.0
W012               a. Pertussis                               6.6               -               0.6               -            4.2                -             0.0           0.0            0.0
W013               b. Poliomyelitis                           0.0               -                -               0.0            -                 -              -             -             0.0
W014               c. Diphtheria                              0.0               -               0.0               -            0.1                -              -            0.0             -
W015               d. Measles                                 2.2               -               3.4               -            6.2                -              -            0.0             -
W016               e. Tetanus                                 6.7              0.0              0.0              0.0           1.9               0.0            0.0           0.0            0.0
W017           6. Meningitis                                  8.3              0.0              0.2              0.0           0.6               0.0            0.4           0.0            0.1
W018           7. Hepatitis B (g)                             1.0              0.0              0.5              0.0           0.8               0.0            0.1           0.0            0.0
W019               Hepatitis C (g)                            0.5              0.0              0.2              0.0           0.4               0.0            0.1           0.0            0.0
W020           8. Malaria                                     0.9               -               0.0              0.0          17.9                -              -            0.0            0.0
W021           9. Tropical-cluster diseases                   0.4              0.0              1.0              0.0           3.1                -             0.7            -              -
W022               a. Trypanosomiasis                         0.0               -               0.7               -            1.3                -              -             -              -
W023               b. Chagas disease                           -                -                -                -             -                 -             0.7            -              -
W024               c. Schistosomiasis                         0.0               -               0.1               -            1.5                -              -             -              -
W025               d. Leishmaniasis                           0.4              0.0              0.2              0.0           0.2                -             0.0            -              -
W026               e. lymphatic filariasis                    0.0               -                -                -             -                 -              -             -              -
W027               f. Onchocerciasis                           -                -                -                -             -                 -              -             -              -
W028           10. Leprosy                                    0.0               -               0.1              0.0           0.0                -             0.0            -              -
W029           11. Dengue                                     0.0               -               0.0               -            0.0                -              -             -             0.0
W030           12. Japanese encephalitis                       -                -                -                -             -                 -              -             -              -
W031           13. Trachoma                                    -                -                -                -             -                 -              -             -              -
W032           14. Intestinal nematode infections             0.0              0.0              0.1               -            0.1                -             0.0            -             0.0
W033               a. Ascariasis                              0.0               -               0.0               -            0.0                -              -             -              -
W034               b. Trichuriasis                             -                -               0.0               -            0.0                -              -             -              -
W035               c. Hookworm disease                        0.0               -               0.1               -            0.0                -              -             -              -
W038      B.   Respiratory infections                        56.7              1.0             14.1              0.0          47.8               0.0           12.6           0.3            2.8
W039           1. Lower respiratory infections               55.9              1.0             13.8              0.0          47.0               0.0           12.6           0.3            2.8
W040           2. Upper respiratory infections                0.8              0.0              0.3              0.0           0.8                -             0.0           0.0            0.0
W041           3. Otitis media                                0.0               -               0.0              0.0           0.1                -              -            0.0            0.0
W042      C.   Maternal conditions                           18.8              0.0              1.0              0.0          11.3               0.0            0.3           0.0            0.0
W049      D.   Perinatal conditions (h)                      62.0              0.5             10.6              0.0          19.0               0.0            5.9           0.5            0.7
W050           1. Low birth weight                           34.2              0.1              4.6              0.0           8.2               0.0            1.6           0.2            0.0
W051           2. Birth asphyxia and birth trauma            17.2              0.2              4.4              0.0           7.8               0.0            2.7           0.1            0.2
W053      E.   Nutritional deficiencies                      10.4              0.1              1.0              0.0           9.1               0.0            1.9           0.0            0.2
W054           1. Protein-energy malnutrition                 7.3              0.0              0.5              0.0           8.2               0.0            1.4           0.0            0.1
W055           2. Iodine deficiency                           0.2               -               0.0               -            0.0                -              -             -              -
W056           3. Vitamin A deficiency                        0.0              0.0              0.2               -            0.6                -              -             -              -
W057           4. Iron-deficiency anaemia                     1.3              0.0              0.3              0.0           0.3               0.0            0.4           0.0            0.1
W059   II. Noncommunicable diseases                         140.6             18.3             93.9              0.5          51.1               0.5          225.1          23.6          113.1
W060      A. Malignant neoplasms                             18.9              3.9             16.9              0.2           9.2               0.1           59.9           4.7           36.5
W061         1. Mouth and oropharynx cancers                  2.3              0.1              0.8              0.0           1.0               0.0            1.0           0.1            0.7
W062         2. Oesophagus cancer                             2.3              0.1              0.2              0.0           0.5               0.0            2.5           0.1            1.1
W063         3. Stomach cancer                                1.2              0.6              1.4              0.0           1.4               0.0            3.4           0.5            1.3
W064         4. Colon and rectum cancers                      1.0              0.1              1.3              0.0           0.3               0.0            7.4           0.4            5.3
W065         5. Liver cancer                                  0.6              0.6              0.2              0.0           0.5                -             1.9           0.3            0.8
W066         6. Pancreas cancer                               0.2              0.1              0.4              0.0           0.1               0.0            3.6           0.2            1.8
W067         7. Trachea, bronchus, lung cancers               1.3              0.9              2.3              0.0           0.4               0.0            8.8           1.0            7.0
W068         8. Melanoma and other skin cancers               0.1              0.1              0.1              0.0           0.3                -             0.9           0.1            1.5
W069         9. Breast cancer                                 2.0              0.2              1.7              0.0           0.9               0.0            6.0           0.5            2.7
W070         10. Cervix uteri cancer                          0.3              0.0              1.0              0.0           0.9               0.0            1.1           0.1            0.3
W071         11. Corpus uteri cancer                          0.1              0.1              0.1              0.0           0.1               0.0            1.9           0.1            0.3
W072         12. Ovary cancer                                 0.4              0.0              0.4              0.0           0.2               0.0            1.2           0.1            0.8
W073         13. Prostate cancer                              0.3              0.2              0.7              0.0           0.6               0.0            4.4           0.1            3.0
W074         14. Bladder cancer                               0.7               -               1.4              0.0           0.3               0.0            1.5           0.1            0.9
W075         15. Lymphomas, multiple myeloma                  1.9              0.1              1.3              0.0           0.6               0.0            2.6           0.1            2.7
W076         16. Leukaemia                                    1.3              0.2              0.4              0.0           0.2               0.0            2.2           0.2            1.5
W078      B. Other neoplasms                                  2.1              0.3              0.3              0.0           0.2               0.0            2.4           0.0            0.8
W079      C. Diabetes mellitus                                2.7              0.2              3.0              0.0           1.6               0.0            9.6           1.6            3.2
W080      D. Endocrine disorders                              3.3              0.1              0.8              0.0           0.7               0.0            2.8           0.1            1.4
W081      E. Neuropsychiatric conditions                      8.8              0.6              2.7              0.0           2.4               0.0            5.7           0.3            7.4
W082         1. Unipolar depressive disorders                 0.0              0.0               -               0.0            -                 -             0.0           0.0            0.1
W083         2. Bipolar disorder                               -                -                -               0.0            -                 -              -            0.0            0.0
W084         3. Schizophrenia                                 0.0              0.0               -               0.0            -                 -             0.0           0.0            0.0
W085         4. Epilepsy                                      0.8              0.1              1.1              0.0           1.1               0.0            0.3           0.1            0.3
W086         5. Alcohol use disorders                         0.1              0.0              0.2              0.0           0.2               0.0            0.7           0.0            0.3
W087         6. Alzheimer and other dementias*                0.1              0.0              0.3              0.0           0.1               0.0            2.2           0.1            4.0
W088         7. Parkinson disease                             0.0              0.0              0.3              0.0           0.1                -             0.6           0.0            0.9
W089         8. Multiple sclerosis                            0.0              0.0              0.0              0.0           0.0               0.0            0.1           0.0            0.1
W090         9. Drug use disorders                            5.2              0.0              0.1              0.0           0.0               0.0            0.2           0.0            0.5
W091         10. Post-traumatic stress disorder                -               0.0               -                -             -                 -              -            0.0             -
W092         11. Obsessive-compulsive disorder                 -                -                -                -             -                 -              -             -              -
W093         12. Panic disorder                                -                -                -                -             -                 -              -             -              -
W094         13. Insomnia (primary)                            -                -                -                -             -                 -              -             -              -
W095         14. Migraine                                      -                -                -                -             -                 -              -             -              -
W098      F. Sense organ diseases                             0.1              0.0               -               0.0            -                 -              -             -             0.0
W099         1. Glaucoma                                       -                -                -               0.0            -                 -              -             -              -
W100         2. Cataracts                                      -                -                -                -             -                 -              -             -              -
W101         3. Vision disorders, age-related                  -                -                -                -             -                 -              -             -              -
W102         4. Hearing loss, adult onset                      -                -                -                -             -                 -              -             -              -
W104      G. Cardiovascular diseases                         67.6             11.5             46.9              0.2          22.0               0.2           93.3          14.2           47.2
W105         1. Rheumatic heart disease                       1.9              0.0              0.8              0.0           0.6                -             0.2           0.2            0.2
W106         2. Hypertensive heart disease                    7.5              0.4              2.5              0.0           1.2               0.0            4.5           0.5            1.1
W107         3. Ischaemic heart disease                      33.2              4.0             14.9              0.1           7.1               0.1           34.3           8.5           25.5
W108         4. Cerebrovascular disease                      11.5              4.2             16.2              0.1           7.6               0.1           22.7           4.2           11.7

   05/18/2010 +                                                                                                                                                                                 ^
W109            5. Inflammatory heart diseases              2.3   0.1    1.6   0.0    1.1   0.0    3.1   0.6   1.0
W111         H. Respiratory diseases                        8.6   0.7   10.9   0.0    6.1   0.0   27.7   1.1   7.7
W112            1. Chronic obstructive pulmonary disease    3.3   0.3    5.0   0.0    2.3   0.0    5.1   0.8   5.2
W113            2. Asthma                                   2.3   0.3    0.6   0.0    0.3   0.0    0.8   0.1   0.4
W115         I. Digestive diseases                         12.4   0.5    6.0   0.0    4.0   0.0   11.9   1.0   4.2
W116            1. Peptic ulcer disease                     0.4   0.0    0.6   0.0    0.4   0.0    0.4   0.2   0.5
W117            2. Cirrhosis of the liver                   5.5    -     2.1   0.0    1.4   0.0    2.6   0.5   0.9
W118            3. Appendicitis                             0.0   0.0    0.0   0.0    0.0   0.0    0.1   0.0   0.0
W120         J. Genitourinary diseases                      7.0   0.4    3.6   0.0    2.7   0.0    7.5   0.4   2.8
W121            1. Nephritis and nephrosis                  6.3   0.4    3.3   0.0    2.5   0.0    6.4   0.2   2.1
W122            2. Benign prostatic hypertrophy             0.1   0.0    0.1   0.0    0.0    -     0.0   0.1   0.0
W124         K. Skin diseases                               0.2   0.0    2.0   0.0    0.0   0.0    0.6   0.0   0.3
W125         L. Musculoskeletal diseases                    0.2   0.0    0.1   0.0    0.3   0.0    0.6   0.1   0.9
W126            1. Rheumatoid arthritis                     0.0   0.0    0.0   0.0    0.0    -     0.1   0.0   0.2
W127            2. Osteoarthritis                           0.0   0.0     -    0.0     -     -     0.0   0.0   0.1
W131         M. Congenital anomalies                        8.6   0.1    0.7   0.0    1.8   0.0    3.1   0.2   0.6
W143         N. Oral conditions                             0.0   0.0     -    0.0     -     -      -     -    0.0
W144            1. Dental caries                             -     -      -     -      -     -      -     -     -
W145            2. Periodontal disease                       -     -      -     -      -     -      -     -     -
W146            3. Edentulism                                -     -      -     -      -     -      -     -     -
W148     III.Injuries                                      26.8   2.0   22.5   0.0   25.2   0.0   20.1   1.2   8.0
W149         A. Unintentional injuries                     18.2   1.7   12.9   0.0   17.2   0.0   12.8   1.0   5.5
W150            1. Road traffic accidents                   8.4   0.1    5.4   0.0    7.6   0.0    4.4   0.3   1.7
W151            2. Poisonings                               1.0   0.0    1.0   0.0    1.2   0.0    0.2   0.1   0.8
W152            3. Falls                                    1.3   0.0    0.8   0.0    0.7    -     0.4   0.0   0.6
W153            4. Fires                                    1.2   0.0    1.2   0.0    1.5   0.0    0.5   0.0   0.1
W154            5. Drownings                                2.4   0.0    1.2   0.0    2.4   0.0    1.0   0.1   0.2
W155            6. Other unintentional injuries             3.9   1.5    3.4   0.0    3.8   0.0    6.4   0.4   2.0
W156         B. Intentional injuries                        8.6   0.3    9.7   0.0    7.9   0.0    7.3   0.2   2.5
W157            1. Self-inflicted injuries                  1.5   0.1    0.9   0.0    1.1   0.0    3.9   0.1   2.2
W158            2. Violence                                 0.9   0.2    3.7   0.0    5.2   0.0    3.3   0.1   0.3
W159            3. War                                      5.9   0.0    5.0    -     1.7    -      -    0.0    -


Refer to Notes sheet for notes on this table.


    05/18/2010 +                                                                                                ^
All cause mortality (c)                         Level 4b       Level 2b          Level 3b       Level 3b           Level 4b       Level 3b         Level 1a       Level 2a          Level 1a
                 Cause-specific mortality (d)                    Level 4        Level 2b           Level 4        Level 4            Level 4       Level 2b         Level 2a       Level 2a          Level 2b
                 Incidence, prevalence, severity, duration (j)   Level 4         Level 3           Level 4        Level 4            Level 4        Level 3          Level 3        Level 3           Level 3

           Population ('000) (e)                                     22,930           3,141           31,266                69          13,184                73        37,981           3,072           19,544

W000       All Causes                                                 17,011               503          5,500                   9        10,757               13          6,293               516          2,154
W001    I. Communicable, maternal, perinatal and                      11,708                70          2,064                   0         8,174                 2           784                64            110
W002       nutritional conditions
           A. Infectious and parasitic diseases                        5,814                10          1,049                   0         4,888                 1           342                21             35
W003             1.  Tuberculosis                                        523                  1            20                   0           133                 0            18                  5              1
W004             2.  STDs excluding HIV                                   52                  2           135                   0            99                 0            37                  3              4
W005                 a. Syphilis                                            3                 0            44                   0            61                 0              4                 0              0
W006                 b. Chlamydia                                         22                  1            39                   0            15                 0            19                  2              3
W007                 c. Gonorrhoea                                        26                  1            51                   0            22                 0            14                  1              1
W009             3. HIV/AIDS                                                0                 0              9                  0           641                 0            64                  5              4
W010             4. Diarrhoeal diseases                                1,343                  1           295                   0         1,608                 0            49                  4              5
W011             5. Childhood-cluster diseases                           585                  1           155                   0           473                 0            12                  1              5
W012                 a. Pertussis                                        282                  1            32                   0           191                 0            11                  0              5
W013                 b. Poliomyelitis                                       1               -                1                  0              0                0              0                 0              0
W014                 c. Diphtheria                                          0               -                0              -                  2                0              0                 0            -
W015                 d. Measles                                           80                  0           121               -               216                 0              0                 0            -
W016                 e. Tetanus                                          223                  0              1                  0            64                 0              0                 0              0
W017             6. Meningitis                                           459                  1              5                  0            29                 0            14                  1              3
W018             7. Hepatitis B (g)                                       26                  0              8                  0            24                 0              1                 0              0
W019                 Hepatitis C (g)                                      13                  0              3                  0            11                 0              1                 0              0
W020             8. Malaria                                               64                -                0                  0           681               -                0                 1              0
W021             9. Tropical-cluster diseases                             17                  0           106                   0           146                 0            37                  0            -
W022                 a. Trypanosomiasis                                     0               -              24               -                41               -              -                 -              -
W023                 b. Chagas disease                                    -                 -              -                -                -                  0            35                -              -
W024                 c. Schistosomiasis                                     0               -              66               -                48                 0            -                 -              -
W025                 d. Leishmaniasis                                     17                  0            16                   0            11                 0              2                 0            -
W026                 e. lymphatic filariasis                                0               -              -                -                45               -              -                 -              -
W027                 f. Onchocerciasis                                    -                 -              -                -                  2              -              -                 -              -
W028             10. Leprosy                                                1                 0              1                  0              1                0              1               -                0
W029             11. Dengue                                                 0               -                0              -                  0              -              -                 -                0
W030             12. Japanese encephalitis                                  1               -              -                -                -                -              -                 -              -
W031             13. Trachoma                                               5               -              -                -                  4              -              -                 -                0
W032             14. Intestinal nematode infections                       13                  0            76               -                40                 0              6                 0              0
W033                 a. Ascariasis                                          6               -              58               -                32                 0              1                 0            -
W034                 b. Trichuriasis                                        5               -                6              -                  3                0              3               -              -
W035                 c. Hookworm disease                                    2               -              12               -                  5                0              1                 0            -
W038       B.    Respiratory infections                                2,067                20            315                   0         1,634                 0            96                  8            13
W039             1. Lower respiratory infections                       2,031                19            303                   0         1,599                 0            87                  7            10
W040             2. Upper respiratory infections                          28                  0              4                  0            28                 0              2                 0              1
W041             3. Otitis media                                            8                 0              8                  0              7                0              8                 1              2
W042       C.    Maternal conditions                                     942                  5           145                   0           499                 0            53                  4              9
W049       D.    Perinatal conditions (h)                              2,383                22            408                   0           735                 1           247                20             40
W050             1. Low birth weight                                   1,275                  5           163                   0           294                 0            59                  8              9
W051             2. Birth asphyxia and birth trauma                      736                  7           186                   0           335                 0           130                  9            13
W053       E.    Nutritional deficiencies                                502                14            147                   0           418                 0            46                10             14
W054             1. Protein-energy malnutrition                          338                  2            50                   0           345                 0            28                  1              0
W055             2. Iodine deficiency                                     13                  9            12               -                  8              -                1                 0            -
W056             3. Vitamin A deficiency                                    1                 0              3              -                22               -              -                   0            -
W057             4. Iron-deficiency anaemia                               94                  2            82                   0            43                 0            16                  9            13
W059    II. Noncommunicable diseases                                   4,103               345          2,522                   7         1,495               10          4,774               410          1,834
W060       A. Malignant neoplasms                                        353                45            174                   1           117                 1           565                57            306
W061          1. Mouth and oropharynx cancers                             39                  1            10                   0              9                0            11                  1              7
W062          2. Oesophagus cancer                                        35                  0              2                  0              5                0            19                  0              8
W063          3. Stomach cancer                                           21                  6            13                   0            16                 0            29                  5              9
W064          4. Colon and rectum cancers                                 19                  2            13                   0              4                0            56                  4            46
W065          5. Liver cancer                                             10                  5              1                  0              7              -              15                  3              6
W066          6. Pancreas cancer                                            3                 1              4                  0              2                0            28                  2            12
W067          7. Trachea, bronchus, lung cancers                          17                  9            20                   0              5                0            81                10             52
W068          8. Melanoma and other skin cancers                            2                 1              1                  0              3                0              8                 1            13
W069          9. Breast cancer                                            38                  4            22                   0            10                 0            63                  7            34
W070          10. Cervix uteri cancer                                       5                 1            13                   0            11                 0            19                  2              4
W071          11. Corpus uteri cancer                                       2                 2              1                  0              1                0            30                  3              4
W072          12. Ovary cancer                                              9                 0              4                  0              3                0            13                  2              8
W073          13. Prostate cancer                                           2                 2              4                  0              3                0            23                  1            18
W074          14. Bladder cancer                                            7               -                9                  0              3                0            11                  1              6
W075          15. Lymphomas, multiple myeloma                             48                  1            18                   0            12                 0            28                  3            21
W076          16. Leukaemia                                               40                  3              7                  0              3                0            30                  3            13
W078       B. Other neoplasms                                             41                  4              4                  0              5                0            25                  0              4
W079       C. Diabetes mellitus                                           49                  5            49                   0            21                 0           146                19             46
W080       D. Endocrine disorders                                         76                  5            30                   0            38                 1            80                  6            44
W081       E. Neuropsychiatric conditions                                851                99            737                   2           353                 3         1,731                91            599
W082          1. Unipolar depressive disorders                           288                37            227                   1            81                 1           457                38            187
W083          2. Bipolar disorder                                         52                  7            88                   0            32                 0            82                  7            32
W084          3. Schizophrenia                                            61                  8            87                   0            31                 0            98                  9            32
W085          4. Epilepsy                                                 42                  5            46                   0            39                 0            55                  3            11
W086          5. Alcohol use disorders                                      3                 5              6                  0            16                 1           462                  3            72
W087          6. Alzheimer and other dementias*                           12                  4            18                   0              7                0            90                  6            81
W088          7. Parkinson disease                                          9                 2              4                  0              1                0              6                 1            16
W089          8. Multiple sclerosis                                         5                 1              6                  0              2                0              9                 1              5
W090          9. Drug use disorders                                      142                  3            24                   0              8                0            94                  1            47
W091          10. Post-traumatic stress disorder                          12                  2            17                   0              6                0            17                  2            11
W092          11. Obsessive-compulsive disorder                           14                  4            41                   0            16                 0            45                  4              8
W093          12. Panic disorder                                          26                  3            39                   0            14                 0            40                  3            17
W094          13. Insomnia (primary)                                      14                  2            17                   0              6                0            28                  1            16
W095          14. Migraine                                                34                  4            19                   0              8                0            57                  3            22
W098       F. Sense organ diseases                                       223                18            524                   0           169                 1           395                32             79
W099          1. Glaucoma                                                   2                 1            55                   0            18                 0            24                  2              1
W100          2. Cataracts                                               106                  2           302                   0            98                 0           127                  3              1
W101          3. Vision disorders, age-related                            17                  6            53                   0            17                 0           123                12             12
W102          4. Hearing loss, adult onset                                98                  9           114                   0            36                 0           121                16             64
W104       G. Cardiovascular diseases                                  1,149                98            394                   1           271                 2           687               115            268
W105          1. Rheumatic heart disease                                  59                  1            17                   0            17                 0              3                 2              2
W106          2. Hypertensive heart disease                               98                  3            21                   0            13                 0            30                  4              6
W107          3. Ischaemic heart disease                                 469                36            116                   0            74                 0           244                65            134
W108          4. Cerebrovascular disease                                 208                33            139                   0            89                 1           218                34             76
W109          5. Inflammatory heart diseases                              62                  2            24                   0            26                 0            32                  7            11
W111       H. Respiratory diseases                                       261                12            146                   1           136                 1           375                16            242
W112          1. Chronic obstructive pulmonary disease                    53                  4            41                   0            28                 0            74                  9           164
W113          2. Asthma                                                  103                  4            37                   0            37                 0            97                  5            56
W115       I. Digestive diseases                                         371                17            150                   0           144                 1           203                23             65
W116          1. Peptic ulcer disease                                     10                  0            11                   0              8                0              3                 3              4
W117          2. Cirrhosis of the liver                                   97                -              32                   0            27                 0            36                  7            13
W118          3. Appendicitis                                               1                 0              1                  0              1                0              1                 0              1


  05/18/2010 +                                                                                                                                                                                                  ^
W120           J. Genitourinary diseases              152   10    69   0      56   0    87   11    30
W121              1. Nephritis and nephrosis          111    6    33   0      38   0    45    3      8
W122              2. Benign prostatic hypertrophy       7    1    14   0       4   0    21    2      5
W124           K. Skin diseases                        15    1    48   0      12   0    27    1      2
W125           L. Musculoskeletal diseases             80   22   121   0      46   0   206   18    95
W126              1. Rheumatoid arthritis              14    4    15   0       6   0    46    3    16
W127              2. Osteoarthritis                    31   12    72   0      23   0    93    8    54
W131           M. Congenital anomalies                455    7    50   0     117   0   179   14    36
W143           N. Oral conditions                      26    4    27   0      11   0    67    6    17
W144              1. Dental caries                     19    2    17   0       8   0    55    4    10
W145              2. Periodontal disease                2    0     2   0       1   0     2    0      1
W146              3. Edentulism                         5    1     8   0       3   0    10    2      6
W148       III.Injuries                             1,200   88   913   1   1,088   1   736   43   211
W149           A. Unintentional injuries              902   78   537   1     784   1   463   37   151
W150              1. Road traffic accidents           301    5   185   0     284   0   148    8    49
W151              2. Poisonings                        28    1    22   0      32   0     6    1    22
W152              3. Falls                            114   10    30   0      42   0    36    4    22
W153              4. Fires                             70    2    46   0      74   0    13    2      3
W154              5. Drownings                         79    1    35   0      72   0    28    2      6
W155              6. Other unintentional injuries     310   59   220   0     279   0   232   20    50
W156           B. Intentional injuries                297    9   376   0     304   0   273    5    59
W157              1. Self-inflicted injuries           63    2    22   0      29   0    83    2    51
W158              2. Violence                          49    5   184   0     218   0   188    3      8
W159              3. War                              176    2   170   0      57   0     1    0    -


Refer to Notes sheet for notes on this table.


    05/18/2010 +                                                                                     ^
All cause mortality (c)                 Level 4b       Level 2b      Level 3b      Level 3b        Level 4b       Level 3b        Level 1a      Level 2a       Level 1a
                 Cause-specific mortality (d)            Level 4        Level 2b       Level 4       Level 4         Level 4       Level 2b        Level 2a      Level 2a       Level 2b

           Population ('000) (e)                             22,930           3,141       31,266               69       13,184                73       37,981          3,072        19,544

W000       All Causes                                         2,113.1         703.5         554.4         811.9          2,325.3         799.6           741.0         851.2          647.6
                 Lower uncertainty bound (f)                  1,516.1         615.8         505.4         755.7          1,936.7         731.9           728.3          769.6         635.0
                 Upper uncertainty bound (f)                  3,034.6         891.1         602.6         867.3          3,298.1         867.7           754.6        1,100.6         659.0
W001    I. Communicable, maternal, perinatal and              1,383.3          58.1         182.1          36.7          1,747.0         106.9            95.4          42.1           28.1
W002       nutritional conditions
           A. Infectious and parasitic diseases                 738.2           7.1          96.5          14.3          1,084.9          31.7            41.0          16.4            9.2
W003             1.  Tuberculosis                                92.2           0.8           1.9           1.1             36.4            -              2.2           5.4            0.3
W004             2.  STDs excluding HIV                           1.2           0.2           6.8           0.0             17.7           0.6             0.1           0.1            0.1
W005                 a. Syphilis                                  0.3           0.1           6.5           0.0             17.2           0.6             0.1           0.0            0.0
W006                 b. Chlamydia                                 0.3            -            0.1            -               0.2            -               -             -              -
W007                 c. Gonorrhoea                                0.1            -            0.0            -               0.1            -               -            0.0             -
W009             3. HIV/AIDS                                      0.0           0.3           1.0           4.0            159.9          13.7             4.7           5.7            0.6
W010             4. Diarrhoeal diseases                         179.5           0.2          26.1           0.9            369.9           0.6             1.1           1.9            0.2
W011             5. Childhood-cluster diseases                   67.8           0.1          13.0           0.1             93.8           0.5             0.1           0.2            0.1
W012                 a. Pertussis                                28.7            -            1.8            -              32.1            -              0.0           0.0            0.0
W013                 b. Poliomyelitis                             0.0            -             -            0.0               -             -               -             -             0.1
W014                 c. Diphtheria                                0.0            -            0.0            -               0.4            -               -            0.1             -
W015                 d. Measles                                   9.8            -           11.0            -              46.7            -               -            0.1             -
W016                 e. Tetanus                                  29.3           0.1           0.1           0.0             14.6           0.5             0.0           0.0            0.0
W017             6. Meningitis                                   36.2           1.4           0.7           0.6              4.6           4.3             1.1           0.9            0.3
W018             7. Hepatitis B (g)                               4.4           0.3           1.5           0.2              6.1           0.3             0.2           0.1            0.1
W019                 Hepatitis C (g)                              2.1           0.1           0.7           1.3              2.7           0.2             0.3           0.0            0.0
W020             8. Malaria                                       4.1            -            0.0           0.0            136.1            -               -            0.1            0.0
W021             9. Tropical-cluster diseases                     1.6           0.1           3.1           0.0             23.2            -              1.7            -              -
W022                 a. Trypanosomiasis                           0.0            -            2.2            -               9.9            -               -             -              -
W023                 b. Chagas disease                             -             -             -             -                -             -              1.7            -              -
W024                 c. Schistosomiasis                           0.0            -            0.2            -              11.6            -               -             -              -
W025                 d. Leishmaniasis                             1.6           0.1           0.8           0.0              1.8            -              0.0            -              -
W026                 e. lymphatic filariasis                      0.0            -             -             -                -             -               -             -              -
W027                 f. Onchocerciasis                             -             -             -             -                -             -               -             -              -
W028             10. Leprosy                                      0.0            -            0.3           0.0              0.1            -              0.1            -              -
W029             11. Dengue                                       0.0            -            0.0            -               0.0            -               -             -             0.0
W030             12. Japanese encephalitis                         -             -             -             -                -             -               -             -              -
W031             13. Trachoma                                      -             -             -             -                -             -               -             -              -
W032             14. Intestinal nematode infections               0.1           0.0           0.2            -               0.5            -              0.0            -             0.0
W033                 a. Ascariasis                                0.0            -            0.0            -               0.0            -               -             -              -
W034                 b. Trichuriasis                               -             -            0.0            -               0.0            -               -             -              -
W035                 c. Hookworm disease                          0.1            -            0.2            -               0.4            -               -             -              -
W038       B.    Respiratory infections                         247.4          31.4          45.2          19.0            362.8          33.0            33.2          10.0           14.3
W039             1. Lower respiratory infections                243.9          31.0          44.2          18.8            356.3          33.0            33.1           9.8           14.2
W040             2. Upper respiratory infections                  3.4           0.4           0.9           0.2              5.9            -              0.0           0.2            0.1
W041             3. Otitis media                                  0.1            -            0.0           0.0              0.7            -               -            0.0            0.0
W042       C.    Maternal conditions                             82.0           0.6           3.3           0.0             85.6           3.2             0.9           0.3            0.1
W049       D.    Perinatal conditions (h)                       270.3          17.2          33.9           2.0            144.2          25.9            15.4          14.7            3.4
W050             1. Low birth weight                            149.3           3.0          14.6           0.3             62.2          11.7             4.1           7.5            0.2
W051             2. Birth asphyxia and birth trauma              74.9           4.8          14.0           0.9             59.5           9.1             7.0           4.6            0.9
W053       E.    Nutritional deficiencies                        45.4           1.8           3.2           1.4             69.4          13.1             4.9           0.8            1.2
W054             1. Protein-energy malnutrition                  31.8           0.7           1.7           0.3             62.1           2.1             3.6           0.3            0.4
W055             2. Iodine deficiency                             0.7            -            0.0            -               0.2            -               -             -              -
W056             3. Vitamin A deficiency                          0.1           0.1           0.6            -               4.9            -               -             -              -
W057             4. Iron-deficiency anaemia                       5.7           0.9           0.8           0.7              2.0          11.0             1.1           0.5            0.5
W059    II. Noncommunicable diseases                            613.0         583.1         300.2         735.9            387.3         658.8           592.7         769.4          578.7
W060       A. Malignant neoplasms                                82.6         123.5          54.2         223.3             70.0         129.1           157.6         153.1          186.6
W061          1. Mouth and oropharynx cancers                    10.1           2.2           2.5           5.4              7.4           2.2             2.7           3.1            3.7
W062          2. Oesophagus cancer                               10.1           1.6           0.8           4.8              3.4           2.4             6.5           1.8            5.6
W063          3. Stomach cancer                                   5.4          18.2           4.5          14.7             10.4          15.1             9.0          16.3            6.6
W064          4. Colon and rectum cancers                         4.2           4.0           4.2          31.8              2.6          10.9            19.4          11.5           27.2
W065          5. Liver cancer                                     2.8          17.6           0.5          10.9              3.9            -              4.9           8.5            4.1
W066          6. Pancreas cancer                                  0.7           4.4           1.4           9.9              0.9           3.8             9.5           6.1            9.2
W067          7. Trachea, bronchus, lung cancers                  5.7          29.7           7.2          42.9              3.2           7.3            23.1          32.5           36.0
W068          8. Melanoma and other skin cancers                  0.4           1.8           0.4           3.0              2.1            -              2.3           2.7            7.6
W069          9. Breast cancer                                    8.9           6.9           5.4          16.4              6.5          14.7            15.8          16.4           14.1
W070          10. Cervix uteri cancer                             1.2           1.0           3.2           1.4              6.5           2.8             2.9           3.5            1.4
W071          11. Corpus uteri cancer                             0.4           2.3           0.4           3.1              0.6           1.9             5.0           4.1            1.5
W072          12. Ovary cancer                                    1.9           0.6           1.1           3.8              1.3           1.6             3.1           4.7            4.0
W073          13. Prostate cancer                                 1.2           7.1           2.4          14.2              4.2          31.1            11.6           3.3           15.4
W074          14. Bladder cancer                                  2.8            -            4.5           9.8              2.5           3.4             4.0           3.8            4.7
W075          15. Lymphomas, multiple myeloma                     8.2           3.0           4.0          12.3              4.3           8.9             6.9           4.8           13.8
W076          16. Leukaemia                                       5.8           4.9           1.2           7.8              1.4           5.1             5.8           4.9            7.7
W078       B. Other neoplasms                                     9.4          10.1           0.9           7.7              1.8           2.9             6.3           0.3            4.0
W079       C. Diabetes mellitus                                  11.8           6.2           9.7          19.9             12.4          54.3            25.4          50.7           16.3
W080       D. Endocrine disorders                                14.2           1.9           2.5           5.6              5.0          35.8             7.3           2.3            7.3
W081       E. Neuropsychiatric conditions                        38.2          18.2           8.5          65.6             18.5          23.0            15.1           8.5           38.1
W082          1. Unipolar depressive disorders                    0.0           0.1            -            0.2               -             -              0.0           0.0            0.3
W083          2. Bipolar disorder                                  -             -             -            0.1               -             -               -            0.0            0.0
W084          3. Schizophrenia                                    0.1           0.5            -            0.2               -             -              0.0           0.3            0.2
W085          4. Epilepsy                                         3.4           3.8           3.5           0.7              8.2           3.6             0.7           1.7            1.3
W086          5. Alcohol use disorders                            0.5           0.0           0.8           0.6              1.3          11.7             1.9           0.7            1.4
W087          6. Alzheimer and other dementias*                   0.6           1.4           1.0          50.0              1.0           0.5             5.9           2.1           20.3
W088          7. Parkinson disease                                0.2           1.4           0.9           5.2              0.7            -              1.6           1.0            4.5
W089          8. Multiple sclerosis                               0.2           1.4           0.0           0.4              0.1           0.7             0.3           0.3            0.6
W090          9. Drug use disorders                              22.9           0.7           0.2           1.4              0.2           0.1             0.6           0.7            2.8
W091          10. Post-traumatic stress disorder                   -            0.1            -             -                -             -               -            0.0             -
W092          11. Obsessive-compulsive disorder                    -             -             -             -                -             -               -             -              -
W093          12. Panic disorder                                   -             -             -             -                -             -               -             -              -
W094          13. Insomnia (primary)                               -             -             -             -                -             -               -             -              -
W095          14. Migraine                                         -             -             -             -                -             -               -             -              -
W098       F. Sense organ diseases                                0.4           0.3            -            0.0               -             -               -             -             0.0
W099          1. Glaucoma                                          -             -             -            0.0               -             -               -             -              -
W100          2. Cataracts                                         -             -             -             -                -             -               -             -              -
W101          3. Vision disorders, age-related                     -             -             -             -                -             -               -             -              -
W102          4. Hearing loss, adult onset                         -             -             -             -                -             -               -             -              -
W104       G. Cardiovascular diseases                           295.0         366.4         150.0         269.5            167.2         317.7           245.5         461.4          241.7
W105          1. Rheumatic heart disease                          8.5           1.4           2.4           3.9              4.7            -              0.6           4.9            1.2
W106          2. Hypertensive heart disease                      32.6          14.1           8.0          11.7              8.9          33.7            11.9          16.6            5.9
W107          3. Ischaemic heart disease                        144.6         127.0          47.8          97.5             54.1          71.9            90.3         277.2          130.3
W108          4. Cerebrovascular disease                         50.3         132.7          51.9          75.9             58.0         127.3            59.7         137.1           60.0
W109          5. Inflammatory heart diseases                     10.2           3.6           5.0           9.9              8.2           0.5             8.2          18.9            4.9
W111       H. Respiratory diseases                               37.6          21.0          34.8          71.9             46.0          12.1            73.0          35.9           39.6
W112          1. Chronic obstructive pulmonary disease           14.2           8.8          16.1          36.6             17.6           1.9            13.4          25.5           26.7
W113          2. Asthma                                          10.0           8.5           1.8           2.0              2.5           0.3             2.2           4.0            2.2
W115       I. Digestive diseases                                 54.1          16.1          19.1          42.9             30.2          36.9            31.4          33.1           21.5
W116          1. Peptic ulcer disease                             2.0           1.1           2.0           1.4              2.7           0.6             1.1           5.0            2.5
W117          2. Cirrhosis of the liver                          24.2            -            6.6          13.4             10.6          18.1             6.9          16.1            4.7


  05/18/2010 +                                                                                                                                                                             ^
W118              3. Appendicitis                     0.1    0.1    0.1    0.2     0.3    0.7    0.2    0.4    0.1
W120           J. Genitourinary diseases             30.6   13.4   11.5   17.5    20.3   25.8   19.7   14.2   14.3
W121              1. Nephritis and nephrosis         27.7   11.8   10.5   13.8    19.3   24.1   16.9    7.5   10.7
W122              2. Benign prostatic hypertrophy     0.5    0.6    0.4    0.3     0.3     -     0.1    1.9    0.2
W124           K. Skin diseases                       0.8    0.2    6.4    1.6     0.0   12.9    1.6    0.3    1.3
W125           L. Musculoskeletal diseases            0.8    1.3    0.3    7.8     2.2    3.3    1.5    2.2    4.6
W126              1. Rheumatoid arthritis             0.1    0.4    0.1    0.6     0.3     -     0.3    0.4    1.0
W127              2. Osteoarthritis                   0.0    0.1     -     0.3      -      -     0.1    0.0    0.6
W131           M. Congenital anomalies               37.5    4.5    2.2    2.3    13.7    5.1    8.2    7.3    3.2
W143           N. Oral conditions                     0.1    0.0     -     0.0      -      -      -      -     0.1
W144              1. Dental caries                     -      -      -      -       -      -      -      -      -
W145              2. Periodontal disease               -      -      -      -       -      -      -      -      -
W146              3. Edentulism                        -      -      -      -       -      -      -      -      -
W148       III.Injuries                             116.7   62.3   72.1   39.3   191.0   33.9   52.9   39.6   40.7
W149           A. Unintentional injuries             79.3   53.5   41.2   31.2   130.8   23.2   33.8   32.5   27.9
W150              1. Road traffic accidents          36.7    2.5   17.2   15.2    58.0   10.8   11.5   10.6    8.6
W151              2. Poisonings                       4.4    1.3    3.1    2.8     9.1    0.6    0.5    2.4    4.2
W152              3. Falls                            5.6    0.7    2.4    3.7     5.2     -     1.0    1.4    3.3
W153              4. Fires                            5.3    0.3    3.9    0.3    11.6    0.4    1.3    1.6    0.5
W154              5. Drownings                       10.3    1.2    3.7    0.9    17.9    3.2    2.5    2.2    1.2
W155              6. Other unintentional injuries    17.1   47.4   10.8    8.3    28.9    8.1   17.0   14.2   10.1
W156           B. Intentional injuries               37.4    8.9   30.9    8.1    60.2   10.7   19.1    7.2   12.8
W157              1. Self-inflicted injuries          6.5    2.6    2.9    7.2     8.1    0.5   10.2    3.4   11.3
W158              2. Violence                         4.0    6.0   12.0    0.9    39.6   10.2    8.8    3.7    1.5
W159              3. War                             25.7    0.1   16.1     -     12.5     -      -     0.2     -


Refer to Notes sheet for notes on this table.


    05/18/2010 +                                                                                                 ^
Bodgbddeathdalyestimates

More Related Content

What's hot

Cancer as a causes of death among people with aids
Cancer as a causes of death among people with aidsCancer as a causes of death among people with aids
Cancer as a causes of death among people with aidsAna Paula Bringel
 
Life Expectancy and Mortality Rates in the United States, 1959-2017
Life Expectancy and Mortality Rates in the United States, 1959-2017Life Expectancy and Mortality Rates in the United States, 1959-2017
Life Expectancy and Mortality Rates in the United States, 1959-2017Jim Bloyd, DrPH, MPH
 
Deaths from Respiratory Diseases: Implications for end of life care in England
Deaths from Respiratory Diseases: Implications for end of life care in EnglandDeaths from Respiratory Diseases: Implications for end of life care in England
Deaths from Respiratory Diseases: Implications for end of life care in EnglandNHS IQ legacy organisations
 
Icd10 volume2 en_2010
Icd10 volume2 en_2010Icd10 volume2 en_2010
Icd10 volume2 en_2010ALIYAH MS
 
Causes of death among hiv infected adults 2005
Causes of death among hiv infected adults 2005Causes of death among hiv infected adults 2005
Causes of death among hiv infected adults 2005Ana Paula Bringel
 
Ruan2020 likelihood of survival of coronavirus disease 2019
Ruan2020   likelihood of survival of coronavirus disease 2019Ruan2020   likelihood of survival of coronavirus disease 2019
Ruan2020 likelihood of survival of coronavirus disease 2019Nilda Vllacres
 
University of Bern - adjusted cfr covid-19
University of Bern -  adjusted cfr covid-19University of Bern -  adjusted cfr covid-19
University of Bern - adjusted cfr covid-19Federico Tassara, ASA
 
Covid 19 and diabetes mellitus what we know how our patients
Covid 19 and diabetes mellitus  what we know how our patientsCovid 19 and diabetes mellitus  what we know how our patients
Covid 19 and diabetes mellitus what we know how our patientsFreddy Flores Malpartida
 
Covid forecasting-03252020 4
Covid forecasting-03252020 4Covid forecasting-03252020 4
Covid forecasting-03252020 4Mumbaikar Le
 

What's hot (19)

Cancer as a causes of death among people with aids
Cancer as a causes of death among people with aidsCancer as a causes of death among people with aids
Cancer as a causes of death among people with aids
 
Life Expectancy and Mortality Rates in the United States, 1959-2017
Life Expectancy and Mortality Rates in the United States, 1959-2017Life Expectancy and Mortality Rates in the United States, 1959-2017
Life Expectancy and Mortality Rates in the United States, 1959-2017
 
Deaths from Respiratory Diseases: Implications for end of life care in England
Deaths from Respiratory Diseases: Implications for end of life care in EnglandDeaths from Respiratory Diseases: Implications for end of life care in England
Deaths from Respiratory Diseases: Implications for end of life care in England
 
Icd10 volume2 en_2010
Icd10 volume2 en_2010Icd10 volume2 en_2010
Icd10 volume2 en_2010
 
Volume 2
Volume 2Volume 2
Volume 2
 
A comparative risk assessment of burden of disease and injury attributable to...
A comparative risk assessment of burden of disease and injury attributable to...A comparative risk assessment of burden of disease and injury attributable to...
A comparative risk assessment of burden of disease and injury attributable to...
 
Causes of death among hiv infected adults 2005
Causes of death among hiv infected adults 2005Causes of death among hiv infected adults 2005
Causes of death among hiv infected adults 2005
 
Ruan2020 likelihood of survival of coronavirus disease 2019
Ruan2020   likelihood of survival of coronavirus disease 2019Ruan2020   likelihood of survival of coronavirus disease 2019
Ruan2020 likelihood of survival of coronavirus disease 2019
 
Financing global health 2011 global health council 011912_ihme
Financing global health 2011 global health council 011912_ihmeFinancing global health 2011 global health council 011912_ihme
Financing global health 2011 global health council 011912_ihme
 
University of Bern - adjusted cfr covid-19
University of Bern -  adjusted cfr covid-19University of Bern -  adjusted cfr covid-19
University of Bern - adjusted cfr covid-19
 
U.S. County Life Expectancy, 1989-2009, Ali Mokdad, April 2012
U.S. County Life Expectancy, 1989-2009, Ali Mokdad, April 2012U.S. County Life Expectancy, 1989-2009, Ali Mokdad, April 2012
U.S. County Life Expectancy, 1989-2009, Ali Mokdad, April 2012
 
Covid 19 and diabetes mellitus what we know how our patients
Covid 19 and diabetes mellitus  what we know how our patientsCovid 19 and diabetes mellitus  what we know how our patients
Covid 19 and diabetes mellitus what we know how our patients
 
maternal mortality sri lanka data sources for measuring maternal mortality_lo...
maternal mortality sri lanka data sources for measuring maternal mortality_lo...maternal mortality sri lanka data sources for measuring maternal mortality_lo...
maternal mortality sri lanka data sources for measuring maternal mortality_lo...
 
Mortality
MortalityMortality
Mortality
 
Maternal and Child Mortality in the United States
Maternal and Child Mortality in the United StatesMaternal and Child Mortality in the United States
Maternal and Child Mortality in the United States
 
OD by State 2010 - 2015
OD by State 2010 - 2015OD by State 2010 - 2015
OD by State 2010 - 2015
 
Epidemiological Survey of University of Science and Technology Port Harcourt,...
Epidemiological Survey of University of Science and Technology Port Harcourt,...Epidemiological Survey of University of Science and Technology Port Harcourt,...
Epidemiological Survey of University of Science and Technology Port Harcourt,...
 
Covid forecasting-03252020 4
Covid forecasting-03252020 4Covid forecasting-03252020 4
Covid forecasting-03252020 4
 
Risking our future
Risking our futureRisking our future
Risking our future
 

Viewers also liked

Daily grommet finalist interview
Daily grommet finalist interviewDaily grommet finalist interview
Daily grommet finalist interviewMITX
 
Gotuit Finalist Interview
Gotuit Finalist InterviewGotuit Finalist Interview
Gotuit Finalist InterviewMITX
 
Babc burgundy seminar_slide_share_2015
Babc burgundy seminar_slide_share_2015Babc burgundy seminar_slide_share_2015
Babc burgundy seminar_slide_share_2015DS Consulting
 
Cash star finalist interview
Cash star finalist interviewCash star finalist interview
Cash star finalist interviewMITX
 
Unica finalist interview
Unica finalist interviewUnica finalist interview
Unica finalist interviewMITX
 
Facebook Open Graph 6.10.10
Facebook Open Graph 6.10.10Facebook Open Graph 6.10.10
Facebook Open Graph 6.10.10MITX
 
Litl finalist interview
Litl finalist interviewLitl finalist interview
Litl finalist interviewMITX
 
Springpad finalist interview
Springpad finalist interviewSpringpad finalist interview
Springpad finalist interviewMITX
 
Enhanxit international business development
Enhanxit international business developmentEnhanxit international business development
Enhanxit international business developmentEnhanxit SL
 
Ramp finalist interview
Ramp finalist interviewRamp finalist interview
Ramp finalist interviewMITX
 
Curso Online eXeLearning. Diseño y Creación de Contenidos Didácticos Scorm, e...
Curso Online eXeLearning. Diseño y Creación de Contenidos Didácticos Scorm, e...Curso Online eXeLearning. Diseño y Creación de Contenidos Didácticos Scorm, e...
Curso Online eXeLearning. Diseño y Creación de Contenidos Didácticos Scorm, e...Ana Rosiris Castro Méndez
 
Document sur l'Auto provisioning, contacts, presence et streaming sur asterisk
Document sur l'Auto provisioning, contacts, presence et streaming sur asteriskDocument sur l'Auto provisioning, contacts, presence et streaming sur asterisk
Document sur l'Auto provisioning, contacts, presence et streaming sur asteriskEmeric Kamleu Noumi
 
Atelier t14 interface usager
Atelier t14 interface usagerAtelier t14 interface usager
Atelier t14 interface usagerguest2331fd
 
TFE. Conception et réalisation d'une application web mobile touristique. Marg...
TFE. Conception et réalisation d'une application web mobile touristique. Marg...TFE. Conception et réalisation d'une application web mobile touristique. Marg...
TFE. Conception et réalisation d'une application web mobile touristique. Marg...Jonathan Margrève
 
Faire de la croissance sans cash
Faire de la croissance sans cashFaire de la croissance sans cash
Faire de la croissance sans cashSebastien Chaillot
 
Comprendre les technologies LPWA (SIGFOX et LoRa)
Comprendre les technologies LPWA (SIGFOX et LoRa)Comprendre les technologies LPWA (SIGFOX et LoRa)
Comprendre les technologies LPWA (SIGFOX et LoRa)Robert Vivanco Salcedo
 

Viewers also liked (20)

Manual
ManualManual
Manual
 
Daily grommet finalist interview
Daily grommet finalist interviewDaily grommet finalist interview
Daily grommet finalist interview
 
Gotuit Finalist Interview
Gotuit Finalist InterviewGotuit Finalist Interview
Gotuit Finalist Interview
 
Babc burgundy seminar_slide_share_2015
Babc burgundy seminar_slide_share_2015Babc burgundy seminar_slide_share_2015
Babc burgundy seminar_slide_share_2015
 
45th Anniversary Slide Show
45th Anniversary Slide Show45th Anniversary Slide Show
45th Anniversary Slide Show
 
Cash star finalist interview
Cash star finalist interviewCash star finalist interview
Cash star finalist interview
 
Unica finalist interview
Unica finalist interviewUnica finalist interview
Unica finalist interview
 
Facebook Open Graph 6.10.10
Facebook Open Graph 6.10.10Facebook Open Graph 6.10.10
Facebook Open Graph 6.10.10
 
Litl finalist interview
Litl finalist interviewLitl finalist interview
Litl finalist interview
 
Springpad finalist interview
Springpad finalist interviewSpringpad finalist interview
Springpad finalist interview
 
Enhanxit international business development
Enhanxit international business developmentEnhanxit international business development
Enhanxit international business development
 
Ramp finalist interview
Ramp finalist interviewRamp finalist interview
Ramp finalist interview
 
Curso Online eXeLearning. Diseño y Creación de Contenidos Didácticos Scorm, e...
Curso Online eXeLearning. Diseño y Creación de Contenidos Didácticos Scorm, e...Curso Online eXeLearning. Diseño y Creación de Contenidos Didácticos Scorm, e...
Curso Online eXeLearning. Diseño y Creación de Contenidos Didácticos Scorm, e...
 
Document sur l'Auto provisioning, contacts, presence et streaming sur asterisk
Document sur l'Auto provisioning, contacts, presence et streaming sur asteriskDocument sur l'Auto provisioning, contacts, presence et streaming sur asterisk
Document sur l'Auto provisioning, contacts, presence et streaming sur asterisk
 
guide_e-learning
guide_e-learningguide_e-learning
guide_e-learning
 
Atelier t14 interface usager
Atelier t14 interface usagerAtelier t14 interface usager
Atelier t14 interface usager
 
TFE. Conception et réalisation d'une application web mobile touristique. Marg...
TFE. Conception et réalisation d'une application web mobile touristique. Marg...TFE. Conception et réalisation d'une application web mobile touristique. Marg...
TFE. Conception et réalisation d'une application web mobile touristique. Marg...
 
Keynotes Le Mobile 2013
Keynotes Le Mobile 2013Keynotes Le Mobile 2013
Keynotes Le Mobile 2013
 
Faire de la croissance sans cash
Faire de la croissance sans cashFaire de la croissance sans cash
Faire de la croissance sans cash
 
Comprendre les technologies LPWA (SIGFOX et LoRa)
Comprendre les technologies LPWA (SIGFOX et LoRa)Comprendre les technologies LPWA (SIGFOX et LoRa)
Comprendre les technologies LPWA (SIGFOX et LoRa)
 

Similar to Bodgbddeathdalyestimates

Deaths from Neurodegenerative Diseases in England, 2002 to 2008
Deaths from Neurodegenerative Diseases in England, 2002 to 2008Deaths from Neurodegenerative Diseases in England, 2002 to 2008
Deaths from Neurodegenerative Diseases in England, 2002 to 2008NHS IQ legacy organisations
 
Burden of cardiovascular diseases in Indians: Estimating trends of coronary a...
Burden of cardiovascular diseases in Indians: Estimating trends of coronary a...Burden of cardiovascular diseases in Indians: Estimating trends of coronary a...
Burden of cardiovascular diseases in Indians: Estimating trends of coronary a...Apollo Hospitals
 
24112015 icd10 tb_rr
24112015 icd10 tb_rr24112015 icd10 tb_rr
24112015 icd10 tb_rrRehab Rayan
 
Co d covid-19_guidance
Co d covid-19_guidanceCo d covid-19_guidance
Co d covid-19_guidancesabrangsabrang
 
Burden of cardiovascular diseases in Indians: Estimating trends of coronary a...
Burden of cardiovascular diseases in Indians: Estimating trends of coronary a...Burden of cardiovascular diseases in Indians: Estimating trends of coronary a...
Burden of cardiovascular diseases in Indians: Estimating trends of coronary a...Apollo Hospitals
 
Predictive analysis WHO's life expectancy dataset using Tableau data visualis...
Predictive analysis WHO's life expectancy dataset using Tableau data visualis...Predictive analysis WHO's life expectancy dataset using Tableau data visualis...
Predictive analysis WHO's life expectancy dataset using Tableau data visualis...Tarun Swarup
 
Regional Core Health Data Initiative
Regional Core Health Data InitiativeRegional Core Health Data Initiative
Regional Core Health Data InitiativePAHO_RHO
 
Roberta Crialesi, Alessandra Burgio, Francesco Grippo, Marilena Pappagallo -...
Roberta Crialesi,  Alessandra Burgio, Francesco Grippo, Marilena Pappagallo -...Roberta Crialesi,  Alessandra Burgio, Francesco Grippo, Marilena Pappagallo -...
Roberta Crialesi, Alessandra Burgio, Francesco Grippo, Marilena Pappagallo -...Istituto nazionale di statistica
 
Practical lesson №3 Cases Mortality.pptx
Practical lesson №3 Cases Mortality.pptxPractical lesson №3 Cases Mortality.pptx
Practical lesson №3 Cases Mortality.pptxKanishka478113
 
Donor Funding for Health
Donor Funding for HealthDonor Funding for Health
Donor Funding for HealthKFF
 
Icd 10 2nd-ed_volume2
Icd 10 2nd-ed_volume2Icd 10 2nd-ed_volume2
Icd 10 2nd-ed_volume2Sham Nhy
 
Measuring the Vital Events in the Communities of Africa
Measuring the Vital Events in the Communities of AfricaMeasuring the Vital Events in the Communities of Africa
Measuring the Vital Events in the Communities of AfricaMEASURE Evaluation
 
International classification of disease
International classification of diseaseInternational classification of disease
International classification of diseaseGAMANDEEP
 

Similar to Bodgbddeathdalyestimates (20)

Deaths from Neurodegenerative Diseases in England, 2002 to 2008
Deaths from Neurodegenerative Diseases in England, 2002 to 2008Deaths from Neurodegenerative Diseases in England, 2002 to 2008
Deaths from Neurodegenerative Diseases in England, 2002 to 2008
 
Global Burden of Disease - Pakistan Presentation
Global Burden of Disease - Pakistan PresentationGlobal Burden of Disease - Pakistan Presentation
Global Burden of Disease - Pakistan Presentation
 
Burden of cardiovascular diseases in Indians: Estimating trends of coronary a...
Burden of cardiovascular diseases in Indians: Estimating trends of coronary a...Burden of cardiovascular diseases in Indians: Estimating trends of coronary a...
Burden of cardiovascular diseases in Indians: Estimating trends of coronary a...
 
Causes of death
Causes of deathCauses of death
Causes of death
 
24112015 icd10 tb_rr
24112015 icd10 tb_rr24112015 icd10 tb_rr
24112015 icd10 tb_rr
 
Co d covid-19_guidance
Co d covid-19_guidanceCo d covid-19_guidance
Co d covid-19_guidance
 
Burden of cardiovascular diseases in Indians: Estimating trends of coronary a...
Burden of cardiovascular diseases in Indians: Estimating trends of coronary a...Burden of cardiovascular diseases in Indians: Estimating trends of coronary a...
Burden of cardiovascular diseases in Indians: Estimating trends of coronary a...
 
Predictive analysis WHO's life expectancy dataset using Tableau data visualis...
Predictive analysis WHO's life expectancy dataset using Tableau data visualis...Predictive analysis WHO's life expectancy dataset using Tableau data visualis...
Predictive analysis WHO's life expectancy dataset using Tableau data visualis...
 
Alcohol-related deaths have increased in recent years in U.S.
Alcohol-related deaths have increased in recent years in U.S.Alcohol-related deaths have increased in recent years in U.S.
Alcohol-related deaths have increased in recent years in U.S.
 
Regional Core Health Data Initiative
Regional Core Health Data InitiativeRegional Core Health Data Initiative
Regional Core Health Data Initiative
 
Roberta Crialesi, Alessandra Burgio, Francesco Grippo, Marilena Pappagallo -...
Roberta Crialesi,  Alessandra Burgio, Francesco Grippo, Marilena Pappagallo -...Roberta Crialesi,  Alessandra Burgio, Francesco Grippo, Marilena Pappagallo -...
Roberta Crialesi, Alessandra Burgio, Francesco Grippo, Marilena Pappagallo -...
 
Crialesi morbosità e mortalità
Crialesi  morbosità e mortalitàCrialesi  morbosità e mortalità
Crialesi morbosità e mortalità
 
Life exp. fas canada
Life exp. fas canadaLife exp. fas canada
Life exp. fas canada
 
Icd 10 volume-2
Icd 10 volume-2Icd 10 volume-2
Icd 10 volume-2
 
Practical lesson №3 Cases Mortality.pptx
Practical lesson №3 Cases Mortality.pptxPractical lesson №3 Cases Mortality.pptx
Practical lesson №3 Cases Mortality.pptx
 
Donor Funding for Health
Donor Funding for HealthDonor Funding for Health
Donor Funding for Health
 
Icd 10 2nd-ed_volume2
Icd 10 2nd-ed_volume2Icd 10 2nd-ed_volume2
Icd 10 2nd-ed_volume2
 
Icd 10 2nd-ed_volume2
Icd 10 2nd-ed_volume2Icd 10 2nd-ed_volume2
Icd 10 2nd-ed_volume2
 
Measuring the Vital Events in the Communities of Africa
Measuring the Vital Events in the Communities of AfricaMeasuring the Vital Events in the Communities of Africa
Measuring the Vital Events in the Communities of Africa
 
International classification of disease
International classification of diseaseInternational classification of disease
International classification of disease
 

Bodgbddeathdalyestimates

  • 1. World Health Organization Organisation Mondiale de la Santé Department of NOTES FOR TABLES Measurement and Health Information December 2004 (a) The figures in these table are generally consistent with the Annex Tables published in the World Health Report 2004. Further updates have been carried out for malaria and HIV/AIDS. Initial WHO estimates and technical explanations were sent to Member States for comment in 2003. Comments or data provided in response were discussed with them and incorporated where possible. The estimates reported here should, however, still be interpreted as the best estimates of WHO rather than the official viewpoint of Member States. Methods and data sources are summarized in the Statistical Annex Explanatory Notes of the World Health Report 2004 and in more detail in Discussion Paper 54 (www.who.int/evidence/bod) (b) Global Burden of Disease (GBD) cause categories are defined in Discussion Paper 54, Annex Table 3. Underlying causes of death as defined by the International Classification of Diseases (ICD) classification rules (www.who.int/classifications/icd) (c) The data sources and methods used for the estimation of total deaths (all causes) for each Member State are summarized into four levels of evidence. Further details of data sources and methods for each Member State are given in Discussion Paper 54 (www.who.int/evidence/bod). Level 1a Complete death registration data available for years 2001 and/or 2002. Level 1b Complete death registration data available for an earlier time period. All cause mortality projected to 2002. Level 2a Death registration data available for years 2001 and/or 2002. Completeness for latest year estimated using standard demographic methods for child deaths under age 5 and for deaths at ages 5 and over. Estimated completeness used to adjust death registration data. Level 2b Death registration data available for available for an earlier time period. Completeness for latest year estimated using standard demographic methods for child deaths under age 5 and for deaths at ages 5 and over. Estimated completeness used to adjust death registration data and then all cause mortality was projected to 2002. Level 3a Country information for years 2001 and/or 2002 available on levels of child mortality (between ages 0 and 5) and adult mortality (between ages 15 and 60). WHO modified logit life table system used with global standard to estimate all cause mortality. Level 3b Country information available for an earlier time period on levels of child mortality (between ages 0 and 5) and adult mortality (between ages 15 and 60). Child and adult mortality levels were projected to 2002 and the WHO modified logit life table system used with global standard to estimate all cause mortality. Level 4a Country information for years 2001 and/or 2002 available on level of child mortality (between ages 0 and 5) only. Levels of adult mortality excluding HIV/AIDS and war deaths predicted from child mortality. HIV/AIDS and war deaths added separately and WHO modified logit life table system used with global standard to estimate all cause mortality. Level 4b Country information prior to 2001 available on level of child mortality (between ages 0 and 5) only. Levels of adult mortality excluding HIV/AIDS and war deaths predicted from projected 2002 HIV/AIDS-free child mortality. HIV/AIDS and war deaths added separately and WHO modified logit life table system used with global standard to estimate all cause mortality.
  • 2. (d) The data sources and methods used for the estimation of deaths by cause for each Member State are summarized into four levels of evidence. Additional information for estimating country-level deaths due to certain specific causes were obtained from studies, WHO technical Programmes and UNAids for the following conditions: AIDS, tuberculosis, measles, pertussis, poliomyelitis, tetanus, acute lower respiratory infections, Chagas, maternal conditions, perinatal conditions, cancers, drug use disorders, rhumathoid arthritis and war. Further details of data sources and methods for each Member State are given in Discussion Paper 54 (www.who.int/evidence/bod). Level 1a Complete death registration data with cause of death coded using ICD-9 or ICD-10 available for years 2001 and/or 2002. Less than 10% of deaths coded to ICD codes for “symptoms, signs, and ill-defined conditions”, injuries where the intent is not determined; cardiovascular "garbage" codes, and cancer deaths coded to categories for secondary or unspecified sites. Level 1b Complete death registration data available . Complete death registration data with cause of death coded using ICD-9 or ICD-10 available for for an earlier time period. Less than 10% of deaths coded to ICD codes for “symptoms, signs, and ill-defined conditions”, injuries where the intent is not determined; and cardiovascular and cancer "garbage" codes. Level 2a Death registration data available for years 2001 and/or 2002. Adjustments to cause of death distribution required for incomplete registration and/or for use of non-ICD-9 or ICD-10 coding and/or for the more than 10% of deaths coded to ill-defined conditions, and cardiovascular, cancer and injury "garbage" codes. Level 2b Death registration data available for latest year earlier than 2001. Adjustments to cause of death distribution required for incomplete registration and/or for use of non- ICD-9 or ICD-10 coding and/or for the more than 10% of deaths coded to ill-defined conditions, and cardiovascula, cancer and injury "garbage" codes. Level 3 Country information on causes of death available based on verbal autopsy methods. Level 4. Country information on causes of death not available for most causes. Cause of death modelling used to estimate broad distribution of causes of death for Groups I, II and III by age and sex for the country level of all cause mortality and per capita income. Cause of death patterns within the three major cause groups based on death registration data from other countries in the region. Further country-level information and data on specific causes listed above was also used. (e) UN estimates of de-facto population (2002 Revision). Estimated death rates by age, sex for underlying causes of death as defined by the ICD classification rules, are applied to the UN estimates of de-facto resident population for 2002 to give numbers of expected deaths by cause for each Member State. (f) Estimated 95% uncertainty ranges for the expected number of total deaths for 2002. Uncertainty in population estimates is not included and the uncertainty ranges relate to underlying death rates estimated in the life table for each Member State not to the realized numbers of deaths actually occurring in 2002. Methods for estimating life table uncertainty are summarized in the Statistical Annex Explanatory Notes of the World Health Report 2004 and in more detail in Discussion Paper 10 (www.who.int/evidence). In countries with a substantial HIV epidemic or a war, estimates of the level and uncertainty range of the magnitude of the HIV epidemic or of war deaths were incorporated into the life table uncertainty analysis. (g) Does not include liver cancer and cirrhosis deaths or DALYs resulting from chronic hepatitis virus infection. (h) This cause category includes 'Causes arising in the perinatal period' as defined in the International Classification of Diseases, principally low birthweight, prematurity, birth asphyxia and birth trauma, and does not include all causes occurring in the perinatal period. (i) Standard DALYs with age-weighting and time discounting as reported in World Health Report 2004 (see second box below). (j) The data sources and methods used for the estimation of the YLL (premature mortality) component of DALYs are summarized as described in notes (c) and (d). YLD estimates by cause for Member States are based on the GBD analyses of incidence, prevalence, duration and severity of conditions for the relevant epidemiological subregion, together with country-level and subregional mortality differentials, and other national and subnational level information available to WHO. Two levels of evidence are distinguished as listed below. Further details of data sources and methods for each Member State are given in Discussion Paper 54 (www.who.int/evidence/bod). Level 3 Country data on causes of death (Levels 1 to 3) used to adjust regional YLD distributions for causes with significant case fatality. Partial country-specific information on incidence or prevalence of non-fatal causes available.
  • 3. Level 4. Level 4 information on causes of death and regional estimates of YLD used for most causes. Partial country-specific information on incidence or prevalence of some non-fatal causes available. (j) Cause-specific death rates were age-standardized to the WHO global standard population (see Discussion Paper 31, www.who.int/evidence). Age-standardized death rates are calculated by applying age-specific death rates for the Member State to a global standard population. Comparison of cause-specific mortality risks across countries is facilitated by the use of age-standardized death rates to adjust for differences in population age distributions. MORTALITY AND BURDEN OF DISEASE ESTIMATES FOR WHO MEMBER STATES IN 2002 This workbook contains WHO estimates of mortality and burden of disease for WHO Member States for the year 2002. These estimates are based on version 3 of the Global Burden of Disease (GBD) study (1) as published in the World Health Report 2004 (2), with some additional adjustments for later revisions in HIV/AIDS mortality and burden (3) and draft revisions for malaria, schistosomiasis and intestinal helminth infections. Mortality estimates are based on analysis of latest available national information on levels of mortality and cause distributions as at late 2003. YLD estimates are based on the GBD analyses of incidence, prevalence, duration and severity of conditions for the relevant epidemiological subregion, together with national and subnational level information available to WHO (1). The GBD uses the latest population estimates for WHO Member States prepared by the UN Population Division (4). These summary tables represent the best estimates of WHO, based on the evidence available to it in mid-2004, rather than the official estimates of Member States. They have been computed using standard categories and methods to ensure cross-national comparability and may not be the same as official national estimateis produced using alternate, potentially equally rigorous methods. Data and methods used for estimating mortality and burden of disease for WHO Member states, and for quantifying uncertainty, are also summarized in a Working Paper (5). The work leading to these prior estimates of national burden of disease was undertaken by the WHO Evidence and Information for Policy cluster in collaboration with WHO technical programmes and with scientists worldwide. Documentation and GBD 2000 summary tables are available on the WHO website (http://www.who.int/evidence/bod), together with software tools and a National Burden of Disease Manual providing guidelines for conducting an NBD study (6). References 1. Mathers CD, Bernard C, Iburg K, Inoue M, Ma Fat D, Shibuya K, Stein C, Tomijima, N (2003). The Global Burden of Disease in 2002: data sources, methods and results. Geneva, World Health Organization (GPE Discussion Paper No. 54). Available at http://www.who.int/evidence 2. World Health Organization. World Health Report 2004: changing history. Available at http://www.who.int/whr 3. UNAIDS. 2004 report on the global AIDS epidemic. 4th global report. Geneva: UNAIDS, 2004. Available at http://www.unaids.org 4. United Nations Population Division. World Population Prospects - the 2002 revision. New York: United Nations, 2003. 5. Mathers CD (2005). Uncertainty and data availability for the global burden of disease estimates 2000-2002. Evidence and Information for Policy Working Paper. Geneva, World Health Organization. Available at http://www.who.int/evidence/bod 6. Mathers CD, Vos T, Lopez AD, Ezzati M. National Burden of Disease Studies: A Practical Guide. Edition 1.1. 2001. Geneva, World Health Organization, Global Program on Evidence for Health Policy. Available at http://www.who.int/evidence/nbd DISABILITY ADJUSTED LIFE YEARS The Disability Adjusted Life Year or DALY is a health gap measure that extends the concept of potential years of life lost due to premature death (PYLL) to include equivalent years of ‘healthy’ life lost by virtue of being in states of poor health or disability (1). The DALY combines in one measure the time lived with disability and the time lost due to premature mortality. One DALY can be thought of as one lost year of ‘healthy’ life and the burden of disease as a measurement of the gap between current health status and an ideal situation where everyone lives into old age free of disease and disability.
  • 4. DALYs for a disease or health condition are calculated as the sum of the years of life lost due to premature mortality (YLL) in the population and the years lost due to disability (YLD) for incident cases of the health condition: The years of life lost (YLL) basically correspond to the number of deaths multiplied by the standard life expectancy at the age at which death occurs. The basic formula for YLL (without yet including other social preferences discussed below), is the following for a given cause, age and sex: YLL = N x L where: N = number of deaths L = standard life expectancy at age of death in years Because YLL measure the incident stream of lost years of life due to deaths, an incidence perspective is also taken for the calculation of YLD. To estimate YLD for a particular cause in a particular time period, the number of incident cases in that period is multiplied by the average duration of the disease and a weight factor that reflects the severity of the disease on a scale from 0 (perfect health) to 1 (dead). The basic formula for YLD is the following (again, without applying social preferences): YLD = I x DW x L where: I = number of incident cases DW = disability weight L = average duration of the case until remission or death (years) Egalitarian principles were explicitly built into the DALY, and the Global Burden of Disease Study used the same values for all regions of the world (2) . It used the same life expectancy ‘ideal’ standard for all population subgroups and it excluded all non-health characteristics (such as race, socioeconomic status or occupation) apart from age and sex from consideration in calculating lost years of healthy life. Most importantly, it used the same ‘disability weight’ for everyone living a year in a specified health state. Additionally, 3% time discounting and non-uniform age weights which give less weight to years lived at young and older ages were used in calculating DALYs for the original Global Burden of Disease study. These value choices have continued to be used for the Global Burden of Disease 2000 study results reported in recent World Health Reports and in these tables. With non-uniform age weights and 3% discounting, a death in infancy corresponds to 33 DALYs, and deaths at ages 5 to 20 to around 36 DALYs. Thus a disease burden of 3,300 DALYs in a population would be the equivalent of 100 infant deaths or to approximately 5,500 persons aged 50 years living one year with blindness (disability weight 0.6). References 1. Murray CJL, Salomon JA, Mathers CD, Lopez AD (eds.) (2002). Summary measures of population health: concepts, ethics, measurement and applications. WHO, Geneva. Available at http://www.who.int/pub/smph/en/index.html 2. Murray CJL, Lopez AD (1996). The Global Burden of Disease. Cambridge: Harvard University Press.
  • 5. World Health Organization Organisation Mondiale de la Santé Department of COLOUR CODES FOR LEVELS OF EVIDENCE Measurement and Health Information December 2004 Columns containing estimates of deaths or DALYs for WHO Member States in 2002 are colour-coded in the following sheets to summarize the levels of evidence and uncertainty. Four levels of evidence for all cause mortality, cause-specific mortality, and DALYs are defined in the Notes sheet. Three colour codes are used to denote the following levels: Total Causes of mortality death YLD Level 1 Level 1 Level 3 Death registration data, complete or incomplete, containing useable information on causes of death is available for the country, and or Level 2 or Level 2 used to adjust regional YLD distributions for causes with significant case fatality. Partial country-specific information on incidence or prevalence of non-fatal causes available. Total mortality or causes of death Other forms of information on child and adult mortality or causes of death (eg. verbal autopsy) available. Country-specific information on have level 3 evidence, neither is mortality for specific causes available.Partial country-specific information on incidence or prevalence of non-fatal causes available. level 4. Level 4 OR Level 4 Level 4 Country information on level of adult mortality not available and it was predicted from child mortality level OR cause of death information for most causes not available, and cause pattern predicted using cause-of-death models. Partial country-specific information on incidence or prevalence of non-fatal causes available. Note that levels of evidence will vary for specific causes within a country, and the above colour coded scheme does not attempt to provide that level of detail for most causes. For tuberculosis, HIV/AIDS, CHagas disease and maternal mortality, specific colour codes have been used to provide an indication of when country-level data were used for those causes, for countries where the general level of evidence is level 4 (pink). Estimated 95% uncertainty ranges for the expected number of total deaths for 2002 are given for each country in the 'Deaths 2002' sheet and provide some indication of the level of uncertainty for estimates in that country. Cause-specific estimates will generally have even greater relative uncertainty ranges, as will DALY estimates, with the possible exception of some causes such as HIV/AIDS where separate country-specific analyses have been used. For more details on data source, methods and uncertainty refer to the GBD working papers referenced below. References 1. Mathers CD, Bernard C, Iburg K, Inoue M, Ma Fat D, Shibuya K, Stein C, Tomijima, N (2003). The Global Burden of Disease in 2002: data sources, methods and results. Geneva, World Health Organization (GPE Discussion Paper No. 54). Available at http://www.who.int/evidence 2. Mathers CD (2005). Uncertainty and data availability for the global burden of disease estimates 2000-2002. Evidence and Information for Policy Working Paper. Geneva, World Health Organization. Available at http://www.who.int/evidence/bod
  • 6. GBD Antigua and code GBD cause (b) Afghanistan Albania Algeria Andorra Angola Barbuda Argentina Armenia Australia Data sources - level of evidence All cause mortality (c) Level 4b Level 2b Level 3b Level 3b Level 4b Level 3b Level 1a Level 2a Level 1a Cause-specific mortality (d) Level 4 Level 2b Level 4 Level 4 Level 4 Level 2b Level 2a Level 2a Level 2b Population ('000) (e) 22,930 3,141 31,266 69 13,184 73 37,981 3,072 19,544 W000 All Causes 484.5 22.1 173.3 0.6 306.6 0.6 281.4 26.1 126.6 Lower uncertainty bound (f) 347.6 19.3 158.0 0.5 255.3 0.5 276.6 23.6 124.1 Upper uncertainty bound (f) 695.8 28.0 188.4 0.6 434.8 0.6 286.6 33.8 128.8 W001 I. Communicable, maternal, perinatal and 317.2 1.8 56.9 0.0 230.3 0.1 36.2 1.3 5.5 W002 nutritional conditions A. Infectious and parasitic diseases 169.3 0.2 30.2 0.0 143.0 0.0 15.6 0.5 1.8 W003 1. Tuberculosis 21.1 0.0 0.6 0.0 4.8 - 0.8 0.2 0.1 W004 2. STDs excluding HIV 0.3 0.0 2.1 0.0 2.3 0.0 0.0 0.0 0.0 W005 a. Syphilis 0.1 0.0 2.0 0.0 2.3 0.0 0.0 0.0 0.0 W006 b. Chlamydia 0.1 - 0.0 - 0.0 - - - - W007 c. Gonorrhoea 0.0 - 0.0 - 0.0 - - 0.0 - W009 3. HIV/AIDS 0.0 0.0 0.3 0.0 21.1 0.0 1.8 0.2 0.1 W010 4. Diarrhoeal diseases 41.2 0.0 8.1 0.0 48.8 0.0 0.4 0.1 0.0 W011 5. Childhood-cluster diseases 15.5 0.0 4.1 0.0 12.4 0.0 0.0 0.0 0.0 W012 a. Pertussis 6.6 - 0.6 - 4.2 - 0.0 0.0 0.0 W013 b. Poliomyelitis 0.0 - - 0.0 - - - - 0.0 W014 c. Diphtheria 0.0 - 0.0 - 0.1 - - 0.0 - W015 d. Measles 2.2 - 3.4 - 6.2 - - 0.0 - W016 e. Tetanus 6.7 0.0 0.0 0.0 1.9 0.0 0.0 0.0 0.0 W017 6. Meningitis 8.3 0.0 0.2 0.0 0.6 0.0 0.4 0.0 0.1 W018 7. Hepatitis B (g) 1.0 0.0 0.5 0.0 0.8 0.0 0.1 0.0 0.0 W019 Hepatitis C (g) 0.5 0.0 0.2 0.0 0.4 0.0 0.1 0.0 0.0 W020 8. Malaria 0.9 - 0.0 0.0 17.9 - - 0.0 0.0 W021 9. Tropical-cluster diseases 0.4 0.0 1.0 0.0 3.1 - 0.7 - - W022 a. Trypanosomiasis 0.0 - 0.7 - 1.3 - - - - W023 b. Chagas disease - - - - - - 0.7 - - W024 c. Schistosomiasis 0.0 - 0.1 - 1.5 - - - - W025 d. Leishmaniasis 0.4 0.0 0.2 0.0 0.2 - 0.0 - - W026 e. lymphatic filariasis 0.0 - - - - - - - - W027 f. Onchocerciasis - - - - - - - - - W028 10. Leprosy 0.0 - 0.1 0.0 0.0 - 0.0 - - W029 11. Dengue 0.0 - 0.0 - 0.0 - - - 0.0 W030 12. Japanese encephalitis - - - - - - - - - W031 13. Trachoma - - - - - - - - - W032 14. Intestinal nematode infections 0.0 0.0 0.1 - 0.1 - 0.0 - 0.0 W033 a. Ascariasis 0.0 - 0.0 - 0.0 - - - - W034 b. Trichuriasis - - 0.0 - 0.0 - - - - W035 c. Hookworm disease 0.0 - 0.1 - 0.0 - - - - W038 B. Respiratory infections 56.7 1.0 14.1 0.0 47.8 0.0 12.6 0.3 2.8 W039 1. Lower respiratory infections 55.9 1.0 13.8 0.0 47.0 0.0 12.6 0.3 2.8 W040 2. Upper respiratory infections 0.8 0.0 0.3 0.0 0.8 - 0.0 0.0 0.0 W041 3. Otitis media 0.0 - 0.0 0.0 0.1 - - 0.0 0.0 W042 C. Maternal conditions 18.8 0.0 1.0 0.0 11.3 0.0 0.3 0.0 0.0 W049 D. Perinatal conditions (h) 62.0 0.5 10.6 0.0 19.0 0.0 5.9 0.5 0.7 W050 1. Low birth weight 34.2 0.1 4.6 0.0 8.2 0.0 1.6 0.2 0.0 W051 2. Birth asphyxia and birth trauma 17.2 0.2 4.4 0.0 7.8 0.0 2.7 0.1 0.2 W053 E. Nutritional deficiencies 10.4 0.1 1.0 0.0 9.1 0.0 1.9 0.0 0.2 W054 1. Protein-energy malnutrition 7.3 0.0 0.5 0.0 8.2 0.0 1.4 0.0 0.1 W055 2. Iodine deficiency 0.2 - 0.0 - 0.0 - - - - W056 3. Vitamin A deficiency 0.0 0.0 0.2 - 0.6 - - - - W057 4. Iron-deficiency anaemia 1.3 0.0 0.3 0.0 0.3 0.0 0.4 0.0 0.1 W059 II. Noncommunicable diseases 140.6 18.3 93.9 0.5 51.1 0.5 225.1 23.6 113.1 W060 A. Malignant neoplasms 18.9 3.9 16.9 0.2 9.2 0.1 59.9 4.7 36.5 W061 1. Mouth and oropharynx cancers 2.3 0.1 0.8 0.0 1.0 0.0 1.0 0.1 0.7 W062 2. Oesophagus cancer 2.3 0.1 0.2 0.0 0.5 0.0 2.5 0.1 1.1 W063 3. Stomach cancer 1.2 0.6 1.4 0.0 1.4 0.0 3.4 0.5 1.3 W064 4. Colon and rectum cancers 1.0 0.1 1.3 0.0 0.3 0.0 7.4 0.4 5.3 W065 5. Liver cancer 0.6 0.6 0.2 0.0 0.5 - 1.9 0.3 0.8 W066 6. Pancreas cancer 0.2 0.1 0.4 0.0 0.1 0.0 3.6 0.2 1.8 W067 7. Trachea, bronchus, lung cancers 1.3 0.9 2.3 0.0 0.4 0.0 8.8 1.0 7.0 W068 8. Melanoma and other skin cancers 0.1 0.1 0.1 0.0 0.3 - 0.9 0.1 1.5 W069 9. Breast cancer 2.0 0.2 1.7 0.0 0.9 0.0 6.0 0.5 2.7 W070 10. Cervix uteri cancer 0.3 0.0 1.0 0.0 0.9 0.0 1.1 0.1 0.3 W071 11. Corpus uteri cancer 0.1 0.1 0.1 0.0 0.1 0.0 1.9 0.1 0.3 W072 12. Ovary cancer 0.4 0.0 0.4 0.0 0.2 0.0 1.2 0.1 0.8 W073 13. Prostate cancer 0.3 0.2 0.7 0.0 0.6 0.0 4.4 0.1 3.0 W074 14. Bladder cancer 0.7 - 1.4 0.0 0.3 0.0 1.5 0.1 0.9 W075 15. Lymphomas, multiple myeloma 1.9 0.1 1.3 0.0 0.6 0.0 2.6 0.1 2.7 W076 16. Leukaemia 1.3 0.2 0.4 0.0 0.2 0.0 2.2 0.2 1.5 W078 B. Other neoplasms 2.1 0.3 0.3 0.0 0.2 0.0 2.4 0.0 0.8 W079 C. Diabetes mellitus 2.7 0.2 3.0 0.0 1.6 0.0 9.6 1.6 3.2 W080 D. Endocrine disorders 3.3 0.1 0.8 0.0 0.7 0.0 2.8 0.1 1.4 W081 E. Neuropsychiatric conditions 8.8 0.6 2.7 0.0 2.4 0.0 5.7 0.3 7.4 W082 1. Unipolar depressive disorders 0.0 0.0 - 0.0 - - 0.0 0.0 0.1 W083 2. Bipolar disorder - - - 0.0 - - - 0.0 0.0 W084 3. Schizophrenia 0.0 0.0 - 0.0 - - 0.0 0.0 0.0 W085 4. Epilepsy 0.8 0.1 1.1 0.0 1.1 0.0 0.3 0.1 0.3 W086 5. Alcohol use disorders 0.1 0.0 0.2 0.0 0.2 0.0 0.7 0.0 0.3 W087 6. Alzheimer and other dementias* 0.1 0.0 0.3 0.0 0.1 0.0 2.2 0.1 4.0 W088 7. Parkinson disease 0.0 0.0 0.3 0.0 0.1 - 0.6 0.0 0.9 W089 8. Multiple sclerosis 0.0 0.0 0.0 0.0 0.0 0.0 0.1 0.0 0.1 W090 9. Drug use disorders 5.2 0.0 0.1 0.0 0.0 0.0 0.2 0.0 0.5 W091 10. Post-traumatic stress disorder - 0.0 - - - - - 0.0 - W092 11. Obsessive-compulsive disorder - - - - - - - - - W093 12. Panic disorder - - - - - - - - - W094 13. Insomnia (primary) - - - - - - - - - W095 14. Migraine - - - - - - - - - W098 F. Sense organ diseases 0.1 0.0 - 0.0 - - - - 0.0 W099 1. Glaucoma - - - 0.0 - - - - - W100 2. Cataracts - - - - - - - - - W101 3. Vision disorders, age-related - - - - - - - - - W102 4. Hearing loss, adult onset - - - - - - - - - W104 G. Cardiovascular diseases 67.6 11.5 46.9 0.2 22.0 0.2 93.3 14.2 47.2 W105 1. Rheumatic heart disease 1.9 0.0 0.8 0.0 0.6 - 0.2 0.2 0.2 W106 2. Hypertensive heart disease 7.5 0.4 2.5 0.0 1.2 0.0 4.5 0.5 1.1 W107 3. Ischaemic heart disease 33.2 4.0 14.9 0.1 7.1 0.1 34.3 8.5 25.5 W108 4. Cerebrovascular disease 11.5 4.2 16.2 0.1 7.6 0.1 22.7 4.2 11.7 05/18/2010 + ^
  • 7. W109 5. Inflammatory heart diseases 2.3 0.1 1.6 0.0 1.1 0.0 3.1 0.6 1.0 W111 H. Respiratory diseases 8.6 0.7 10.9 0.0 6.1 0.0 27.7 1.1 7.7 W112 1. Chronic obstructive pulmonary disease 3.3 0.3 5.0 0.0 2.3 0.0 5.1 0.8 5.2 W113 2. Asthma 2.3 0.3 0.6 0.0 0.3 0.0 0.8 0.1 0.4 W115 I. Digestive diseases 12.4 0.5 6.0 0.0 4.0 0.0 11.9 1.0 4.2 W116 1. Peptic ulcer disease 0.4 0.0 0.6 0.0 0.4 0.0 0.4 0.2 0.5 W117 2. Cirrhosis of the liver 5.5 - 2.1 0.0 1.4 0.0 2.6 0.5 0.9 W118 3. Appendicitis 0.0 0.0 0.0 0.0 0.0 0.0 0.1 0.0 0.0 W120 J. Genitourinary diseases 7.0 0.4 3.6 0.0 2.7 0.0 7.5 0.4 2.8 W121 1. Nephritis and nephrosis 6.3 0.4 3.3 0.0 2.5 0.0 6.4 0.2 2.1 W122 2. Benign prostatic hypertrophy 0.1 0.0 0.1 0.0 0.0 - 0.0 0.1 0.0 W124 K. Skin diseases 0.2 0.0 2.0 0.0 0.0 0.0 0.6 0.0 0.3 W125 L. Musculoskeletal diseases 0.2 0.0 0.1 0.0 0.3 0.0 0.6 0.1 0.9 W126 1. Rheumatoid arthritis 0.0 0.0 0.0 0.0 0.0 - 0.1 0.0 0.2 W127 2. Osteoarthritis 0.0 0.0 - 0.0 - - 0.0 0.0 0.1 W131 M. Congenital anomalies 8.6 0.1 0.7 0.0 1.8 0.0 3.1 0.2 0.6 W143 N. Oral conditions 0.0 0.0 - 0.0 - - - - 0.0 W144 1. Dental caries - - - - - - - - - W145 2. Periodontal disease - - - - - - - - - W146 3. Edentulism - - - - - - - - - W148 III.Injuries 26.8 2.0 22.5 0.0 25.2 0.0 20.1 1.2 8.0 W149 A. Unintentional injuries 18.2 1.7 12.9 0.0 17.2 0.0 12.8 1.0 5.5 W150 1. Road traffic accidents 8.4 0.1 5.4 0.0 7.6 0.0 4.4 0.3 1.7 W151 2. Poisonings 1.0 0.0 1.0 0.0 1.2 0.0 0.2 0.1 0.8 W152 3. Falls 1.3 0.0 0.8 0.0 0.7 - 0.4 0.0 0.6 W153 4. Fires 1.2 0.0 1.2 0.0 1.5 0.0 0.5 0.0 0.1 W154 5. Drownings 2.4 0.0 1.2 0.0 2.4 0.0 1.0 0.1 0.2 W155 6. Other unintentional injuries 3.9 1.5 3.4 0.0 3.8 0.0 6.4 0.4 2.0 W156 B. Intentional injuries 8.6 0.3 9.7 0.0 7.9 0.0 7.3 0.2 2.5 W157 1. Self-inflicted injuries 1.5 0.1 0.9 0.0 1.1 0.0 3.9 0.1 2.2 W158 2. Violence 0.9 0.2 3.7 0.0 5.2 0.0 3.3 0.1 0.3 W159 3. War 5.9 0.0 5.0 - 1.7 - - 0.0 - Refer to Notes sheet for notes on this table. 05/18/2010 + ^
  • 8. All cause mortality (c) Level 4b Level 2b Level 3b Level 3b Level 4b Level 3b Level 1a Level 2a Level 1a Cause-specific mortality (d) Level 4 Level 2b Level 4 Level 4 Level 4 Level 2b Level 2a Level 2a Level 2b Incidence, prevalence, severity, duration (j) Level 4 Level 3 Level 4 Level 4 Level 4 Level 3 Level 3 Level 3 Level 3 Population ('000) (e) 22,930 3,141 31,266 69 13,184 73 37,981 3,072 19,544 W000 All Causes 17,011 503 5,500 9 10,757 13 6,293 516 2,154 W001 I. Communicable, maternal, perinatal and 11,708 70 2,064 0 8,174 2 784 64 110 W002 nutritional conditions A. Infectious and parasitic diseases 5,814 10 1,049 0 4,888 1 342 21 35 W003 1. Tuberculosis 523 1 20 0 133 0 18 5 1 W004 2. STDs excluding HIV 52 2 135 0 99 0 37 3 4 W005 a. Syphilis 3 0 44 0 61 0 4 0 0 W006 b. Chlamydia 22 1 39 0 15 0 19 2 3 W007 c. Gonorrhoea 26 1 51 0 22 0 14 1 1 W009 3. HIV/AIDS 0 0 9 0 641 0 64 5 4 W010 4. Diarrhoeal diseases 1,343 1 295 0 1,608 0 49 4 5 W011 5. Childhood-cluster diseases 585 1 155 0 473 0 12 1 5 W012 a. Pertussis 282 1 32 0 191 0 11 0 5 W013 b. Poliomyelitis 1 - 1 0 0 0 0 0 0 W014 c. Diphtheria 0 - 0 - 2 0 0 0 - W015 d. Measles 80 0 121 - 216 0 0 0 - W016 e. Tetanus 223 0 1 0 64 0 0 0 0 W017 6. Meningitis 459 1 5 0 29 0 14 1 3 W018 7. Hepatitis B (g) 26 0 8 0 24 0 1 0 0 W019 Hepatitis C (g) 13 0 3 0 11 0 1 0 0 W020 8. Malaria 64 - 0 0 681 - 0 1 0 W021 9. Tropical-cluster diseases 17 0 106 0 146 0 37 0 - W022 a. Trypanosomiasis 0 - 24 - 41 - - - - W023 b. Chagas disease - - - - - 0 35 - - W024 c. Schistosomiasis 0 - 66 - 48 0 - - - W025 d. Leishmaniasis 17 0 16 0 11 0 2 0 - W026 e. lymphatic filariasis 0 - - - 45 - - - - W027 f. Onchocerciasis - - - - 2 - - - - W028 10. Leprosy 1 0 1 0 1 0 1 - 0 W029 11. Dengue 0 - 0 - 0 - - - 0 W030 12. Japanese encephalitis 1 - - - - - - - - W031 13. Trachoma 5 - - - 4 - - - 0 W032 14. Intestinal nematode infections 13 0 76 - 40 0 6 0 0 W033 a. Ascariasis 6 - 58 - 32 0 1 0 - W034 b. Trichuriasis 5 - 6 - 3 0 3 - - W035 c. Hookworm disease 2 - 12 - 5 0 1 0 - W038 B. Respiratory infections 2,067 20 315 0 1,634 0 96 8 13 W039 1. Lower respiratory infections 2,031 19 303 0 1,599 0 87 7 10 W040 2. Upper respiratory infections 28 0 4 0 28 0 2 0 1 W041 3. Otitis media 8 0 8 0 7 0 8 1 2 W042 C. Maternal conditions 942 5 145 0 499 0 53 4 9 W049 D. Perinatal conditions (h) 2,383 22 408 0 735 1 247 20 40 W050 1. Low birth weight 1,275 5 163 0 294 0 59 8 9 W051 2. Birth asphyxia and birth trauma 736 7 186 0 335 0 130 9 13 W053 E. Nutritional deficiencies 502 14 147 0 418 0 46 10 14 W054 1. Protein-energy malnutrition 338 2 50 0 345 0 28 1 0 W055 2. Iodine deficiency 13 9 12 - 8 - 1 0 - W056 3. Vitamin A deficiency 1 0 3 - 22 - - 0 - W057 4. Iron-deficiency anaemia 94 2 82 0 43 0 16 9 13 W059 II. Noncommunicable diseases 4,103 345 2,522 7 1,495 10 4,774 410 1,834 W060 A. Malignant neoplasms 353 45 174 1 117 1 565 57 306 W061 1. Mouth and oropharynx cancers 39 1 10 0 9 0 11 1 7 W062 2. Oesophagus cancer 35 0 2 0 5 0 19 0 8 W063 3. Stomach cancer 21 6 13 0 16 0 29 5 9 W064 4. Colon and rectum cancers 19 2 13 0 4 0 56 4 46 W065 5. Liver cancer 10 5 1 0 7 - 15 3 6 W066 6. Pancreas cancer 3 1 4 0 2 0 28 2 12 W067 7. Trachea, bronchus, lung cancers 17 9 20 0 5 0 81 10 52 W068 8. Melanoma and other skin cancers 2 1 1 0 3 0 8 1 13 W069 9. Breast cancer 38 4 22 0 10 0 63 7 34 W070 10. Cervix uteri cancer 5 1 13 0 11 0 19 2 4 W071 11. Corpus uteri cancer 2 2 1 0 1 0 30 3 4 W072 12. Ovary cancer 9 0 4 0 3 0 13 2 8 W073 13. Prostate cancer 2 2 4 0 3 0 23 1 18 W074 14. Bladder cancer 7 - 9 0 3 0 11 1 6 W075 15. Lymphomas, multiple myeloma 48 1 18 0 12 0 28 3 21 W076 16. Leukaemia 40 3 7 0 3 0 30 3 13 W078 B. Other neoplasms 41 4 4 0 5 0 25 0 4 W079 C. Diabetes mellitus 49 5 49 0 21 0 146 19 46 W080 D. Endocrine disorders 76 5 30 0 38 1 80 6 44 W081 E. Neuropsychiatric conditions 851 99 737 2 353 3 1,731 91 599 W082 1. Unipolar depressive disorders 288 37 227 1 81 1 457 38 187 W083 2. Bipolar disorder 52 7 88 0 32 0 82 7 32 W084 3. Schizophrenia 61 8 87 0 31 0 98 9 32 W085 4. Epilepsy 42 5 46 0 39 0 55 3 11 W086 5. Alcohol use disorders 3 5 6 0 16 1 462 3 72 W087 6. Alzheimer and other dementias* 12 4 18 0 7 0 90 6 81 W088 7. Parkinson disease 9 2 4 0 1 0 6 1 16 W089 8. Multiple sclerosis 5 1 6 0 2 0 9 1 5 W090 9. Drug use disorders 142 3 24 0 8 0 94 1 47 W091 10. Post-traumatic stress disorder 12 2 17 0 6 0 17 2 11 W092 11. Obsessive-compulsive disorder 14 4 41 0 16 0 45 4 8 W093 12. Panic disorder 26 3 39 0 14 0 40 3 17 W094 13. Insomnia (primary) 14 2 17 0 6 0 28 1 16 W095 14. Migraine 34 4 19 0 8 0 57 3 22 W098 F. Sense organ diseases 223 18 524 0 169 1 395 32 79 W099 1. Glaucoma 2 1 55 0 18 0 24 2 1 W100 2. Cataracts 106 2 302 0 98 0 127 3 1 W101 3. Vision disorders, age-related 17 6 53 0 17 0 123 12 12 W102 4. Hearing loss, adult onset 98 9 114 0 36 0 121 16 64 W104 G. Cardiovascular diseases 1,149 98 394 1 271 2 687 115 268 W105 1. Rheumatic heart disease 59 1 17 0 17 0 3 2 2 W106 2. Hypertensive heart disease 98 3 21 0 13 0 30 4 6 W107 3. Ischaemic heart disease 469 36 116 0 74 0 244 65 134 W108 4. Cerebrovascular disease 208 33 139 0 89 1 218 34 76 W109 5. Inflammatory heart diseases 62 2 24 0 26 0 32 7 11 W111 H. Respiratory diseases 261 12 146 1 136 1 375 16 242 W112 1. Chronic obstructive pulmonary disease 53 4 41 0 28 0 74 9 164 W113 2. Asthma 103 4 37 0 37 0 97 5 56 W115 I. Digestive diseases 371 17 150 0 144 1 203 23 65 W116 1. Peptic ulcer disease 10 0 11 0 8 0 3 3 4 W117 2. Cirrhosis of the liver 97 - 32 0 27 0 36 7 13 W118 3. Appendicitis 1 0 1 0 1 0 1 0 1 05/18/2010 + ^
  • 9. W120 J. Genitourinary diseases 152 10 69 0 56 0 87 11 30 W121 1. Nephritis and nephrosis 111 6 33 0 38 0 45 3 8 W122 2. Benign prostatic hypertrophy 7 1 14 0 4 0 21 2 5 W124 K. Skin diseases 15 1 48 0 12 0 27 1 2 W125 L. Musculoskeletal diseases 80 22 121 0 46 0 206 18 95 W126 1. Rheumatoid arthritis 14 4 15 0 6 0 46 3 16 W127 2. Osteoarthritis 31 12 72 0 23 0 93 8 54 W131 M. Congenital anomalies 455 7 50 0 117 0 179 14 36 W143 N. Oral conditions 26 4 27 0 11 0 67 6 17 W144 1. Dental caries 19 2 17 0 8 0 55 4 10 W145 2. Periodontal disease 2 0 2 0 1 0 2 0 1 W146 3. Edentulism 5 1 8 0 3 0 10 2 6 W148 III.Injuries 1,200 88 913 1 1,088 1 736 43 211 W149 A. Unintentional injuries 902 78 537 1 784 1 463 37 151 W150 1. Road traffic accidents 301 5 185 0 284 0 148 8 49 W151 2. Poisonings 28 1 22 0 32 0 6 1 22 W152 3. Falls 114 10 30 0 42 0 36 4 22 W153 4. Fires 70 2 46 0 74 0 13 2 3 W154 5. Drownings 79 1 35 0 72 0 28 2 6 W155 6. Other unintentional injuries 310 59 220 0 279 0 232 20 50 W156 B. Intentional injuries 297 9 376 0 304 0 273 5 59 W157 1. Self-inflicted injuries 63 2 22 0 29 0 83 2 51 W158 2. Violence 49 5 184 0 218 0 188 3 8 W159 3. War 176 2 170 0 57 0 1 0 - Refer to Notes sheet for notes on this table. 05/18/2010 + ^
  • 10. All cause mortality (c) Level 4b Level 2b Level 3b Level 3b Level 4b Level 3b Level 1a Level 2a Level 1a Cause-specific mortality (d) Level 4 Level 2b Level 4 Level 4 Level 4 Level 2b Level 2a Level 2a Level 2b Population ('000) (e) 22,930 3,141 31,266 69 13,184 73 37,981 3,072 19,544 W000 All Causes 2,113.1 703.5 554.4 811.9 2,325.3 799.6 741.0 851.2 647.6 Lower uncertainty bound (f) 1,516.1 615.8 505.4 755.7 1,936.7 731.9 728.3 769.6 635.0 Upper uncertainty bound (f) 3,034.6 891.1 602.6 867.3 3,298.1 867.7 754.6 1,100.6 659.0 W001 I. Communicable, maternal, perinatal and 1,383.3 58.1 182.1 36.7 1,747.0 106.9 95.4 42.1 28.1 W002 nutritional conditions A. Infectious and parasitic diseases 738.2 7.1 96.5 14.3 1,084.9 31.7 41.0 16.4 9.2 W003 1. Tuberculosis 92.2 0.8 1.9 1.1 36.4 - 2.2 5.4 0.3 W004 2. STDs excluding HIV 1.2 0.2 6.8 0.0 17.7 0.6 0.1 0.1 0.1 W005 a. Syphilis 0.3 0.1 6.5 0.0 17.2 0.6 0.1 0.0 0.0 W006 b. Chlamydia 0.3 - 0.1 - 0.2 - - - - W007 c. Gonorrhoea 0.1 - 0.0 - 0.1 - - 0.0 - W009 3. HIV/AIDS 0.0 0.3 1.0 4.0 159.9 13.7 4.7 5.7 0.6 W010 4. Diarrhoeal diseases 179.5 0.2 26.1 0.9 369.9 0.6 1.1 1.9 0.2 W011 5. Childhood-cluster diseases 67.8 0.1 13.0 0.1 93.8 0.5 0.1 0.2 0.1 W012 a. Pertussis 28.7 - 1.8 - 32.1 - 0.0 0.0 0.0 W013 b. Poliomyelitis 0.0 - - 0.0 - - - - 0.1 W014 c. Diphtheria 0.0 - 0.0 - 0.4 - - 0.1 - W015 d. Measles 9.8 - 11.0 - 46.7 - - 0.1 - W016 e. Tetanus 29.3 0.1 0.1 0.0 14.6 0.5 0.0 0.0 0.0 W017 6. Meningitis 36.2 1.4 0.7 0.6 4.6 4.3 1.1 0.9 0.3 W018 7. Hepatitis B (g) 4.4 0.3 1.5 0.2 6.1 0.3 0.2 0.1 0.1 W019 Hepatitis C (g) 2.1 0.1 0.7 1.3 2.7 0.2 0.3 0.0 0.0 W020 8. Malaria 4.1 - 0.0 0.0 136.1 - - 0.1 0.0 W021 9. Tropical-cluster diseases 1.6 0.1 3.1 0.0 23.2 - 1.7 - - W022 a. Trypanosomiasis 0.0 - 2.2 - 9.9 - - - - W023 b. Chagas disease - - - - - - 1.7 - - W024 c. Schistosomiasis 0.0 - 0.2 - 11.6 - - - - W025 d. Leishmaniasis 1.6 0.1 0.8 0.0 1.8 - 0.0 - - W026 e. lymphatic filariasis 0.0 - - - - - - - - W027 f. Onchocerciasis - - - - - - - - - W028 10. Leprosy 0.0 - 0.3 0.0 0.1 - 0.1 - - W029 11. Dengue 0.0 - 0.0 - 0.0 - - - 0.0 W030 12. Japanese encephalitis - - - - - - - - - W031 13. Trachoma - - - - - - - - - W032 14. Intestinal nematode infections 0.1 0.0 0.2 - 0.5 - 0.0 - 0.0 W033 a. Ascariasis 0.0 - 0.0 - 0.0 - - - - W034 b. Trichuriasis - - 0.0 - 0.0 - - - - W035 c. Hookworm disease 0.1 - 0.2 - 0.4 - - - - W038 B. Respiratory infections 247.4 31.4 45.2 19.0 362.8 33.0 33.2 10.0 14.3 W039 1. Lower respiratory infections 243.9 31.0 44.2 18.8 356.3 33.0 33.1 9.8 14.2 W040 2. Upper respiratory infections 3.4 0.4 0.9 0.2 5.9 - 0.0 0.2 0.1 W041 3. Otitis media 0.1 - 0.0 0.0 0.7 - - 0.0 0.0 W042 C. Maternal conditions 82.0 0.6 3.3 0.0 85.6 3.2 0.9 0.3 0.1 W049 D. Perinatal conditions (h) 270.3 17.2 33.9 2.0 144.2 25.9 15.4 14.7 3.4 W050 1. Low birth weight 149.3 3.0 14.6 0.3 62.2 11.7 4.1 7.5 0.2 W051 2. Birth asphyxia and birth trauma 74.9 4.8 14.0 0.9 59.5 9.1 7.0 4.6 0.9 W053 E. Nutritional deficiencies 45.4 1.8 3.2 1.4 69.4 13.1 4.9 0.8 1.2 W054 1. Protein-energy malnutrition 31.8 0.7 1.7 0.3 62.1 2.1 3.6 0.3 0.4 W055 2. Iodine deficiency 0.7 - 0.0 - 0.2 - - - - W056 3. Vitamin A deficiency 0.1 0.1 0.6 - 4.9 - - - - W057 4. Iron-deficiency anaemia 5.7 0.9 0.8 0.7 2.0 11.0 1.1 0.5 0.5 W059 II. Noncommunicable diseases 613.0 583.1 300.2 735.9 387.3 658.8 592.7 769.4 578.7 W060 A. Malignant neoplasms 82.6 123.5 54.2 223.3 70.0 129.1 157.6 153.1 186.6 W061 1. Mouth and oropharynx cancers 10.1 2.2 2.5 5.4 7.4 2.2 2.7 3.1 3.7 W062 2. Oesophagus cancer 10.1 1.6 0.8 4.8 3.4 2.4 6.5 1.8 5.6 W063 3. Stomach cancer 5.4 18.2 4.5 14.7 10.4 15.1 9.0 16.3 6.6 W064 4. Colon and rectum cancers 4.2 4.0 4.2 31.8 2.6 10.9 19.4 11.5 27.2 W065 5. Liver cancer 2.8 17.6 0.5 10.9 3.9 - 4.9 8.5 4.1 W066 6. Pancreas cancer 0.7 4.4 1.4 9.9 0.9 3.8 9.5 6.1 9.2 W067 7. Trachea, bronchus, lung cancers 5.7 29.7 7.2 42.9 3.2 7.3 23.1 32.5 36.0 W068 8. Melanoma and other skin cancers 0.4 1.8 0.4 3.0 2.1 - 2.3 2.7 7.6 W069 9. Breast cancer 8.9 6.9 5.4 16.4 6.5 14.7 15.8 16.4 14.1 W070 10. Cervix uteri cancer 1.2 1.0 3.2 1.4 6.5 2.8 2.9 3.5 1.4 W071 11. Corpus uteri cancer 0.4 2.3 0.4 3.1 0.6 1.9 5.0 4.1 1.5 W072 12. Ovary cancer 1.9 0.6 1.1 3.8 1.3 1.6 3.1 4.7 4.0 W073 13. Prostate cancer 1.2 7.1 2.4 14.2 4.2 31.1 11.6 3.3 15.4 W074 14. Bladder cancer 2.8 - 4.5 9.8 2.5 3.4 4.0 3.8 4.7 W075 15. Lymphomas, multiple myeloma 8.2 3.0 4.0 12.3 4.3 8.9 6.9 4.8 13.8 W076 16. Leukaemia 5.8 4.9 1.2 7.8 1.4 5.1 5.8 4.9 7.7 W078 B. Other neoplasms 9.4 10.1 0.9 7.7 1.8 2.9 6.3 0.3 4.0 W079 C. Diabetes mellitus 11.8 6.2 9.7 19.9 12.4 54.3 25.4 50.7 16.3 W080 D. Endocrine disorders 14.2 1.9 2.5 5.6 5.0 35.8 7.3 2.3 7.3 W081 E. Neuropsychiatric conditions 38.2 18.2 8.5 65.6 18.5 23.0 15.1 8.5 38.1 W082 1. Unipolar depressive disorders 0.0 0.1 - 0.2 - - 0.0 0.0 0.3 W083 2. Bipolar disorder - - - 0.1 - - - 0.0 0.0 W084 3. Schizophrenia 0.1 0.5 - 0.2 - - 0.0 0.3 0.2 W085 4. Epilepsy 3.4 3.8 3.5 0.7 8.2 3.6 0.7 1.7 1.3 W086 5. Alcohol use disorders 0.5 0.0 0.8 0.6 1.3 11.7 1.9 0.7 1.4 W087 6. Alzheimer and other dementias* 0.6 1.4 1.0 50.0 1.0 0.5 5.9 2.1 20.3 W088 7. Parkinson disease 0.2 1.4 0.9 5.2 0.7 - 1.6 1.0 4.5 W089 8. Multiple sclerosis 0.2 1.4 0.0 0.4 0.1 0.7 0.3 0.3 0.6 W090 9. Drug use disorders 22.9 0.7 0.2 1.4 0.2 0.1 0.6 0.7 2.8 W091 10. Post-traumatic stress disorder - 0.1 - - - - - 0.0 - W092 11. Obsessive-compulsive disorder - - - - - - - - - W093 12. Panic disorder - - - - - - - - - W094 13. Insomnia (primary) - - - - - - - - - W095 14. Migraine - - - - - - - - - W098 F. Sense organ diseases 0.4 0.3 - 0.0 - - - - 0.0 W099 1. Glaucoma - - - 0.0 - - - - - W100 2. Cataracts - - - - - - - - - W101 3. Vision disorders, age-related - - - - - - - - - W102 4. Hearing loss, adult onset - - - - - - - - - W104 G. Cardiovascular diseases 295.0 366.4 150.0 269.5 167.2 317.7 245.5 461.4 241.7 W105 1. Rheumatic heart disease 8.5 1.4 2.4 3.9 4.7 - 0.6 4.9 1.2 W106 2. Hypertensive heart disease 32.6 14.1 8.0 11.7 8.9 33.7 11.9 16.6 5.9 W107 3. Ischaemic heart disease 144.6 127.0 47.8 97.5 54.1 71.9 90.3 277.2 130.3 W108 4. Cerebrovascular disease 50.3 132.7 51.9 75.9 58.0 127.3 59.7 137.1 60.0 W109 5. Inflammatory heart diseases 10.2 3.6 5.0 9.9 8.2 0.5 8.2 18.9 4.9 W111 H. Respiratory diseases 37.6 21.0 34.8 71.9 46.0 12.1 73.0 35.9 39.6 W112 1. Chronic obstructive pulmonary disease 14.2 8.8 16.1 36.6 17.6 1.9 13.4 25.5 26.7 W113 2. Asthma 10.0 8.5 1.8 2.0 2.5 0.3 2.2 4.0 2.2 W115 I. Digestive diseases 54.1 16.1 19.1 42.9 30.2 36.9 31.4 33.1 21.5 W116 1. Peptic ulcer disease 2.0 1.1 2.0 1.4 2.7 0.6 1.1 5.0 2.5 W117 2. Cirrhosis of the liver 24.2 - 6.6 13.4 10.6 18.1 6.9 16.1 4.7 05/18/2010 + ^
  • 11. W118 3. Appendicitis 0.1 0.1 0.1 0.2 0.3 0.7 0.2 0.4 0.1 W120 J. Genitourinary diseases 30.6 13.4 11.5 17.5 20.3 25.8 19.7 14.2 14.3 W121 1. Nephritis and nephrosis 27.7 11.8 10.5 13.8 19.3 24.1 16.9 7.5 10.7 W122 2. Benign prostatic hypertrophy 0.5 0.6 0.4 0.3 0.3 - 0.1 1.9 0.2 W124 K. Skin diseases 0.8 0.2 6.4 1.6 0.0 12.9 1.6 0.3 1.3 W125 L. Musculoskeletal diseases 0.8 1.3 0.3 7.8 2.2 3.3 1.5 2.2 4.6 W126 1. Rheumatoid arthritis 0.1 0.4 0.1 0.6 0.3 - 0.3 0.4 1.0 W127 2. Osteoarthritis 0.0 0.1 - 0.3 - - 0.1 0.0 0.6 W131 M. Congenital anomalies 37.5 4.5 2.2 2.3 13.7 5.1 8.2 7.3 3.2 W143 N. Oral conditions 0.1 0.0 - 0.0 - - - - 0.1 W144 1. Dental caries - - - - - - - - - W145 2. Periodontal disease - - - - - - - - - W146 3. Edentulism - - - - - - - - - W148 III.Injuries 116.7 62.3 72.1 39.3 191.0 33.9 52.9 39.6 40.7 W149 A. Unintentional injuries 79.3 53.5 41.2 31.2 130.8 23.2 33.8 32.5 27.9 W150 1. Road traffic accidents 36.7 2.5 17.2 15.2 58.0 10.8 11.5 10.6 8.6 W151 2. Poisonings 4.4 1.3 3.1 2.8 9.1 0.6 0.5 2.4 4.2 W152 3. Falls 5.6 0.7 2.4 3.7 5.2 - 1.0 1.4 3.3 W153 4. Fires 5.3 0.3 3.9 0.3 11.6 0.4 1.3 1.6 0.5 W154 5. Drownings 10.3 1.2 3.7 0.9 17.9 3.2 2.5 2.2 1.2 W155 6. Other unintentional injuries 17.1 47.4 10.8 8.3 28.9 8.1 17.0 14.2 10.1 W156 B. Intentional injuries 37.4 8.9 30.9 8.1 60.2 10.7 19.1 7.2 12.8 W157 1. Self-inflicted injuries 6.5 2.6 2.9 7.2 8.1 0.5 10.2 3.4 11.3 W158 2. Violence 4.0 6.0 12.0 0.9 39.6 10.2 8.8 3.7 1.5 W159 3. War 25.7 0.1 16.1 - 12.5 - - 0.2 - Refer to Notes sheet for notes on this table. 05/18/2010 + ^