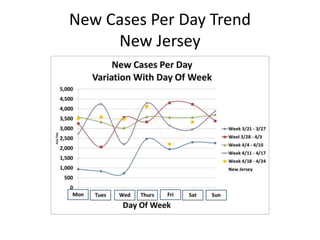
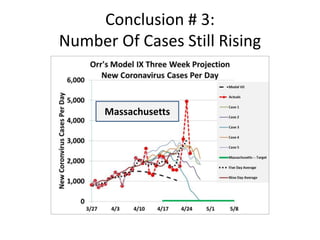
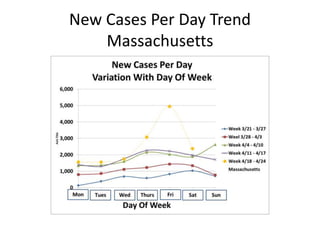
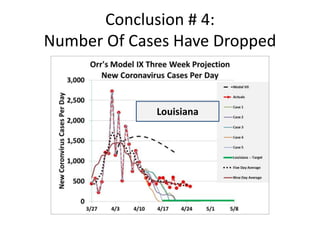
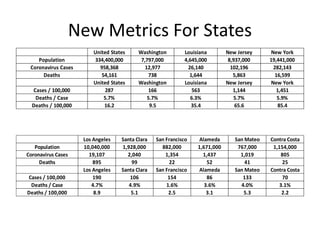
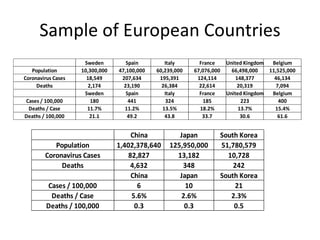
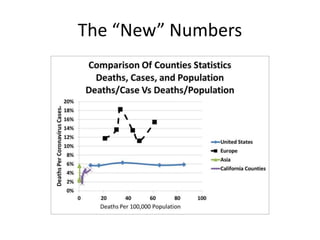
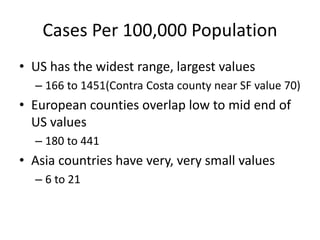
Another weekend, and another attempt to make sense out of the Coronavirus Case data from states in the United States. Overall, cases per day remain flat (on plateau) with no decline in data. However, other indications suggest increasing irrelevant to use new cases per day for social policy decisions. Indication that new hospitalizations per day might be a better measure.
2. The Numbers Are Perplexing
• For the third week, I approached the reported numbers
of test cases in the United States by state looking for
evidence of the start of a trend of reducing number of
new coronavirus cases per day.
– For the United States, there is no downward trend
– There are a hand full of state exceptions
• However, New York State and other states are
reporting measurable declines in hospitalizations and
intensive care usage while new cases per day are
approximately constant according to governors and
media
3. Conclusion # 1:
Variation In Cases Per Day Due To Day Of Week
Every
Weekend
Cases
Appear To
Be Dropping
All United
States
11. Conclusion # 5:
Need Data On Hospitalizations In Future
• The data SUGGESTS (adequate comparable data on
hospitalizations per day not available to compare to
data on new cases per day)
• News report suggest declining hospitalizations while
new cases per day flat in many states.
• Hospitalizations per day would be more useful for
“getting America back to work” than currently available
cases per day
– As the trend of cases per day with the “day of the week”,
how testing is done (and expanding testing) make older
data significantly less “apples to apples” that current cases
per day data for predicting future deaths due to
coronavirus cases.
12. Conclusion # 6:
Need New Metrics On Coronavirus
• Data on number of recoveries from
coronavirus based on antibodies testing
indicates 15 % to 20 % of New York population
has been inflected.
– If valid, New Your Coronavirus Cases actual
• 3,000,000 to 4,000,000 actual coronavirus cases
• 282,000 coronavirus cases reported based on test
– Question: Are only 1 in 10 cases being reported?
– Question: Do 90 % of cases have no symptoms?
13. New Metrics To Show
“How Well Is The United States Doing”
• Focus on Three Metrics and associated ratios
– Population of Country, State or County
– Reported Number Of Coronavirus Cases
– Reported Number of Deaths
• Derived Metrics
– Number of Coronavirus Cases Per 100,000
Population
– Percent of Coronavirus Cases resulting in Death
14. Samples Of New Metrics
• States in United States
– Washington
• Best at minimizing spread, earliest reported outbreak
– Louisiana
• Special Case due to source of infection, claims to
highest cases per population
– New Jersey
• Second highest number of total reported cases in US
– New Your
• Highest number of total reported cases in US
15. New Metrics For States
United States Washington Louisiana New Jersey New York
Population 334,400,000 7,797,000 4,645,000 8,937,000 19,441,000
Coronavirus Cases 958,368 12,977 26,140 102,196 282,143
Deaths 54,161 738 1,644 5,863 16,599
United States Washington Louisiana New Jersey New York
Cases / 100,000 287 166 563 1,144 1,451
Deaths / Case 5.7% 5.7% 6.3% 5.7% 5.9%
Deaths / 100,000 16.2 9.5 35.4 65.6 85.4
Los Angeles Santa Clara San Francisco Alameda San Mateo Contra Costa
Population 10,040,000 1,928,000 882,000 1,671,000 767,000 1,154,000
Coronavirus Cases 19,107 2,040 1,354 1,437 1,019 805
Deaths 895 99 22 52 41 25
Los Angeles Santa Clara San Francisco Alameda San Mateo Contra Costa
Cases / 100,000 190 106 154 86 133 70
Deaths / Case 4.7% 4.9% 1.6% 3.6% 4.0% 3.1%
Deaths / 100,000 8.9 5.1 2.5 3.1 5.3 2.2
16. Sample of European Countries
Sweden Spain Italy France United Kingdom Belgium
Population 10,300,000 47,100,000 60,239,000 67,076,000 66,498,000 11,525,000
Coronavirus Cases 18,549 207,634 195,391 124,114 148,377 46,134
Deaths 2,174 23,190 26,384 22,614 20,319 7,094
Sweden Spain Italy France United Kingdom Belgium
Cases / 100,000 180 441 324 185 223 400
Deaths / Case 11.7% 11.2% 13.5% 18.2% 13.7% 15.4%
Deaths / 100,000 21.1 49.2 43.8 33.7 30.6 61.6
China Japan South Korea
Population 1,402,378,640 125,950,000 51,780,579
Coronavirus Cases 82,827 13,182 10,728
Deaths 4,632 348 242
China Japan South Korea
Cases / 100,000 6 10 21
Deaths / Case 5.6% 2.6% 2.3%
Deaths / 100,000 0.3 0.3 0.5
18. Cases Per 100,000 Population
• US has the widest range, largest values
– 166 to 1451(Contra Costa county near SF value 70)
• European counties overlap low to mid end of
US values
– 180 to 441
• Asia countries have very, very small values
– 6 to 21
19. Deaths Per 100,000 Population
• US has the widest range, largest values
– 9.5 to 85.4 (Contra Costa county near SF value
2.2)
• European counties overlap low to mid end of
US values
– 21 to 62
• Asia countries have very, very small values
– 0.3 to 0.5
20. Deaths Per Reported Case
• Academically, this should be a function of
three variables:
– How well cases are measured
– Quality of care of the Medical Infrastructure
– Public Health measure to protect vulnerable
• United States: Very consistently at 6 %
• European Countries: 12% to 18 % range
• Asian Countries: China 6 %; others 2 % to 3 %
• San Francisco Area: 2 % to 5 %
21. Taking Numbers At “Face Value”
• Assuming accurate reporting:
– For the spectrum of vulnerable populations exposed
• Should have similar deaths to occur
– Deaths should be the most reliable measure
– The medical care available can reduce the death/case
(highest quality) or increase deaths/case (less medical
resource available)
• Consistency and actual level in deaths per case at
state and national level in US is viewed as
measure of higher health care quality compared
to European Countries
22. Taking Numbers At “Face Value”
• Actual level in deaths per case at state and
national level in US versus China would
suggest similar penetration in vulnerable
population with comparable health care.
• Lower levels in deaths per case in Japan,
South Korea, and counties around San
Francisco are most likely explained by strong
safe guards of vulnerable population with
equal or superior heath care provided.
23. Level Of Coronavirus Testing
• While difficult to draw direct evidence, there is a
strong implication that testing in the United
States has been:
– Less than Japan, South Korea and around San
Francisco
– Equal to that in China (based on similar REPORTED
deaths per reported case)
– Equal or superior to testing done in European
countries due to two to three times deaths per
reported case (superior testing in US and/or superior
medical care provided in US)