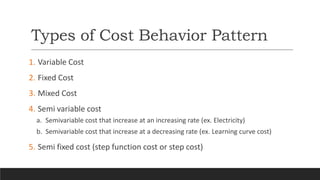
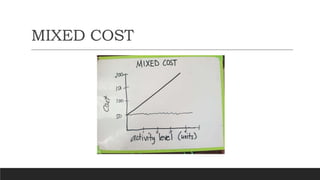
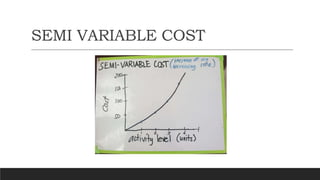
Cost Behavior:
Analysis and Use
MARIA CRISTINA OBESO-CPA, MBA
Cost Behavior
- how a cost will react as changes take place in the level of business
activity.
Types of Cost Behavior Pattern
1. Variable Cost
2. Fixed Cost
3. Mixed Cost
4. Semi variable cost
a. Semivariable cost that increase at an increasing rate (ex. Electricity)
b. Semivariable cost that increase at a decreasing rate (ex. Learning curve cost)
5. Semi fixed cost (step function cost or step cost)
VARIABLE COST
FIXED COST
MIXED COST
SEMI VARIABLE COST
SEMI VARIABLE COST
SEMI-FIXED COST
The Analysis of Mixed Cost
1. Account analysis
2. Industrial engineering method
3. Conference method
4. High-low method
5. Regression Analysis Method
6. Scattergraph or Visual Fit
Account Analysis
It makes uses of the experience and judgement of managers and
accountants who are familiar with company operations and the way
costs react to changes in activity level
Account Analysis
The account analysis involves the ff. steps:
(i) Review each cost account used to record the costs that are of interest.
Each cost is identified as either fixed or variable depending on the
relationship between the cost and some activity
(ii)Each major class of manufacturing overhead or other mixed cost is
itemized. Each cost is then divided into its estimated variable and fixed
components. This is done on the basis of the experience and judgement
of accounting and other personnel
Industrial Engineering Method
Estimates cost function by analyzing the relationship between inputs
and outputs in physical forms. Engineering estimates indicate what
costs should be.
Industrial Engineering Method
Steps in applying engineering method of estimating costs.
i. A study of the physical relation between the quantities of inputs
(material, labor etc) and each unit of output (finished product) is done
a. A detailed step by step analysis of each phase of each manufacturing process
together with the kids of work performed, and time to perform each step is done.
b. Engineering estimates of the materials required for each unit of production are
obtained from drawings and specification sheets
Conference Method
Cost functions are estimated based on the analysis and opinions
about costs and their drivers obtained from various departments of
an organization such as purchasing, process engineering,
manufacturing, employee relations and so on. This information is
used to determine the selling price of the product, optimum product
mix and evaluate cost improvements over time.
High-low Method
- is based on costs observed at both the high and low levels of
activity within the relevant range
Variable cost per unit (b) = highest cost –lowest cost
highest activity level-lowest activity level
Fixed cost (a) = Total cost – variable cost
= Total cost – b (no. of units)
High-low Method
Illustrative Case I. Predictors, Inc.
Given: Data for the past 10 months were collected for Predictors, Inc. to
estimate the variable and fixed manufacturing overhead.
High-low Method
The following data on supplies cost and direct labor hours from Jan, to October are available:
Required: Determine the variable cost rate per hour and the fixed cost portion using the high-
low method
X Y
DIRECT LABOR
HOURS
SUPPLIES COST
20 50
40 110
60 150
20 70
30 80
40 100
50 150
10 60
30 110
50 120
ANSWER: HIGH-LOW METHOD
Regression Analysis Method
Uses all available data to estimate the cost function
It is a statistical method that measures the average amount of change in
the dependent variable that is associated with a unit of change of one or
more independent variable.
Regression Analysis Method
Simple regression analysis – estimates the relationship between the dependent variable
and one independent variable
Multiple regression analysis – estimates the relationship between the dependent and
multiple independent variable
Least squares regression method – a statistical technique which is often used in
separating mixed costs into their fixed and variable components
- Basically a line of regression is determined by solving two simultaneous linear equations which
which are based on the condition that the sum of deviations above the line equals the sum of
deviations below the line
Regression Analysis Method
Regression Method
The following data on supplies cost and direct labor hours from Jan, to October are available:
Required: Determine the variable cost rate per hour and the fixed cost portion using the high-
low method
X Y
DIRECT LABOR
HOURS
SUPPLIES COST
20 50
40 110
60 150
20 70
30 80
40 100
50 150
10 60
30 110
50 120
ANSWER: REGRESSION
X Y XY X squared
20 50 1000 400
40 110 4400 100
____ _________ ____ _____
REGRESSION USING EXCEL
Scattergraph or Visual Fit
This is a rough guide for cost estimation which plot the cost against past activity
levels. The line is drawn, insofar as possible by visual judgement, so that the
distances of the observation above the line are equal to the distances of the
observations below the line. The line is called regression line.
Scattergraph or Visual Fit
Steps involved in the use of Scattergraph
i. On a graph, plot actual costs (on vertical axis) during the period under study against the volume
levels (on horizontal axis)
ii. The line of best fit is then drawn by visual inspection of the plotted points, the line representing
the trend shown by the majority of the points
iii. The fixed cost is estimated by extending the left end of the line to the vertical axis
iv. The variable cost rate or slope of the cost line is determined by dividing the difference between
any two levels of activities by the difference in costs corresponding to the same level of activities
Strengths and Weaknesses of
Cost Estimation Methods
METHOD STRENGTHS WEAKNESSES
Account Analysis Provides a detailed expert analysis of the
cost behavior in each account
Subjective
Engineering Method Based on studies of what future costs should
should be rather than what past costs have
been
Not particularly useful when the
physical relation between inputs and
outputs is indirect
High-low method Simple to apply Uses only two data points which may
not produce accurate results
Scattergraph Method Uses all the observations of cost data
Relatively easy to understand and apply
The fitting of the line to the
observations is subjective.
Difficult to do where several
independent variables are to be used.
Least-squares regression method Uses all of the observations of cost data
The line is statistically fit to the observations
A measure of the goodness of fits of the line
to the observations is provided
Relatively easy to use with computers and
sophisticated calculators
The regression model requires that
several relatively strict assumptions be
satisfied for the results to be valid

Cost-Behavior-1-3.pptx

  • 1.
    Cost Behavior: Analysis andUse MARIA CRISTINA OBESO-CPA, MBA
  • 2.
    Cost Behavior - howa cost will react as changes take place in the level of business activity.
  • 3.
    Types of CostBehavior Pattern 1. Variable Cost 2. Fixed Cost 3. Mixed Cost 4. Semi variable cost a. Semivariable cost that increase at an increasing rate (ex. Electricity) b. Semivariable cost that increase at a decreasing rate (ex. Learning curve cost) 5. Semi fixed cost (step function cost or step cost)
  • 4.
  • 5.
  • 6.
  • 7.
  • 8.
  • 9.
  • 10.
    The Analysis ofMixed Cost 1. Account analysis 2. Industrial engineering method 3. Conference method 4. High-low method 5. Regression Analysis Method 6. Scattergraph or Visual Fit
  • 11.
    Account Analysis It makesuses of the experience and judgement of managers and accountants who are familiar with company operations and the way costs react to changes in activity level
  • 12.
    Account Analysis The accountanalysis involves the ff. steps: (i) Review each cost account used to record the costs that are of interest. Each cost is identified as either fixed or variable depending on the relationship between the cost and some activity (ii)Each major class of manufacturing overhead or other mixed cost is itemized. Each cost is then divided into its estimated variable and fixed components. This is done on the basis of the experience and judgement of accounting and other personnel
  • 13.
    Industrial Engineering Method Estimatescost function by analyzing the relationship between inputs and outputs in physical forms. Engineering estimates indicate what costs should be.
  • 14.
    Industrial Engineering Method Stepsin applying engineering method of estimating costs. i. A study of the physical relation between the quantities of inputs (material, labor etc) and each unit of output (finished product) is done a. A detailed step by step analysis of each phase of each manufacturing process together with the kids of work performed, and time to perform each step is done. b. Engineering estimates of the materials required for each unit of production are obtained from drawings and specification sheets
  • 15.
    Conference Method Cost functionsare estimated based on the analysis and opinions about costs and their drivers obtained from various departments of an organization such as purchasing, process engineering, manufacturing, employee relations and so on. This information is used to determine the selling price of the product, optimum product mix and evaluate cost improvements over time.
  • 16.
    High-low Method - isbased on costs observed at both the high and low levels of activity within the relevant range Variable cost per unit (b) = highest cost –lowest cost highest activity level-lowest activity level Fixed cost (a) = Total cost – variable cost = Total cost – b (no. of units)
  • 17.
    High-low Method Illustrative CaseI. Predictors, Inc. Given: Data for the past 10 months were collected for Predictors, Inc. to estimate the variable and fixed manufacturing overhead.
  • 18.
    High-low Method The followingdata on supplies cost and direct labor hours from Jan, to October are available: Required: Determine the variable cost rate per hour and the fixed cost portion using the high- low method X Y DIRECT LABOR HOURS SUPPLIES COST 20 50 40 110 60 150 20 70 30 80 40 100 50 150 10 60 30 110 50 120
  • 19.
  • 20.
    Regression Analysis Method Usesall available data to estimate the cost function It is a statistical method that measures the average amount of change in the dependent variable that is associated with a unit of change of one or more independent variable.
  • 21.
    Regression Analysis Method Simpleregression analysis – estimates the relationship between the dependent variable and one independent variable Multiple regression analysis – estimates the relationship between the dependent and multiple independent variable Least squares regression method – a statistical technique which is often used in separating mixed costs into their fixed and variable components - Basically a line of regression is determined by solving two simultaneous linear equations which which are based on the condition that the sum of deviations above the line equals the sum of deviations below the line
  • 22.
  • 23.
    Regression Method The followingdata on supplies cost and direct labor hours from Jan, to October are available: Required: Determine the variable cost rate per hour and the fixed cost portion using the high- low method X Y DIRECT LABOR HOURS SUPPLIES COST 20 50 40 110 60 150 20 70 30 80 40 100 50 150 10 60 30 110 50 120
  • 24.
  • 25.
    X Y XYX squared 20 50 1000 400 40 110 4400 100 ____ _________ ____ _____
  • 26.
  • 27.
    Scattergraph or VisualFit This is a rough guide for cost estimation which plot the cost against past activity levels. The line is drawn, insofar as possible by visual judgement, so that the distances of the observation above the line are equal to the distances of the observations below the line. The line is called regression line.
  • 28.
    Scattergraph or VisualFit Steps involved in the use of Scattergraph i. On a graph, plot actual costs (on vertical axis) during the period under study against the volume levels (on horizontal axis) ii. The line of best fit is then drawn by visual inspection of the plotted points, the line representing the trend shown by the majority of the points iii. The fixed cost is estimated by extending the left end of the line to the vertical axis iv. The variable cost rate or slope of the cost line is determined by dividing the difference between any two levels of activities by the difference in costs corresponding to the same level of activities
  • 29.
    Strengths and Weaknessesof Cost Estimation Methods METHOD STRENGTHS WEAKNESSES Account Analysis Provides a detailed expert analysis of the cost behavior in each account Subjective Engineering Method Based on studies of what future costs should should be rather than what past costs have been Not particularly useful when the physical relation between inputs and outputs is indirect High-low method Simple to apply Uses only two data points which may not produce accurate results Scattergraph Method Uses all the observations of cost data Relatively easy to understand and apply The fitting of the line to the observations is subjective. Difficult to do where several independent variables are to be used. Least-squares regression method Uses all of the observations of cost data The line is statistically fit to the observations A measure of the goodness of fits of the line to the observations is provided Relatively easy to use with computers and sophisticated calculators The regression model requires that several relatively strict assumptions be satisfied for the results to be valid