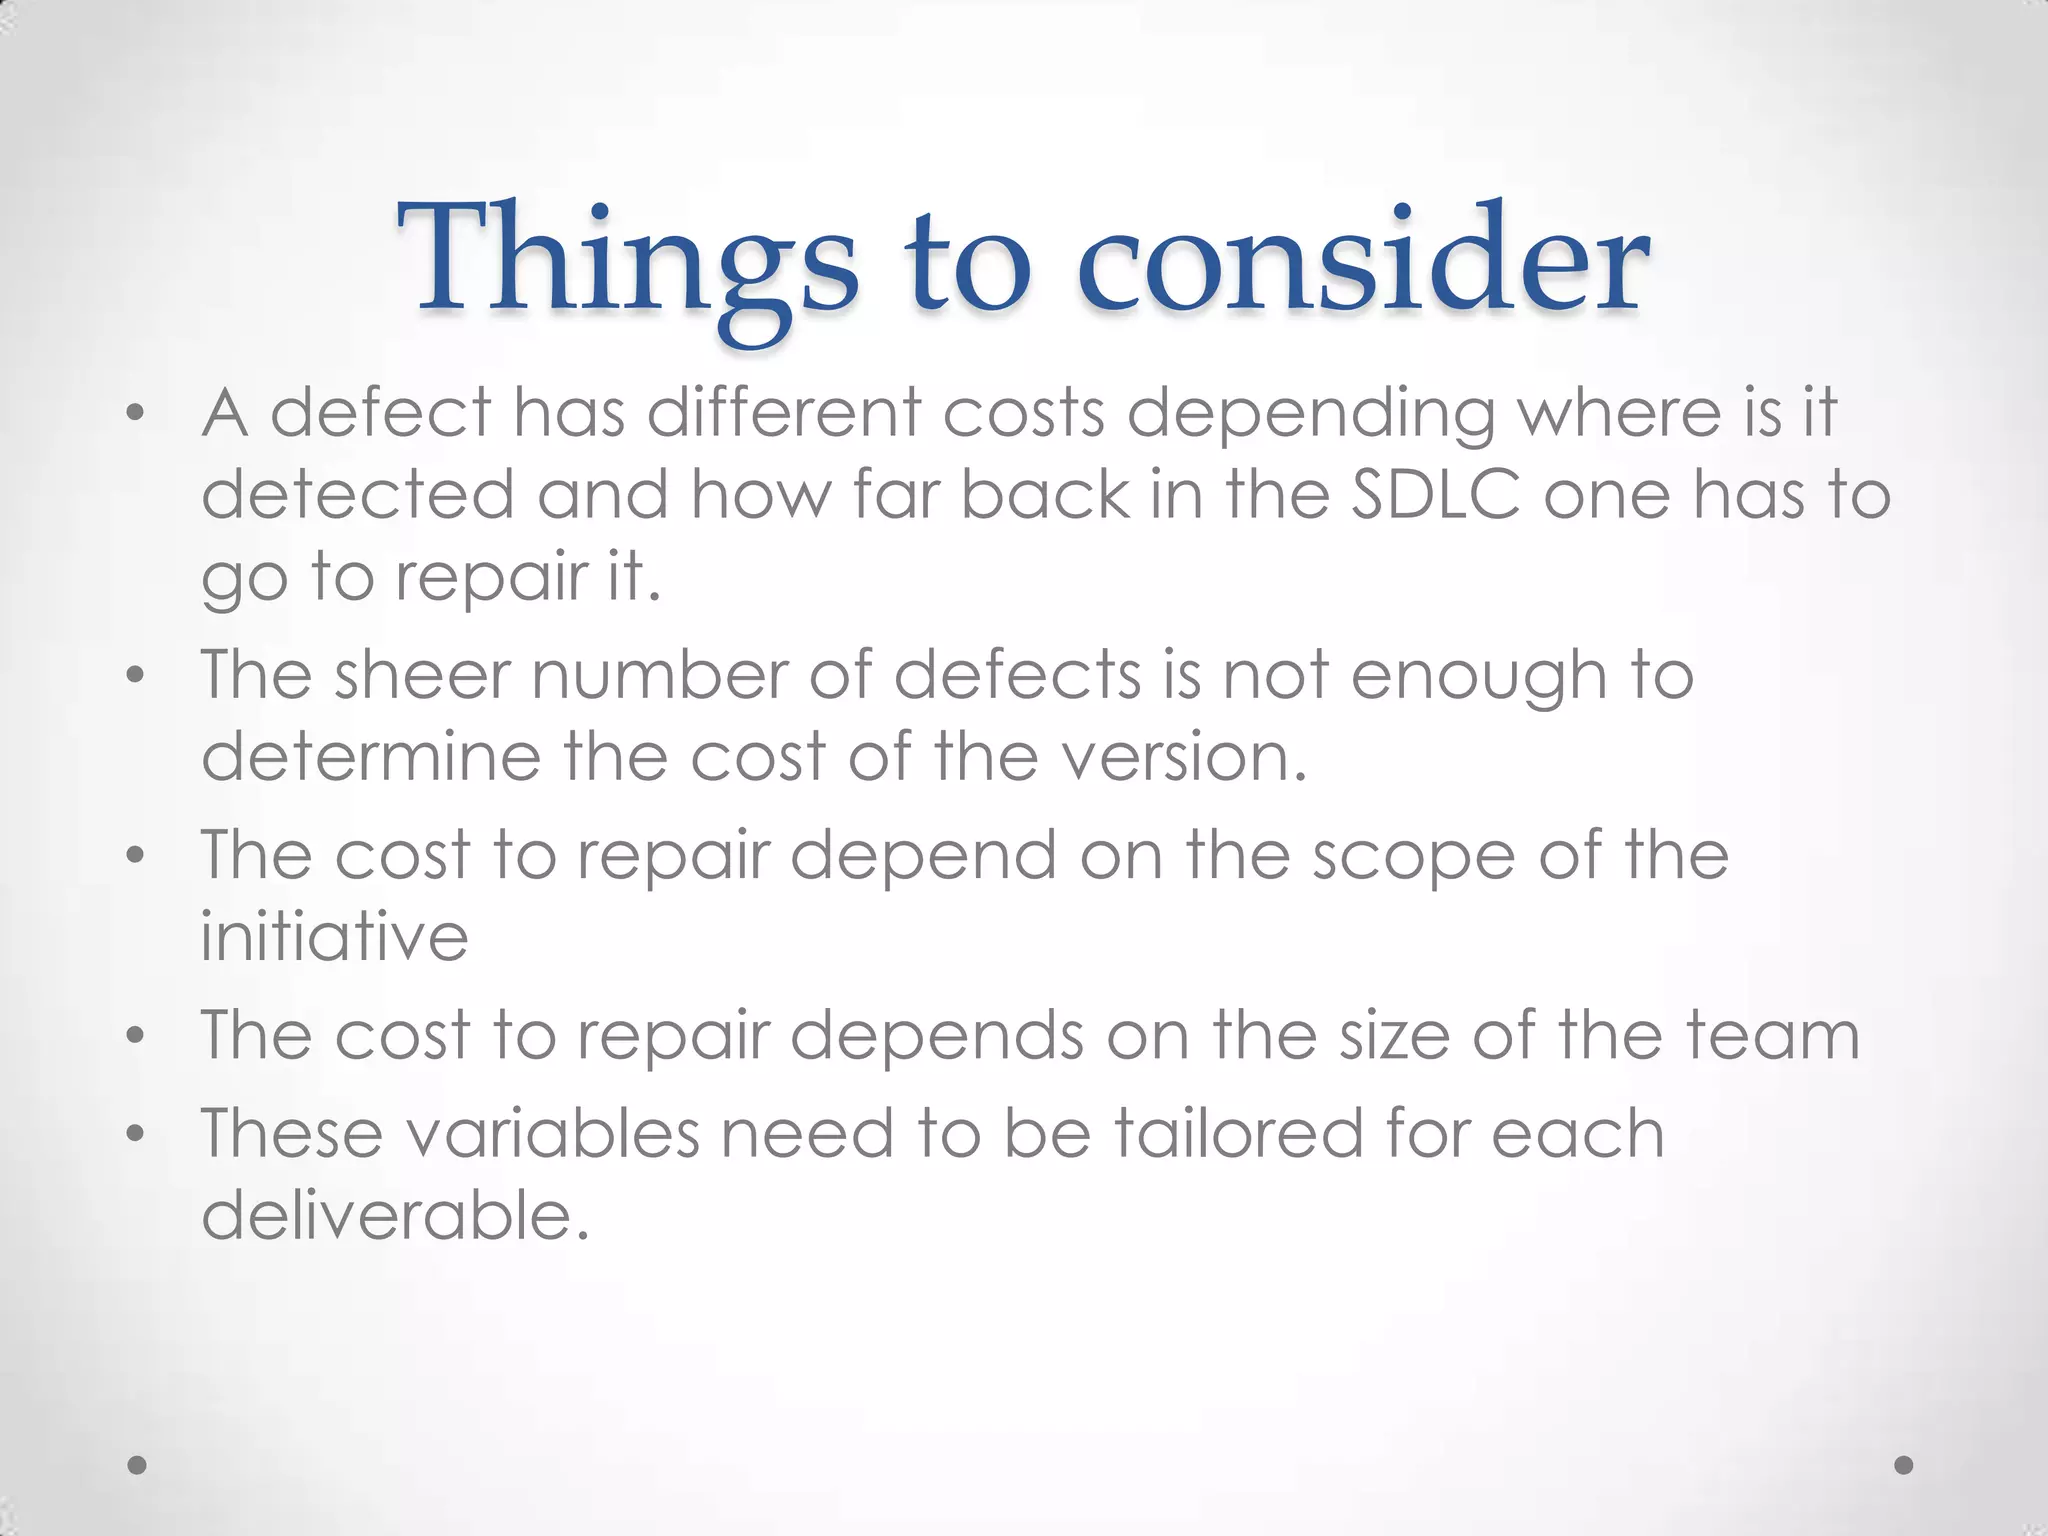
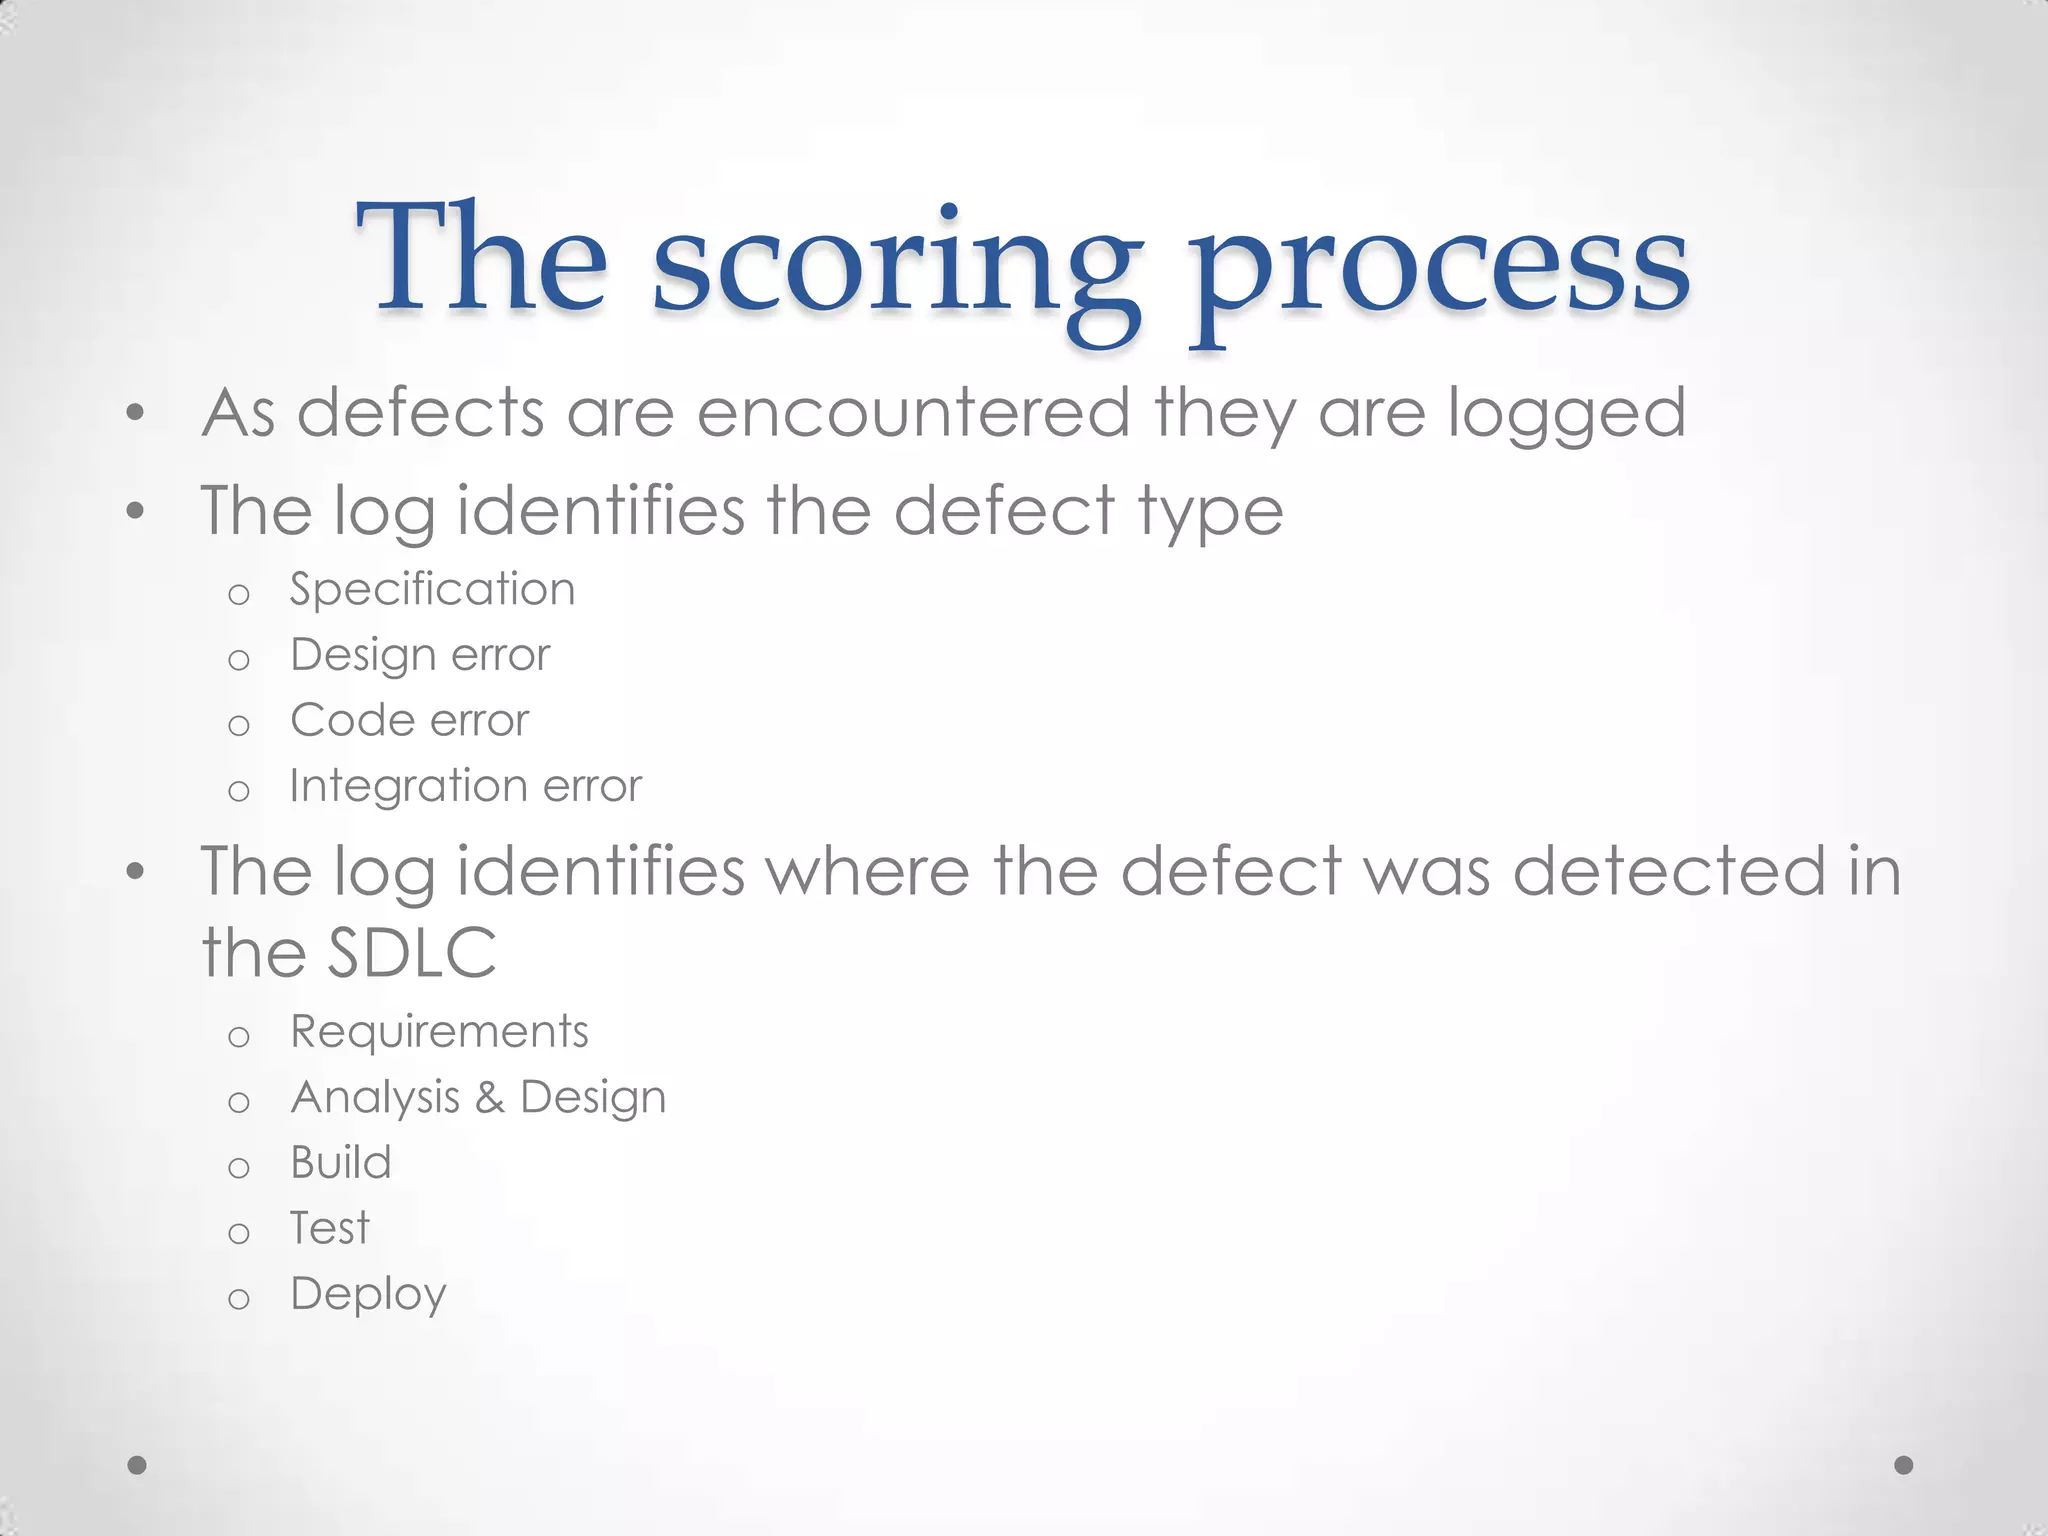
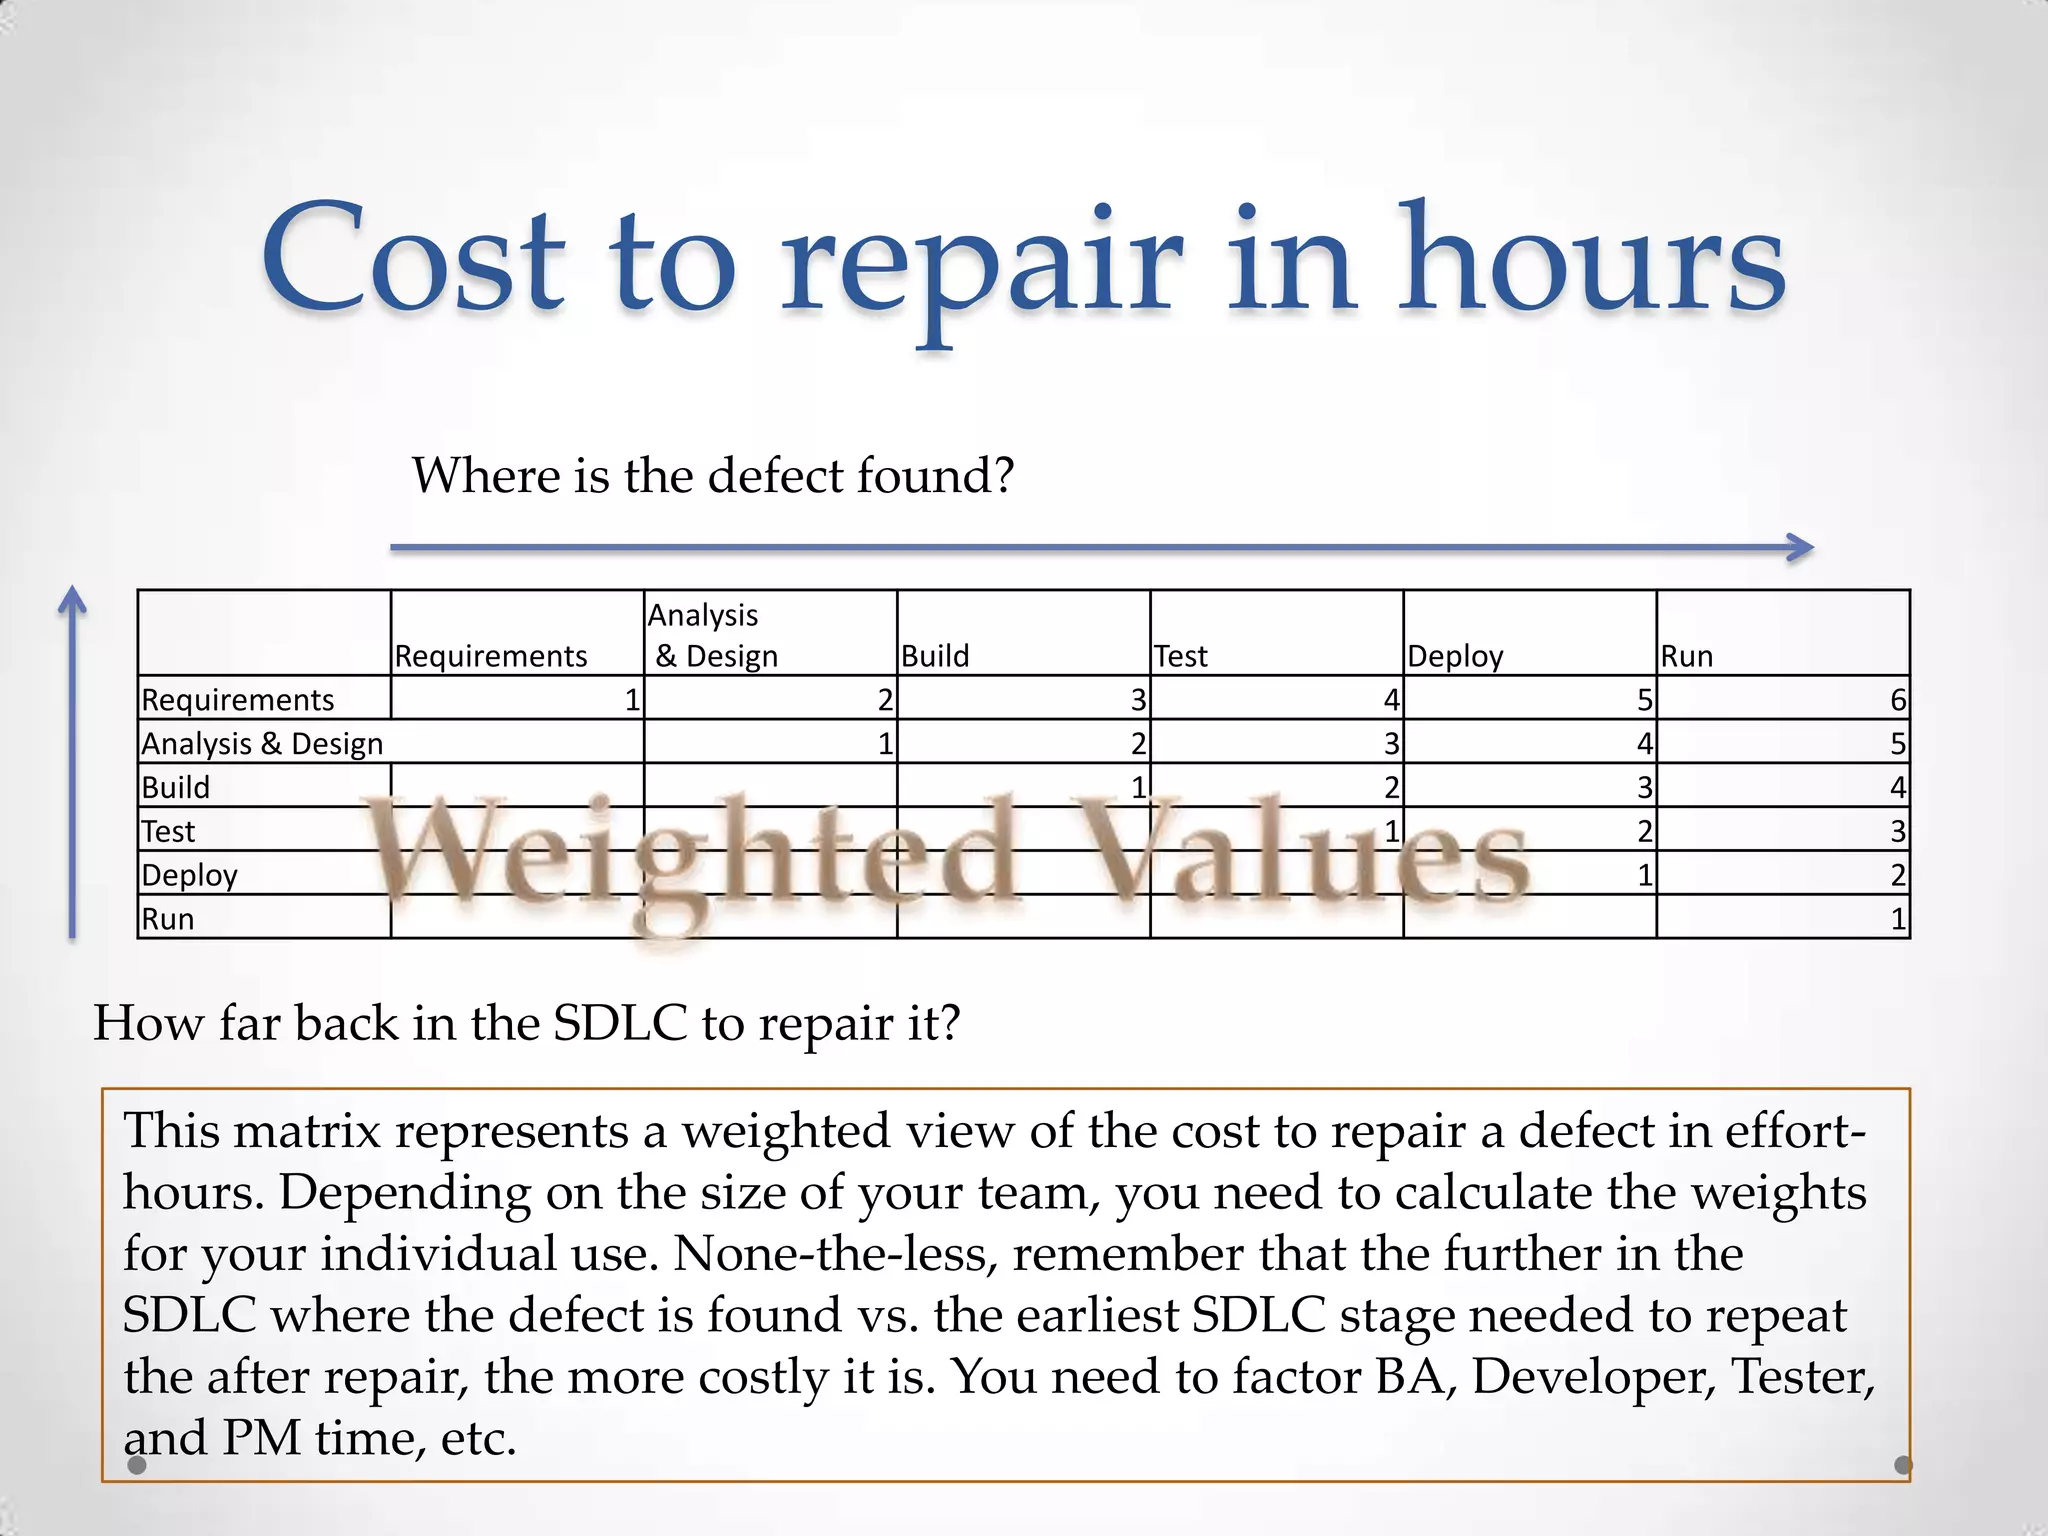
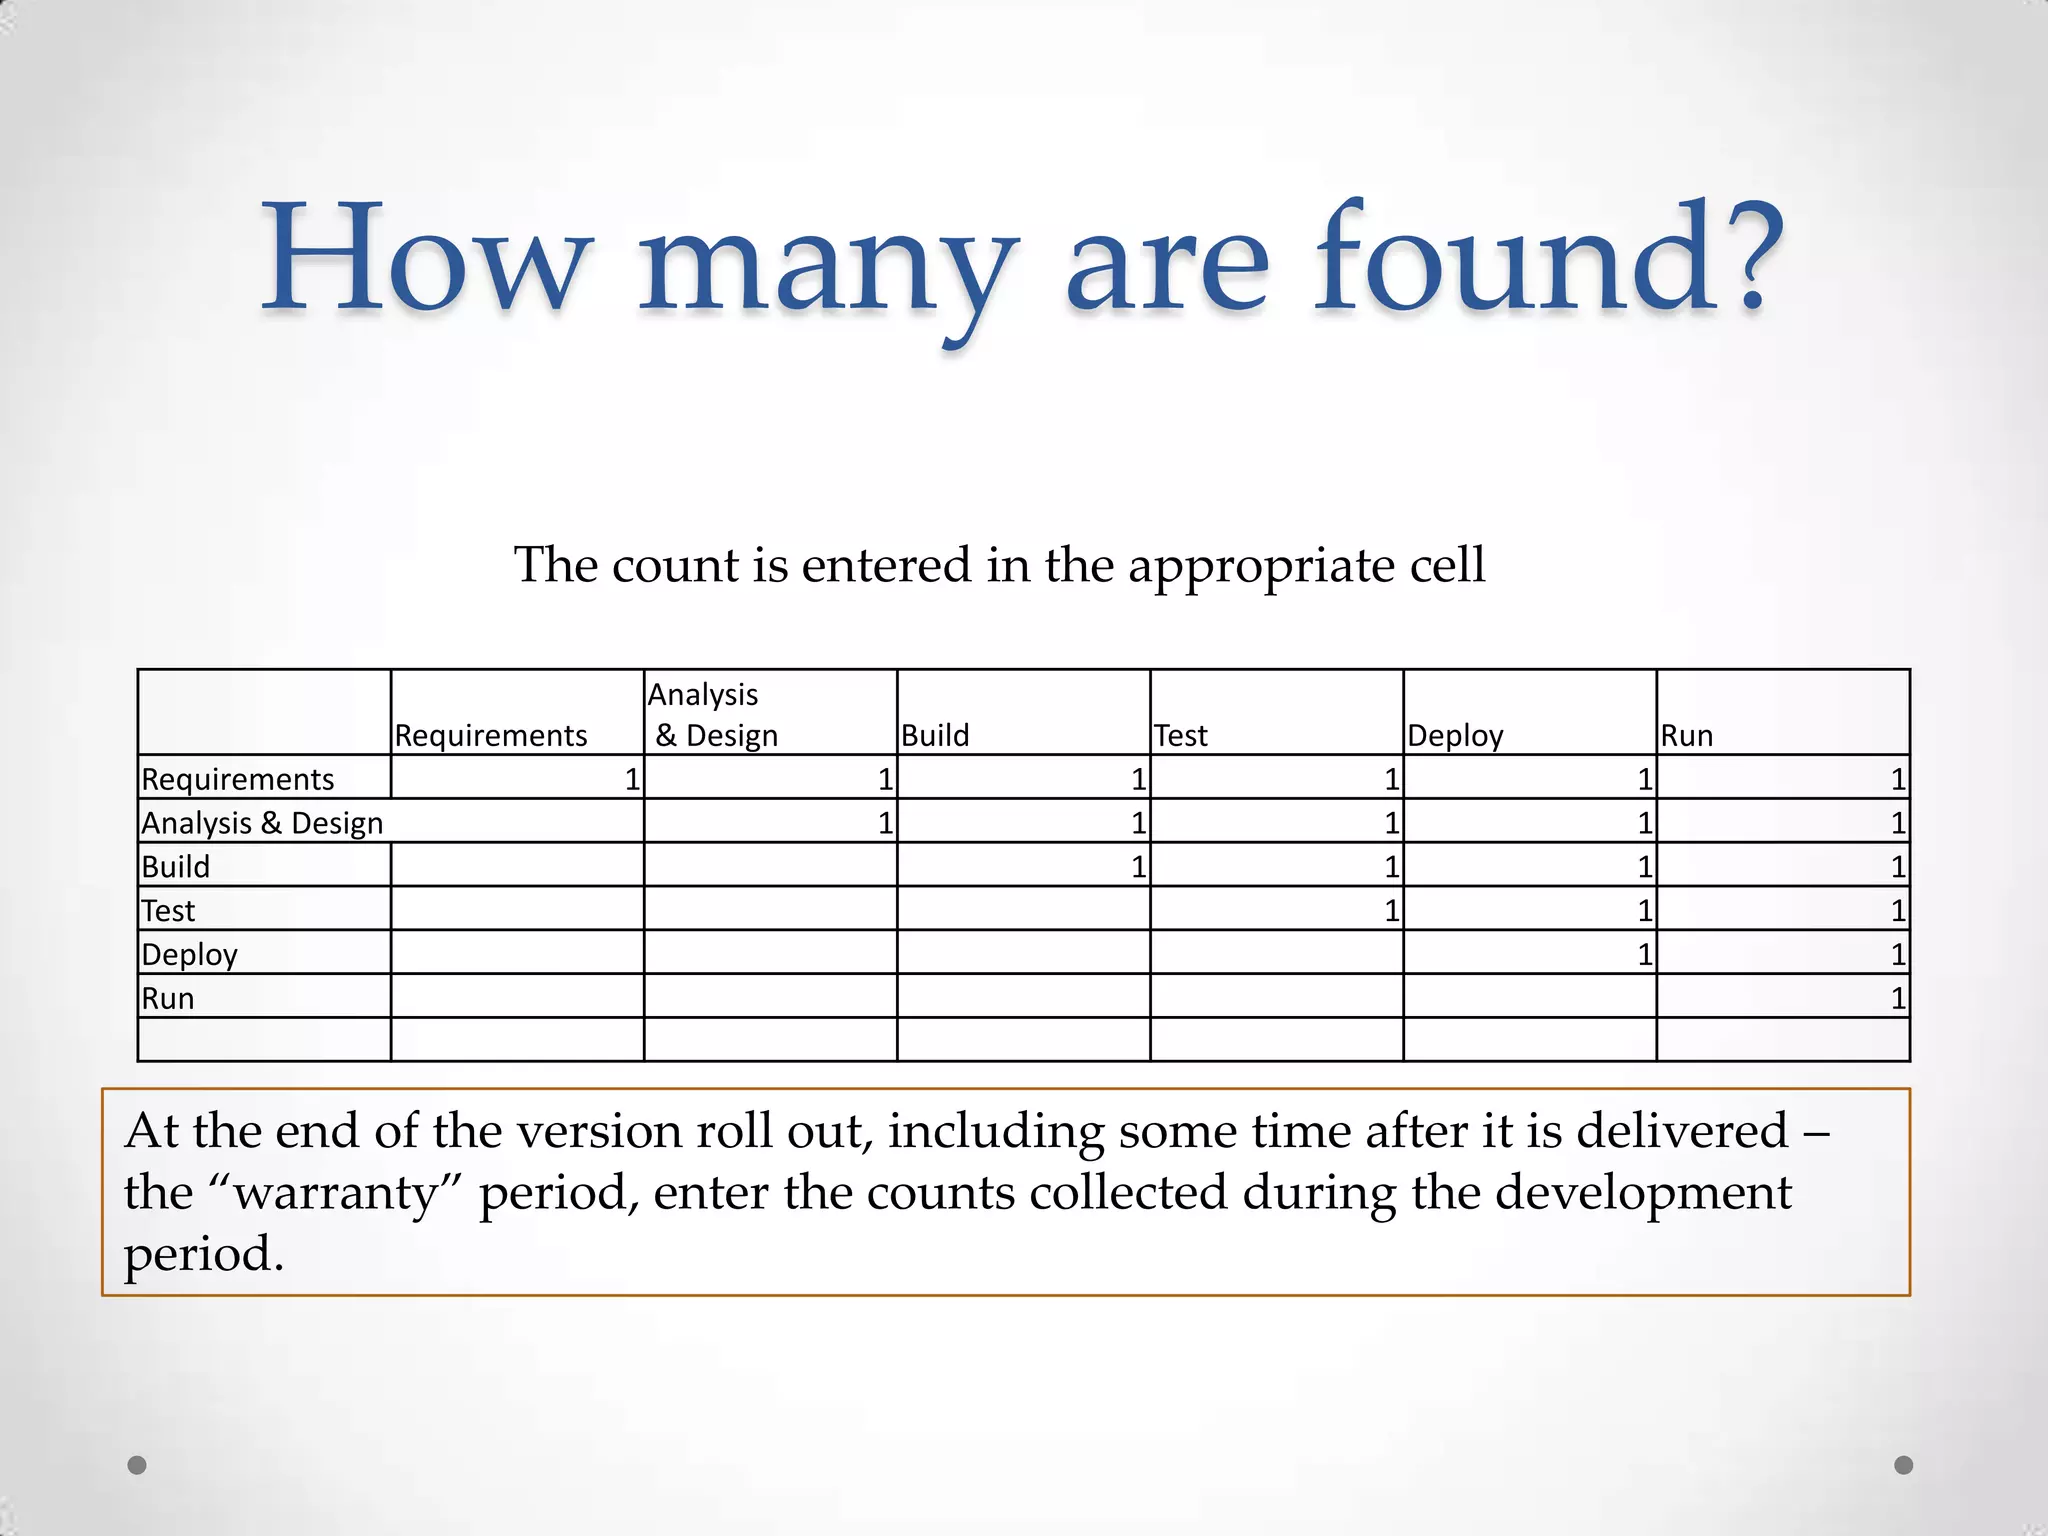
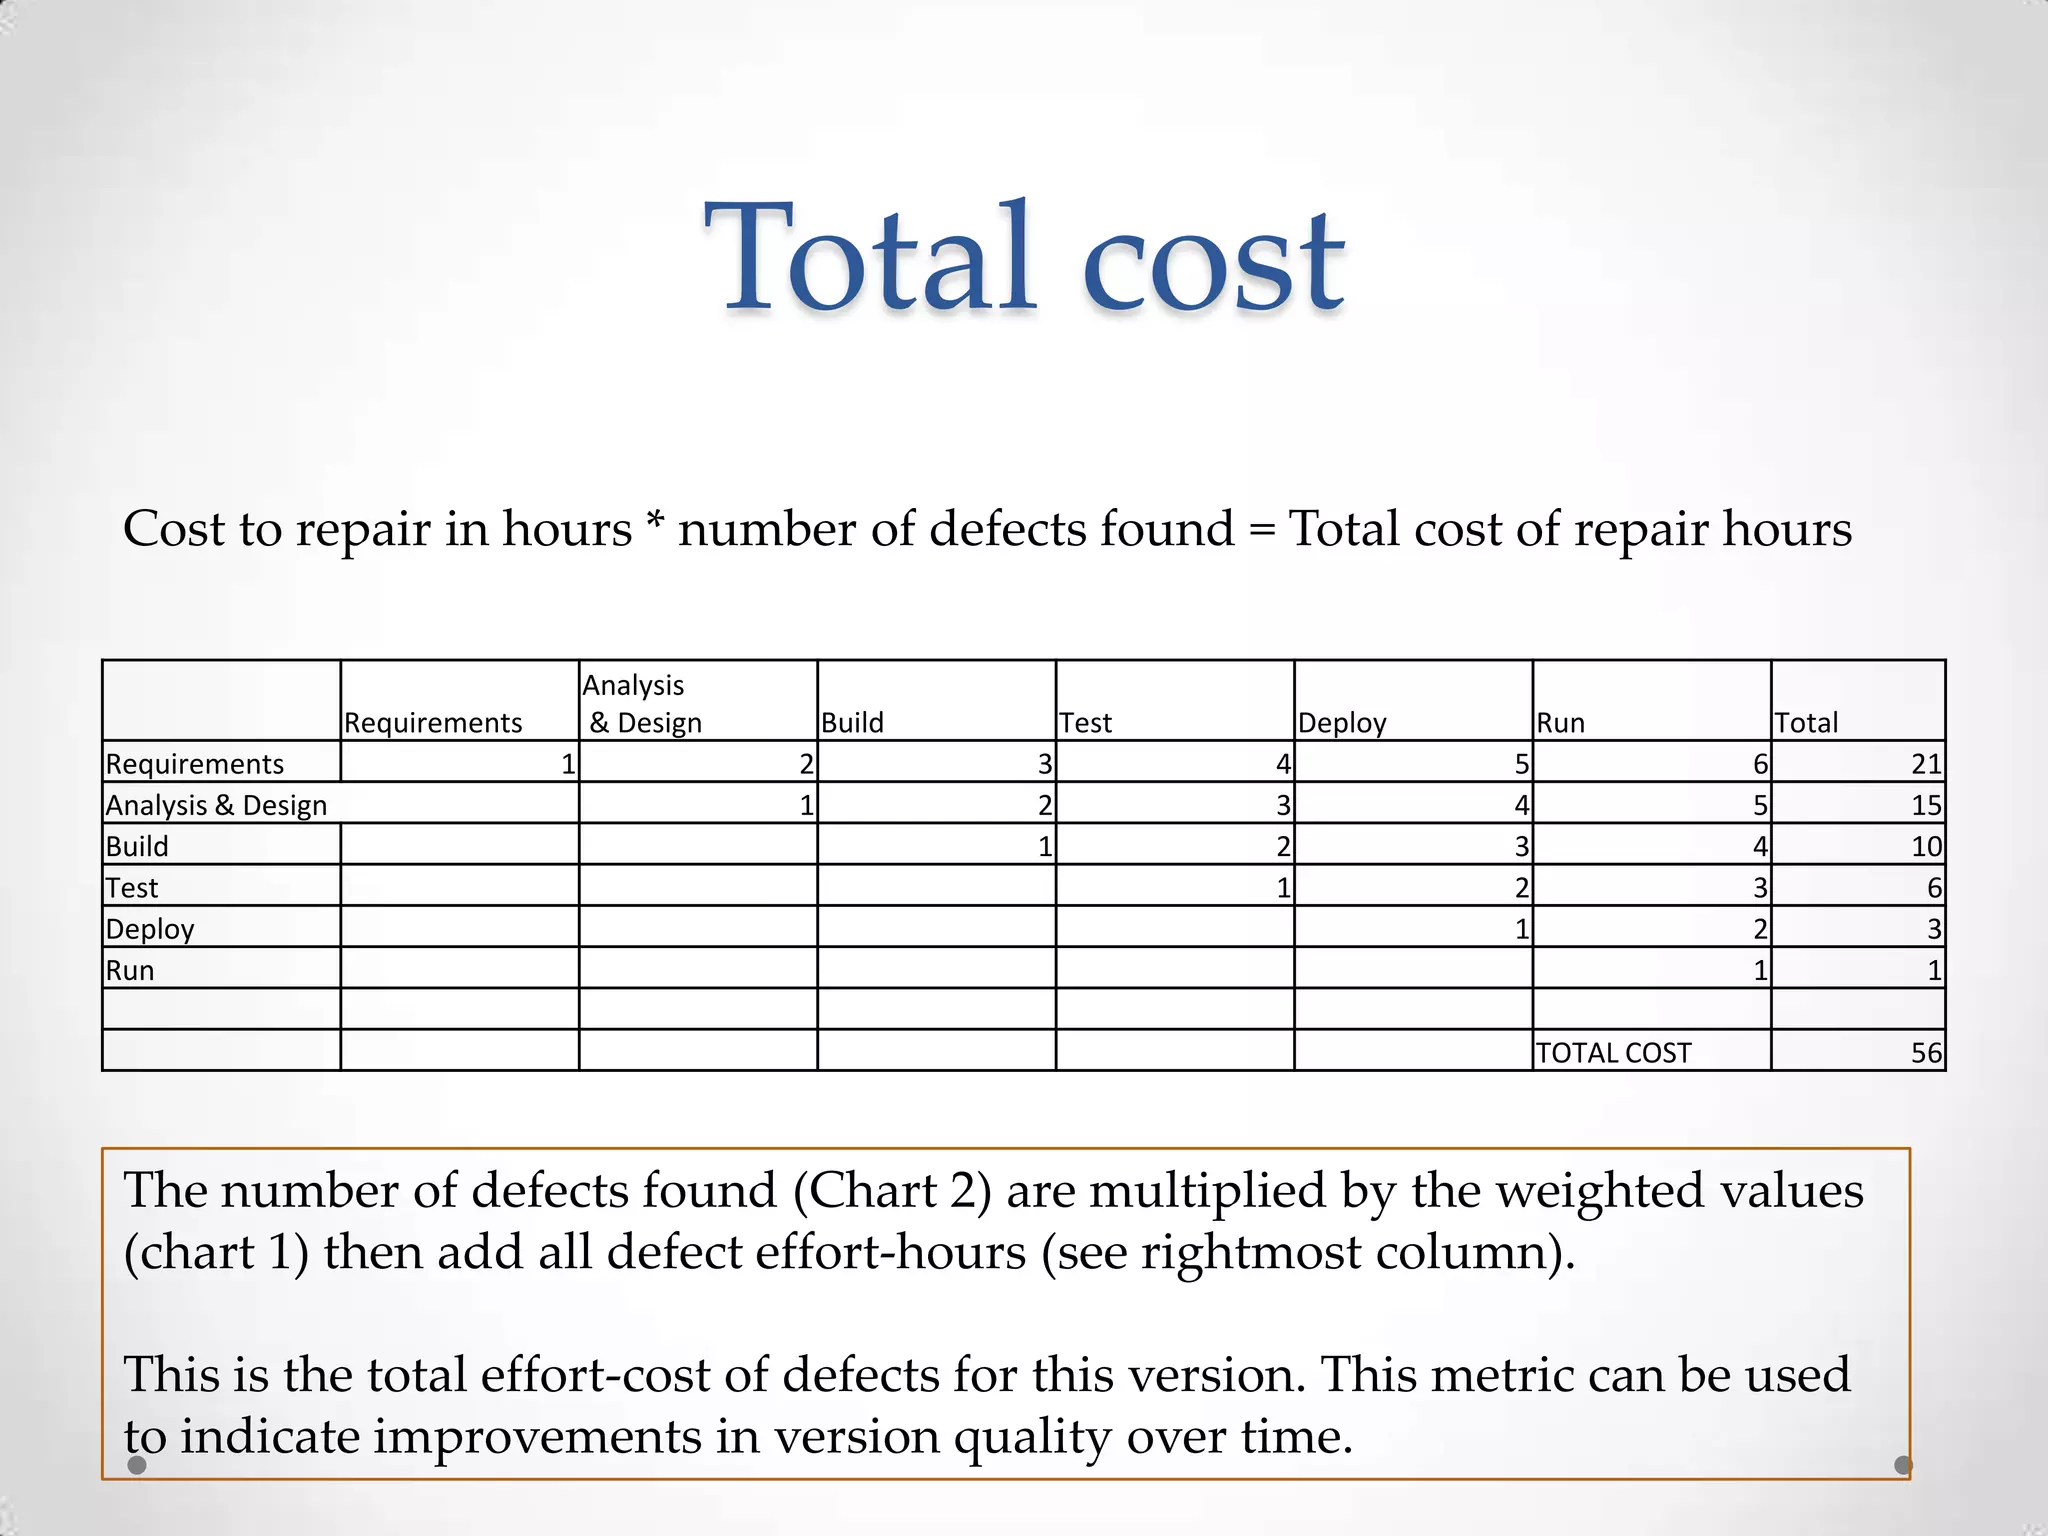
The True Cost of
Defects
Measuring Version Quality
By Michael M. Garcia
November 2013
Things to consider
• A defect has different costs depending where is it
detected and how far back in the SDLC one has to
go to repair it.
• The sheer number of defects is not enough to
determine the cost of the version.
• The cost to repair depend on the scope of the
initiative
• The cost to repair depends on the size of the team
• These variables need to be tailored for each
deliverable.
The scoring process
• As defects are encountered they are logged
• The log identifies the defect type
o
o
o
o

Specification
Design error
Code error
Integration error

• The log identifies where the defect was detected in
the SDLC
o
o
o
o
o

Requirements
Analysis & Design
Build
Test
Deploy
Cost to repair in hours
Where is the defect found?
Analysis
& Design

Requirements
Requirements
Analysis & Design
Build
Test
Deploy
Run

1

Build
2
1

Test
3
2
1

Deploy
4
3
2
1

Run
5
4
3
2
1

How far back in the SDLC to repair it?
This matrix represents a weighted view of the cost to repair a defect in efforthours. Depending on the size of your team, you need to calculate the weights
for your individual use. None-the-less, remember that the further in the
SDLC where the defect is found vs. the earliest SDLC stage needed to repeat
the after repair, the more costly it is. You need to factor BA, Developer, Tester,
and PM time, etc.

6
5
4
3
2
1
How many are found?
The count is entered in the appropriate cell
Analysis
& Design

Requirements
Requirements
Analysis & Design
Build
Test
Deploy
Run

1

Build
1
1

Test
1
1
1

Deploy
1
1
1
1

Run
1
1
1
1
1

At the end of the version roll out, including some time after it is delivered –
the “warranty” period, enter the counts collected during the development
period.

1
1
1
1
1
1
Total cost
Cost to repair in hours * number of defects found = Total cost of repair hours
Analysis
& Design

Requirements
Requirements
Analysis & Design
Build
Test
Deploy
Run

1

Build
2
1

Test
3
2
1

Deploy
4
3
2
1

Run
5
4
3
2
1

Total
6
5
4
3
2
1

TOTAL COST

The number of defects found (Chart 2) are multiplied by the weighted values
(chart 1) then add all defect effort-hours (see rightmost column).
This is the total effort-cost of defects for this version. This metric can be used
to indicate improvements in version quality over time.

21
15
10
6
3
1
56
Monetize
• Once you arrive at the total cost in hours you need
to develop an average person cost rate
• If the cost rate for a person-hour is $100 and the
version defect cost was 56 hours,
• The version defect cost is $56,000
• Improving the early detection of errors may seem
expensive, but defects add up to real costs.

Cost of defects

  • 1.
    The True Costof Defects Measuring Version Quality By Michael M. Garcia November 2013
  • 2.
    Things to consider •A defect has different costs depending where is it detected and how far back in the SDLC one has to go to repair it. • The sheer number of defects is not enough to determine the cost of the version. • The cost to repair depend on the scope of the initiative • The cost to repair depends on the size of the team • These variables need to be tailored for each deliverable.
  • 3.
    The scoring process •As defects are encountered they are logged • The log identifies the defect type o o o o Specification Design error Code error Integration error • The log identifies where the defect was detected in the SDLC o o o o o Requirements Analysis & Design Build Test Deploy
  • 4.
    Cost to repairin hours Where is the defect found? Analysis & Design Requirements Requirements Analysis & Design Build Test Deploy Run 1 Build 2 1 Test 3 2 1 Deploy 4 3 2 1 Run 5 4 3 2 1 How far back in the SDLC to repair it? This matrix represents a weighted view of the cost to repair a defect in efforthours. Depending on the size of your team, you need to calculate the weights for your individual use. None-the-less, remember that the further in the SDLC where the defect is found vs. the earliest SDLC stage needed to repeat the after repair, the more costly it is. You need to factor BA, Developer, Tester, and PM time, etc. 6 5 4 3 2 1
  • 5.
    How many arefound? The count is entered in the appropriate cell Analysis & Design Requirements Requirements Analysis & Design Build Test Deploy Run 1 Build 1 1 Test 1 1 1 Deploy 1 1 1 1 Run 1 1 1 1 1 At the end of the version roll out, including some time after it is delivered – the “warranty” period, enter the counts collected during the development period. 1 1 1 1 1 1
  • 6.
    Total cost Cost torepair in hours * number of defects found = Total cost of repair hours Analysis & Design Requirements Requirements Analysis & Design Build Test Deploy Run 1 Build 2 1 Test 3 2 1 Deploy 4 3 2 1 Run 5 4 3 2 1 Total 6 5 4 3 2 1 TOTAL COST The number of defects found (Chart 2) are multiplied by the weighted values (chart 1) then add all defect effort-hours (see rightmost column). This is the total effort-cost of defects for this version. This metric can be used to indicate improvements in version quality over time. 21 15 10 6 3 1 56
  • 7.
    Monetize • Once youarrive at the total cost in hours you need to develop an average person cost rate • If the cost rate for a person-hour is $100 and the version defect cost was 56 hours, • The version defect cost is $56,000 • Improving the early detection of errors may seem expensive, but defects add up to real costs.