Downloaded 138 times

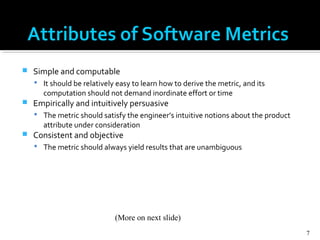

![1. Count the measurement parameters.
2. Assess the complexity of the values.
3. Calculate the raw FP (see next table).
4. Rate the complexity factors to produce the
complexity adjustment value (CAV)
5. Calculate the adjusted FP as follows:
FP = raw FP x [0.65 + 0.01 x CAV]](https://image.slidesharecdn.com/softwaremetrics-160504052135/85/Software-metrics-20-320.jpg)


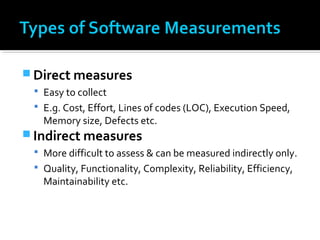
The document outlines the importance of software metrics in evaluating software quality, productivity, and the effectiveness of engineering methods. It details the measurement process, including the formulation, collection, analysis, and interpretation of metrics, while categorizing metrics into process, product, and project metrics. Additionally, it discusses normalization methods, direct and indirect measures, and introduces the function point metric as a means to assess software functionality.