Downloaded 208 times


![11
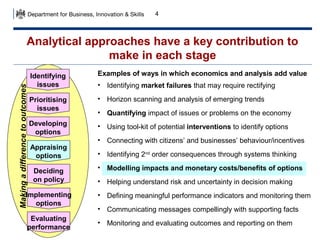
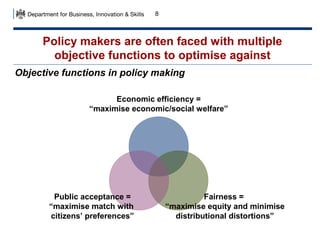
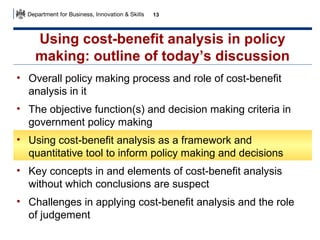
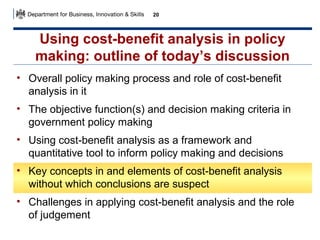
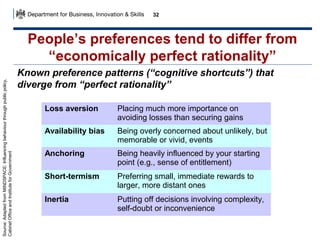
Economic welfare is not exactly the same as GDP or
growth – but is related
Very roughly (!) Economic welfare = GDP + consumer surplus +/- externalities
Price level
Aggregate
demand
Prices of labour,
goods and services
Aggregate
supply
Consumer
surplus
GDP [at prevailing prices,
taxes and subsidies]
Output
Quantity of goods and
services bought and sold
* Nominal growth – where nominal GDP grows because prices of labour, goods and services increase (inflation) – does not increase employment, living
standards or the Government’s fiscal position (and therefore ability to offer public services); real growth (which strips out inflation) is the appropriate policy goal](https://image.slidesharecdn.com/costbenefitanalysisinpolicymakingta181113-131118102503-phpapp02/85/Cost-benefit-analysis-in-policy-making-ta-181113-11-320.jpg)
![14
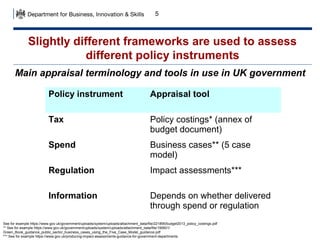
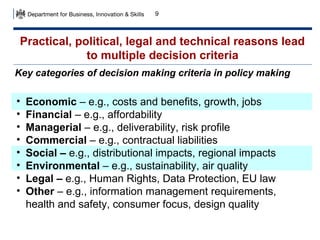
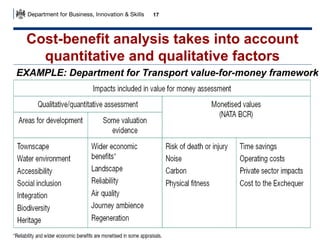
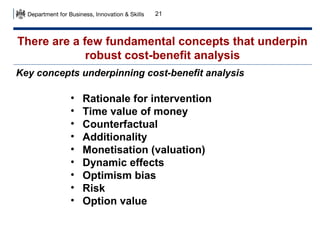
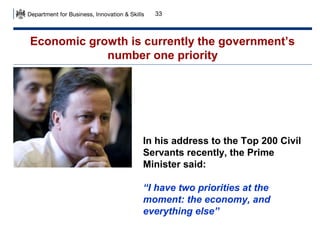
As mentioned, economic welfare is one of
several considerations in decision making
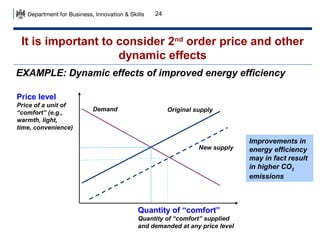
EXAMPLE: Department for Transport decision framework [1/3]](https://image.slidesharecdn.com/costbenefitanalysisinpolicymakingta181113-131118102503-phpapp02/85/Cost-benefit-analysis-in-policy-making-ta-181113-14-320.jpg)
![15
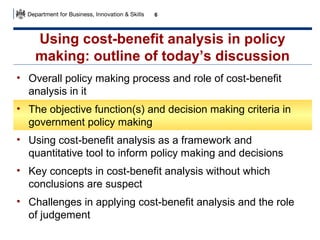
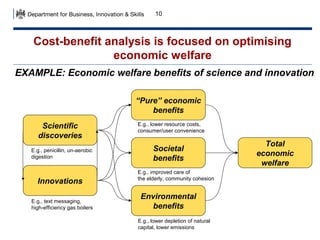
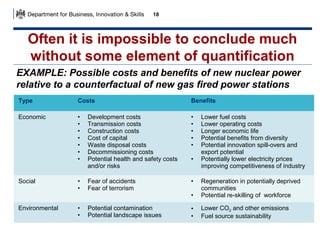
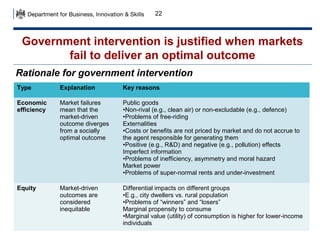
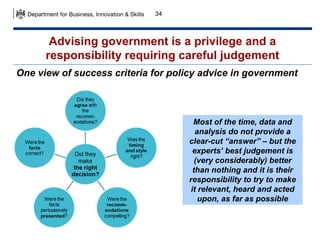
As mentioned, economic welfare is one of
several considerations in decision making
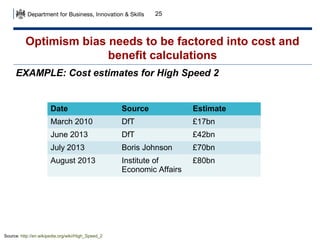
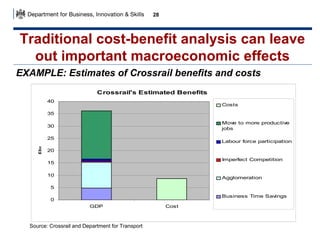
EXAMPLE: Department for Transport decision framework [2/3]](https://image.slidesharecdn.com/costbenefitanalysisinpolicymakingta181113-131118102503-phpapp02/85/Cost-benefit-analysis-in-policy-making-ta-181113-15-320.jpg)
![16
As mentioned, economic welfare is one of
several considerations in decision making
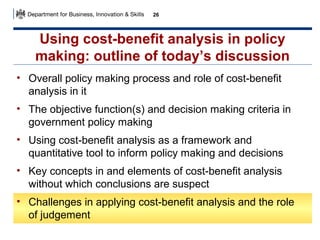
EXAMPLE: Department for Transport decision framework [3/3]](https://image.slidesharecdn.com/costbenefitanalysisinpolicymakingta181113-131118102503-phpapp02/85/Cost-benefit-analysis-in-policy-making-ta-181113-16-320.jpg)

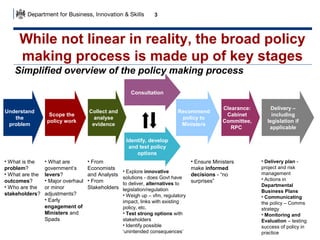
![37
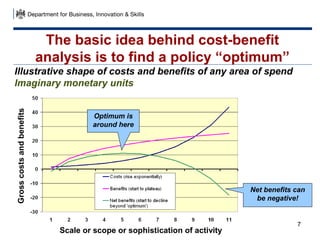
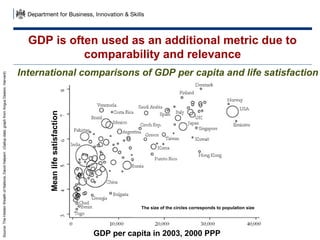
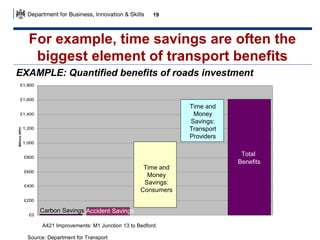
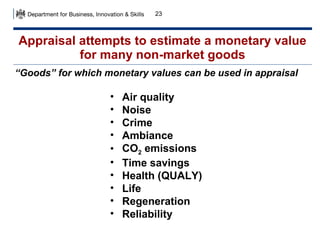
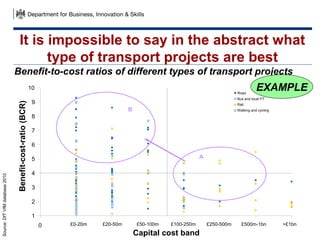
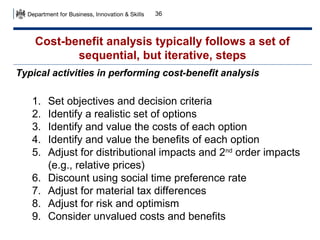
Meeting the PM’s challenge requires policy makers
to understand what drives growth
Labour
participation
Hours worked
per capita
GDP per capita
£ ‘000
GDP
£ billion
x
Population
m
x
Labour
productivity
£ GVA* per
hour worked
First-order drivers**
include:
•
•
•
•
•
•
•
•
•
•
Aggregate demand
Incentives to work
Cost of labour
Labour market
efficiency
Skills
Competition
Trade
Enterprise
Innovation
Investment
* GVA=Gross Value Added; value of outputs (price times quantity) minus value of inputs; when aggregated up across sectors and adjusted for taxes and
subsidies, adds up to total GDP [GDP = GVA + taxes on products/services – subsidies on products/services]
** Many of the drivers are interconnected (e.g., enterprise drives innovation; trade drives competition) and are themselves driven by other factors (e.g.,
investment is driven by business environment, including interest rates, taxes, regulataory environment, planning system, etc.)](https://image.slidesharecdn.com/costbenefitanalysisinpolicymakingta181113-131118102503-phpapp02/85/Cost-benefit-analysis-in-policy-making-ta-181113-37-320.jpg)

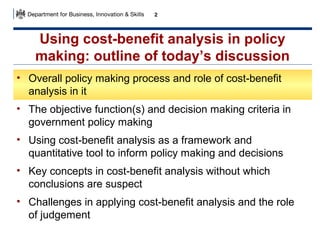
This document discusses using cost-benefit analysis in policy making. It outlines the overall policy making process and how cost-benefit analysis can inform it. Cost-benefit analysis aims to optimize economic welfare by quantifying the costs and benefits of policy options. However, policy makers consider multiple objectives and criteria in decisions. While cost-benefit analysis provides a framework, there are challenges in applying it due to uncertainties and difficulties quantifying all impacts. Judgement is still needed in policy making.