Download as PDF, PPTX


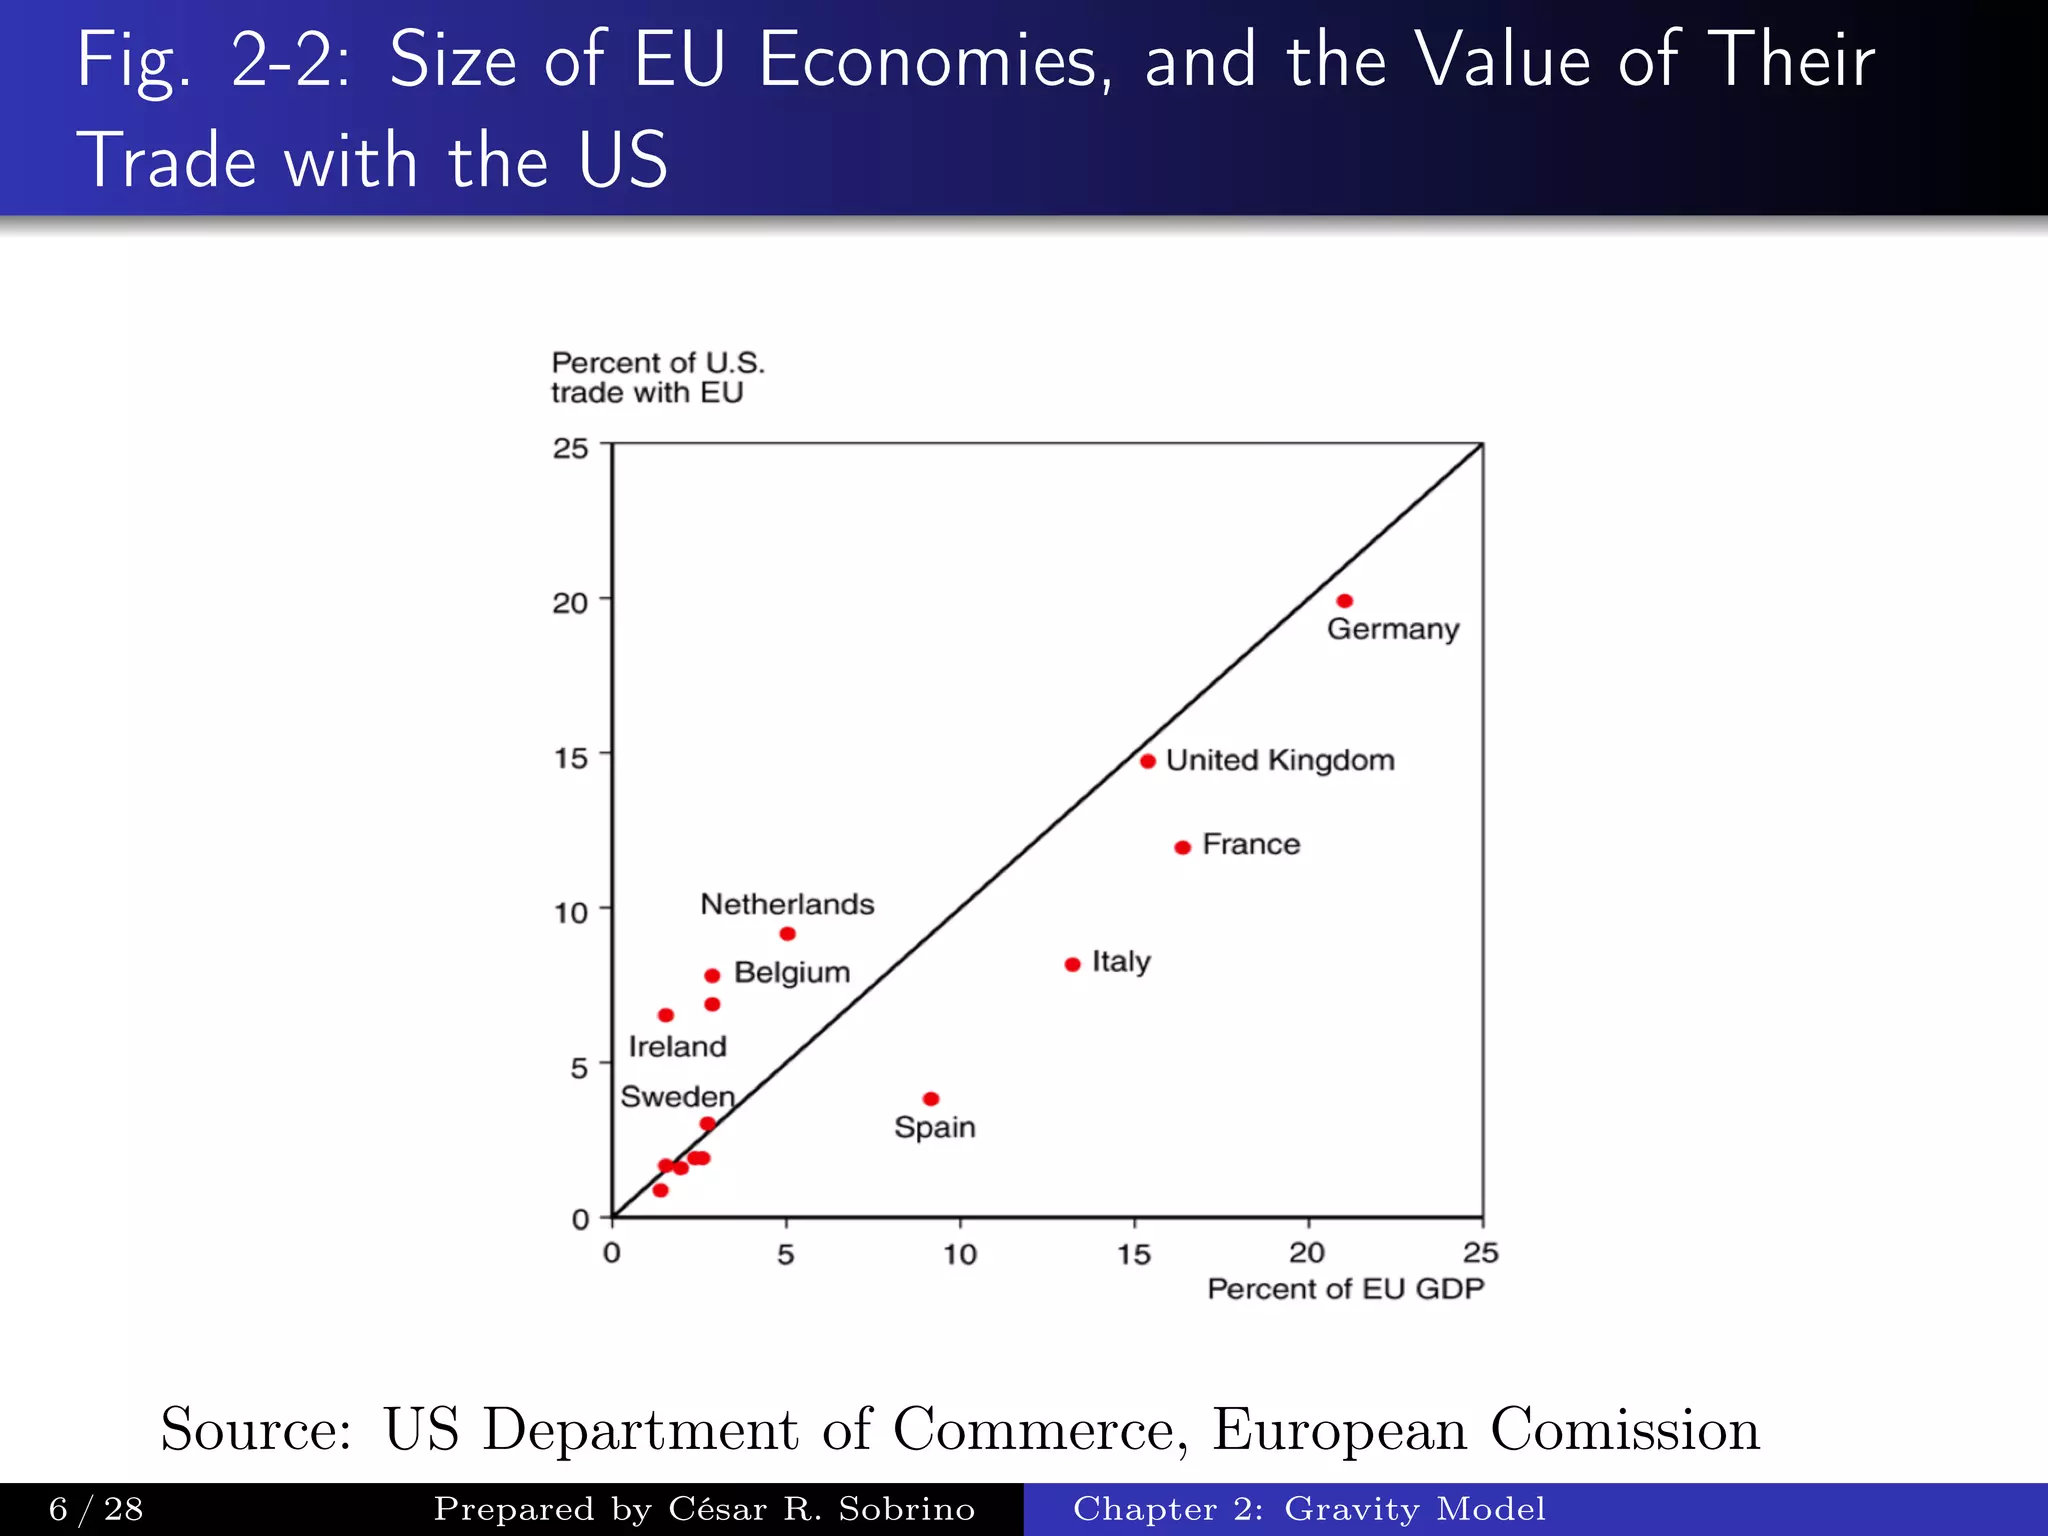

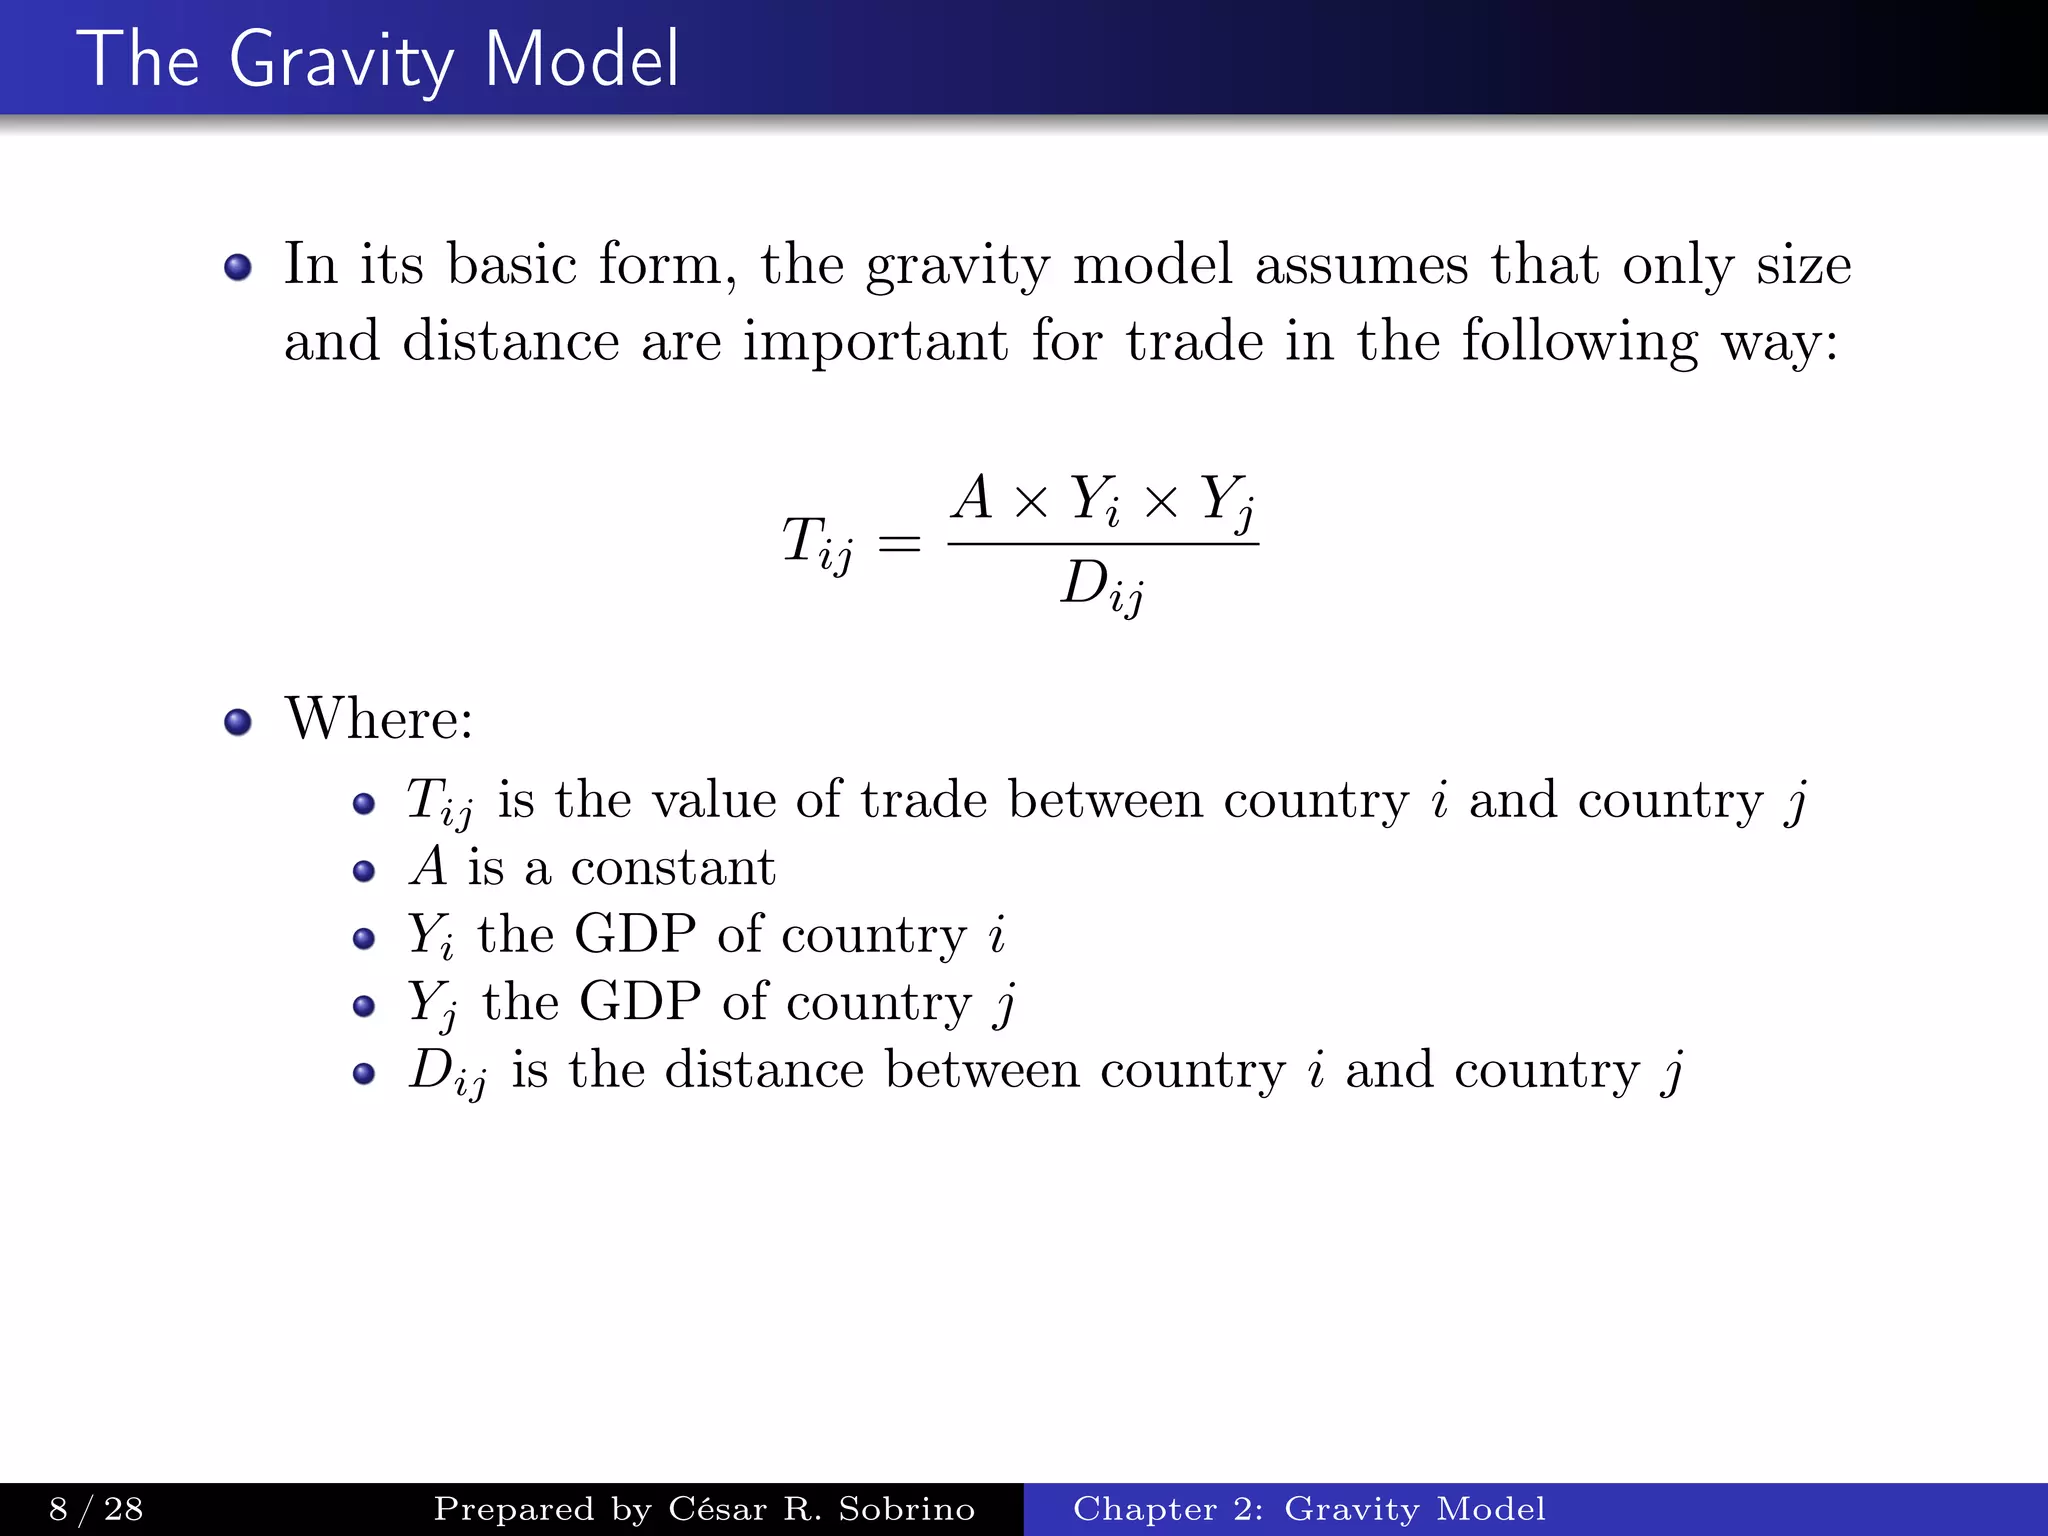
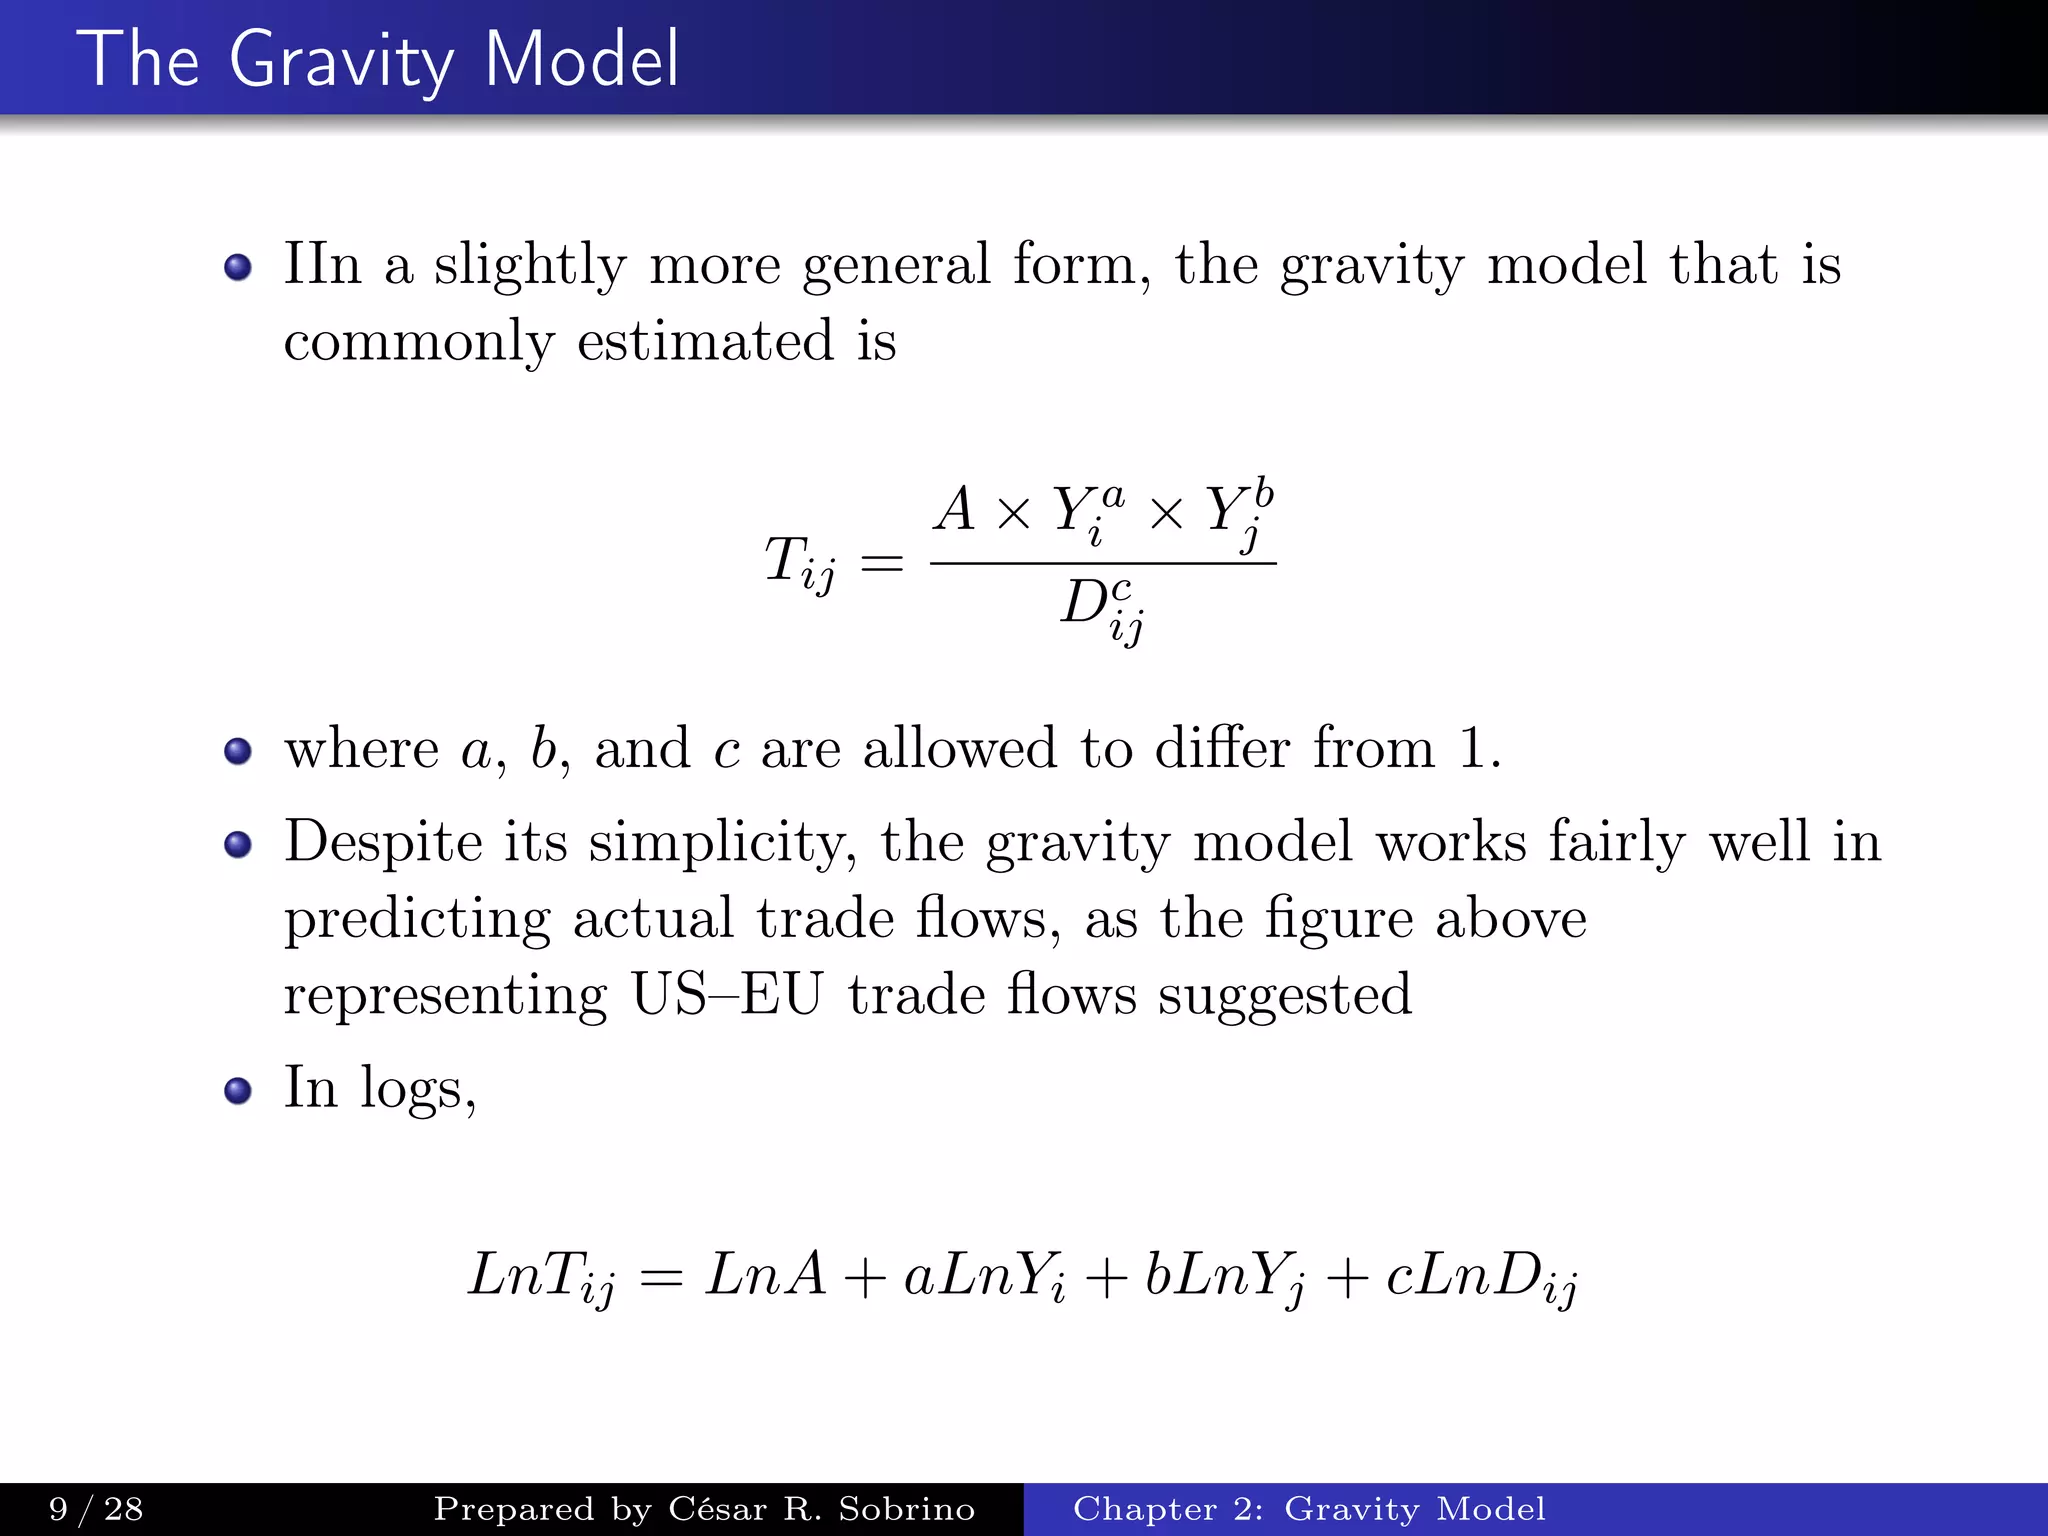


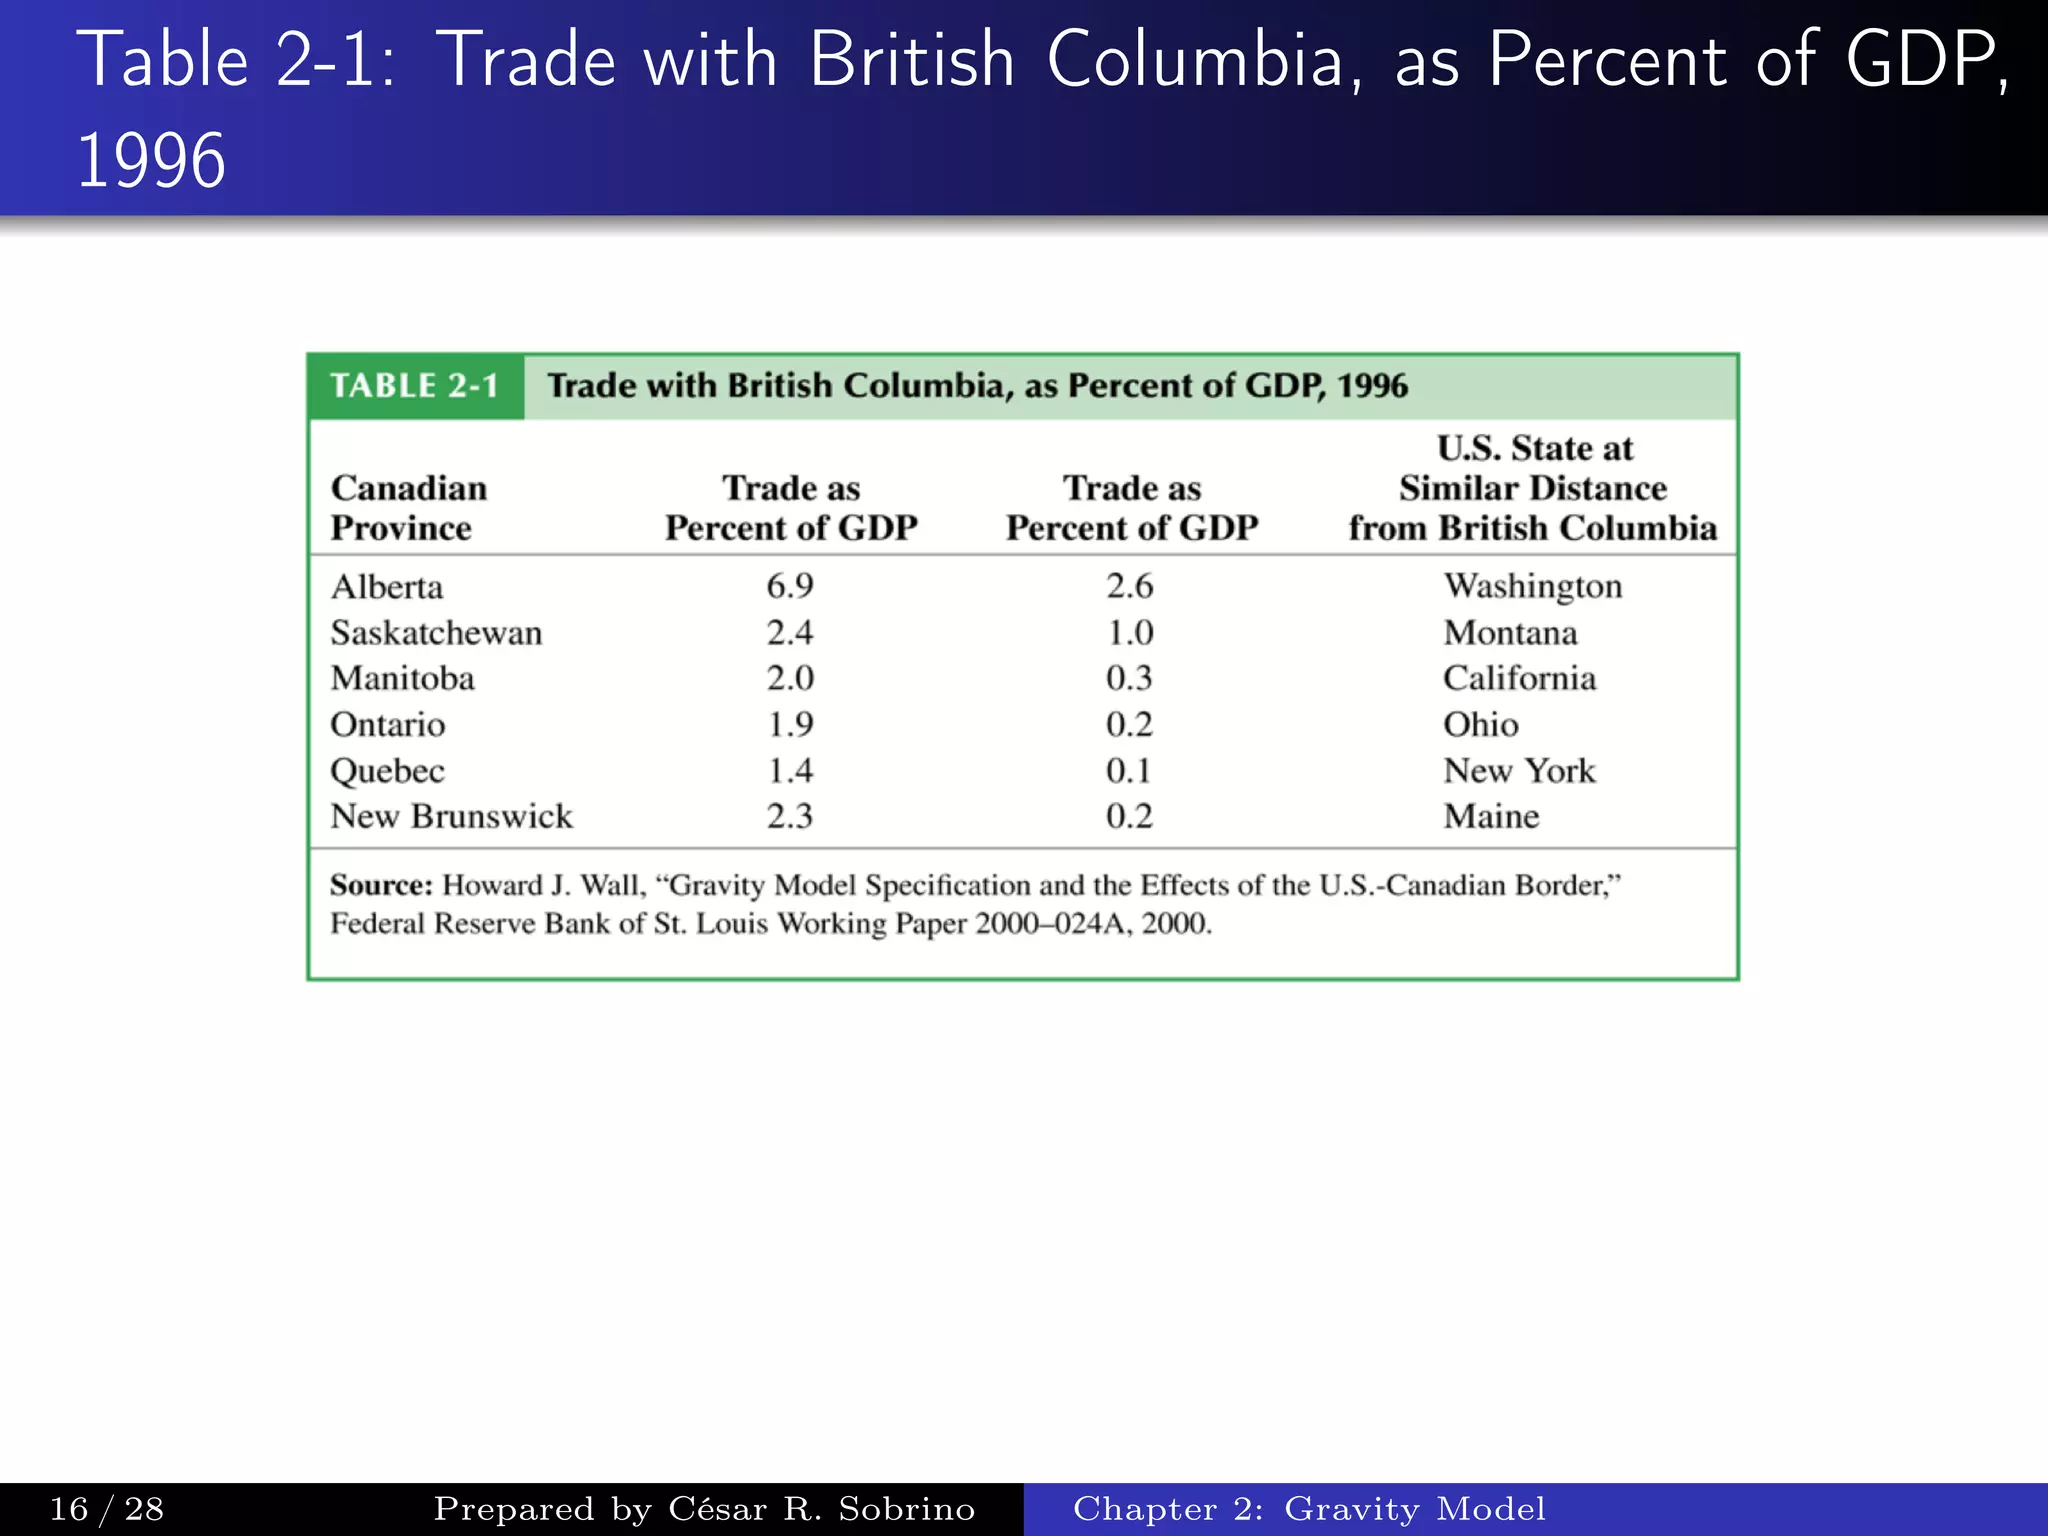


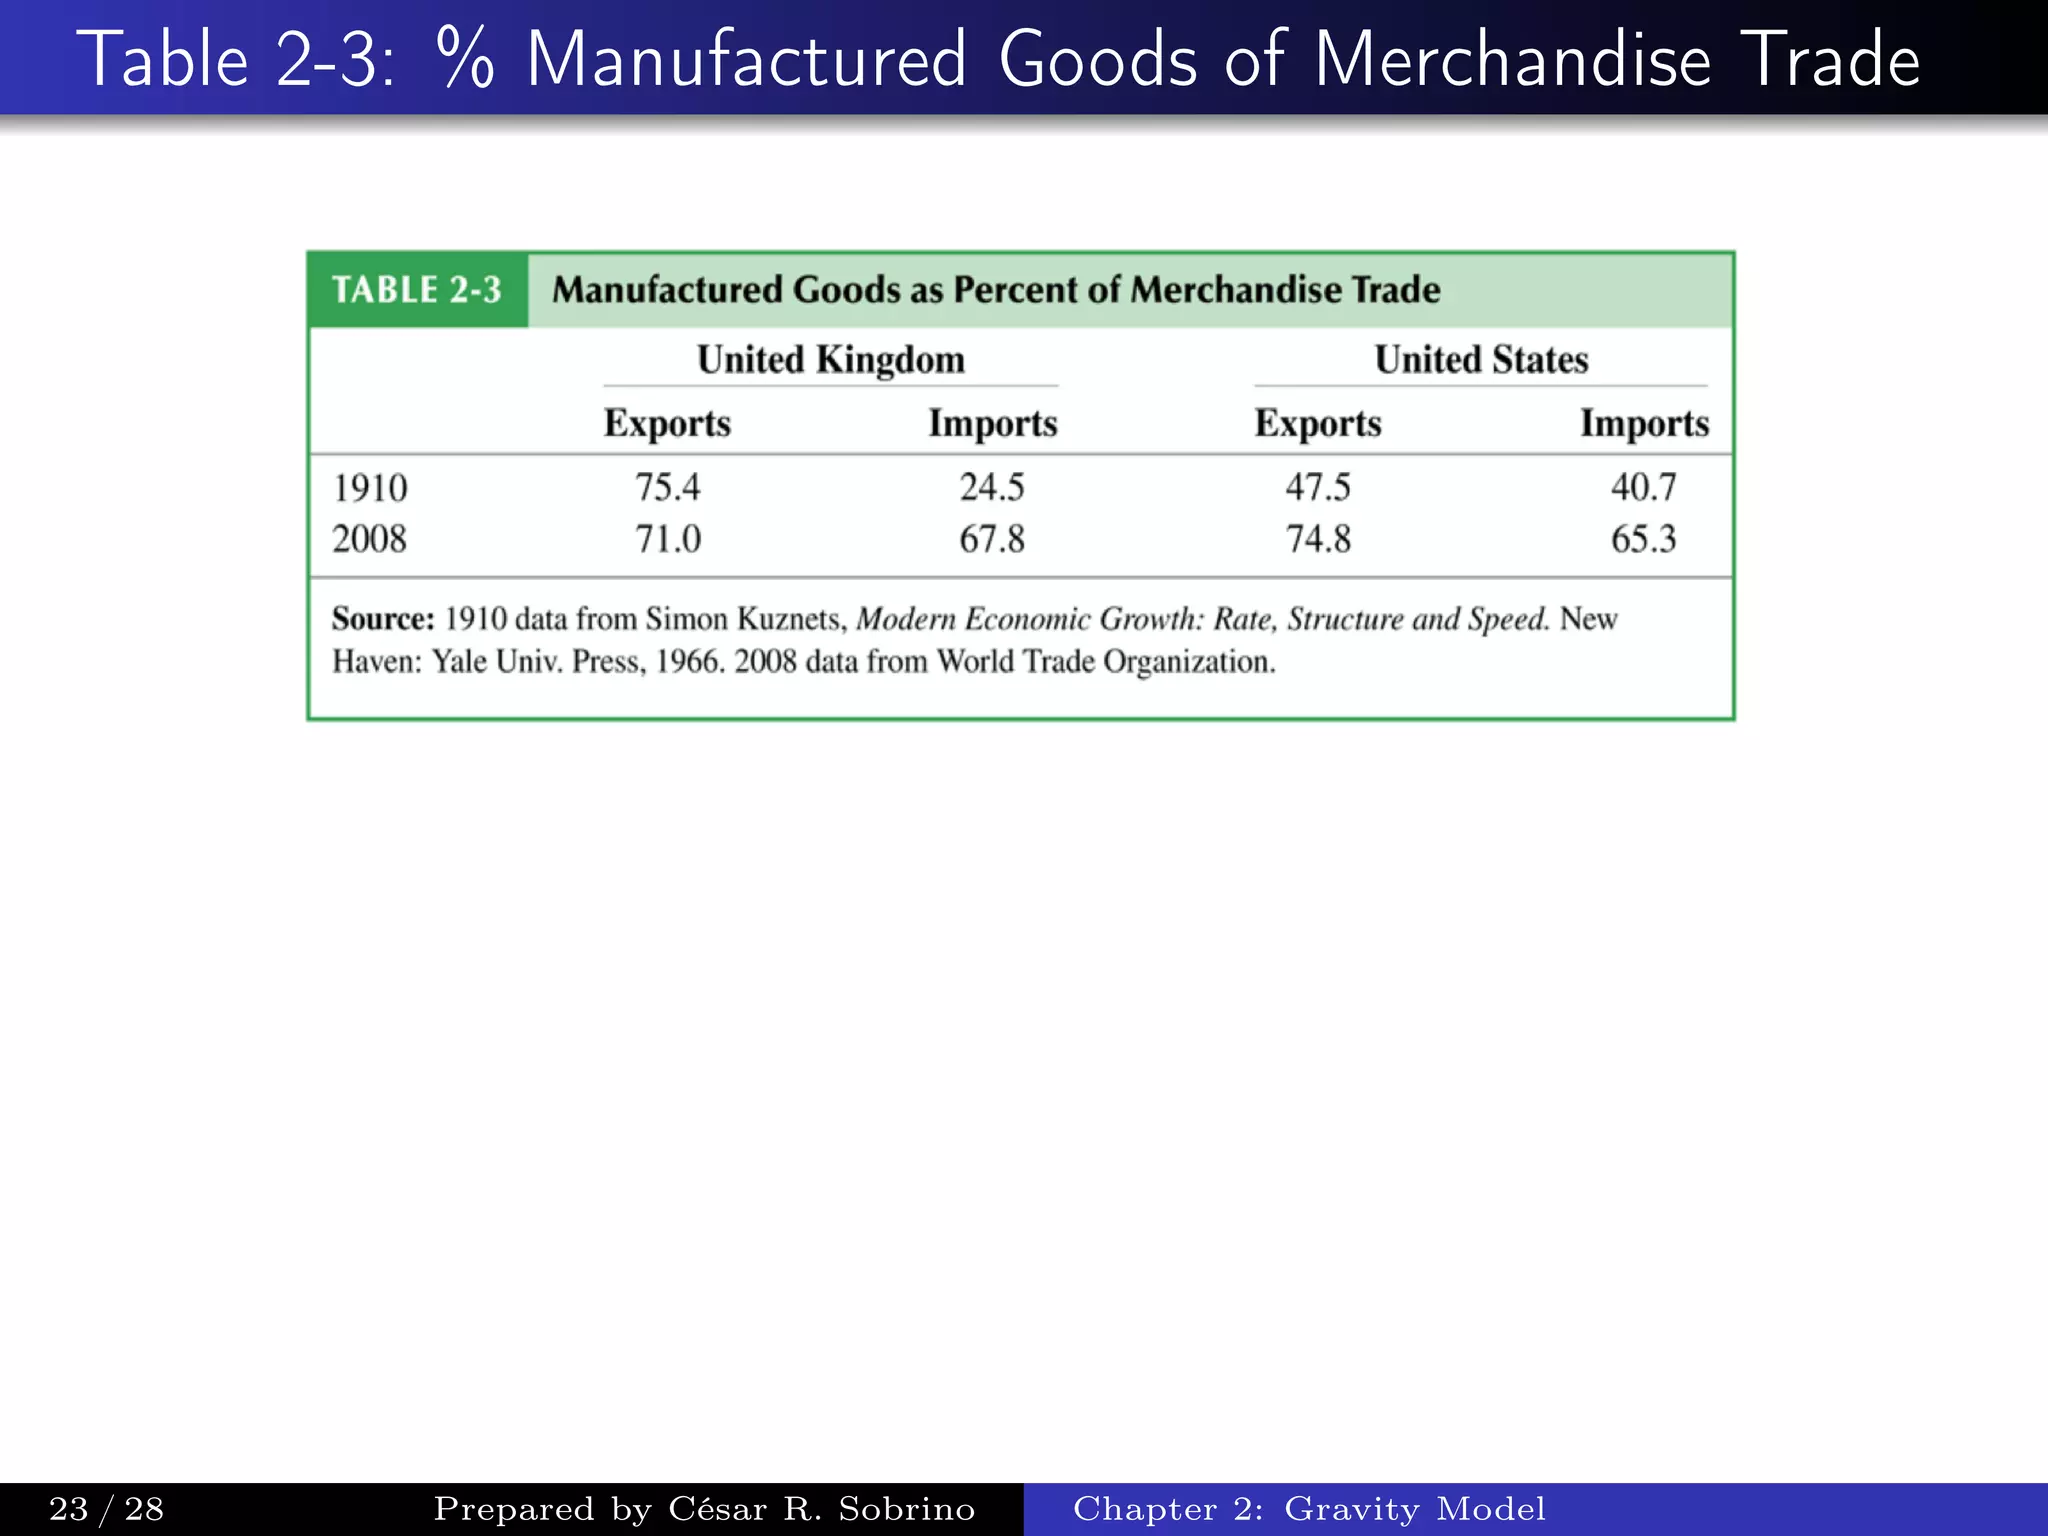
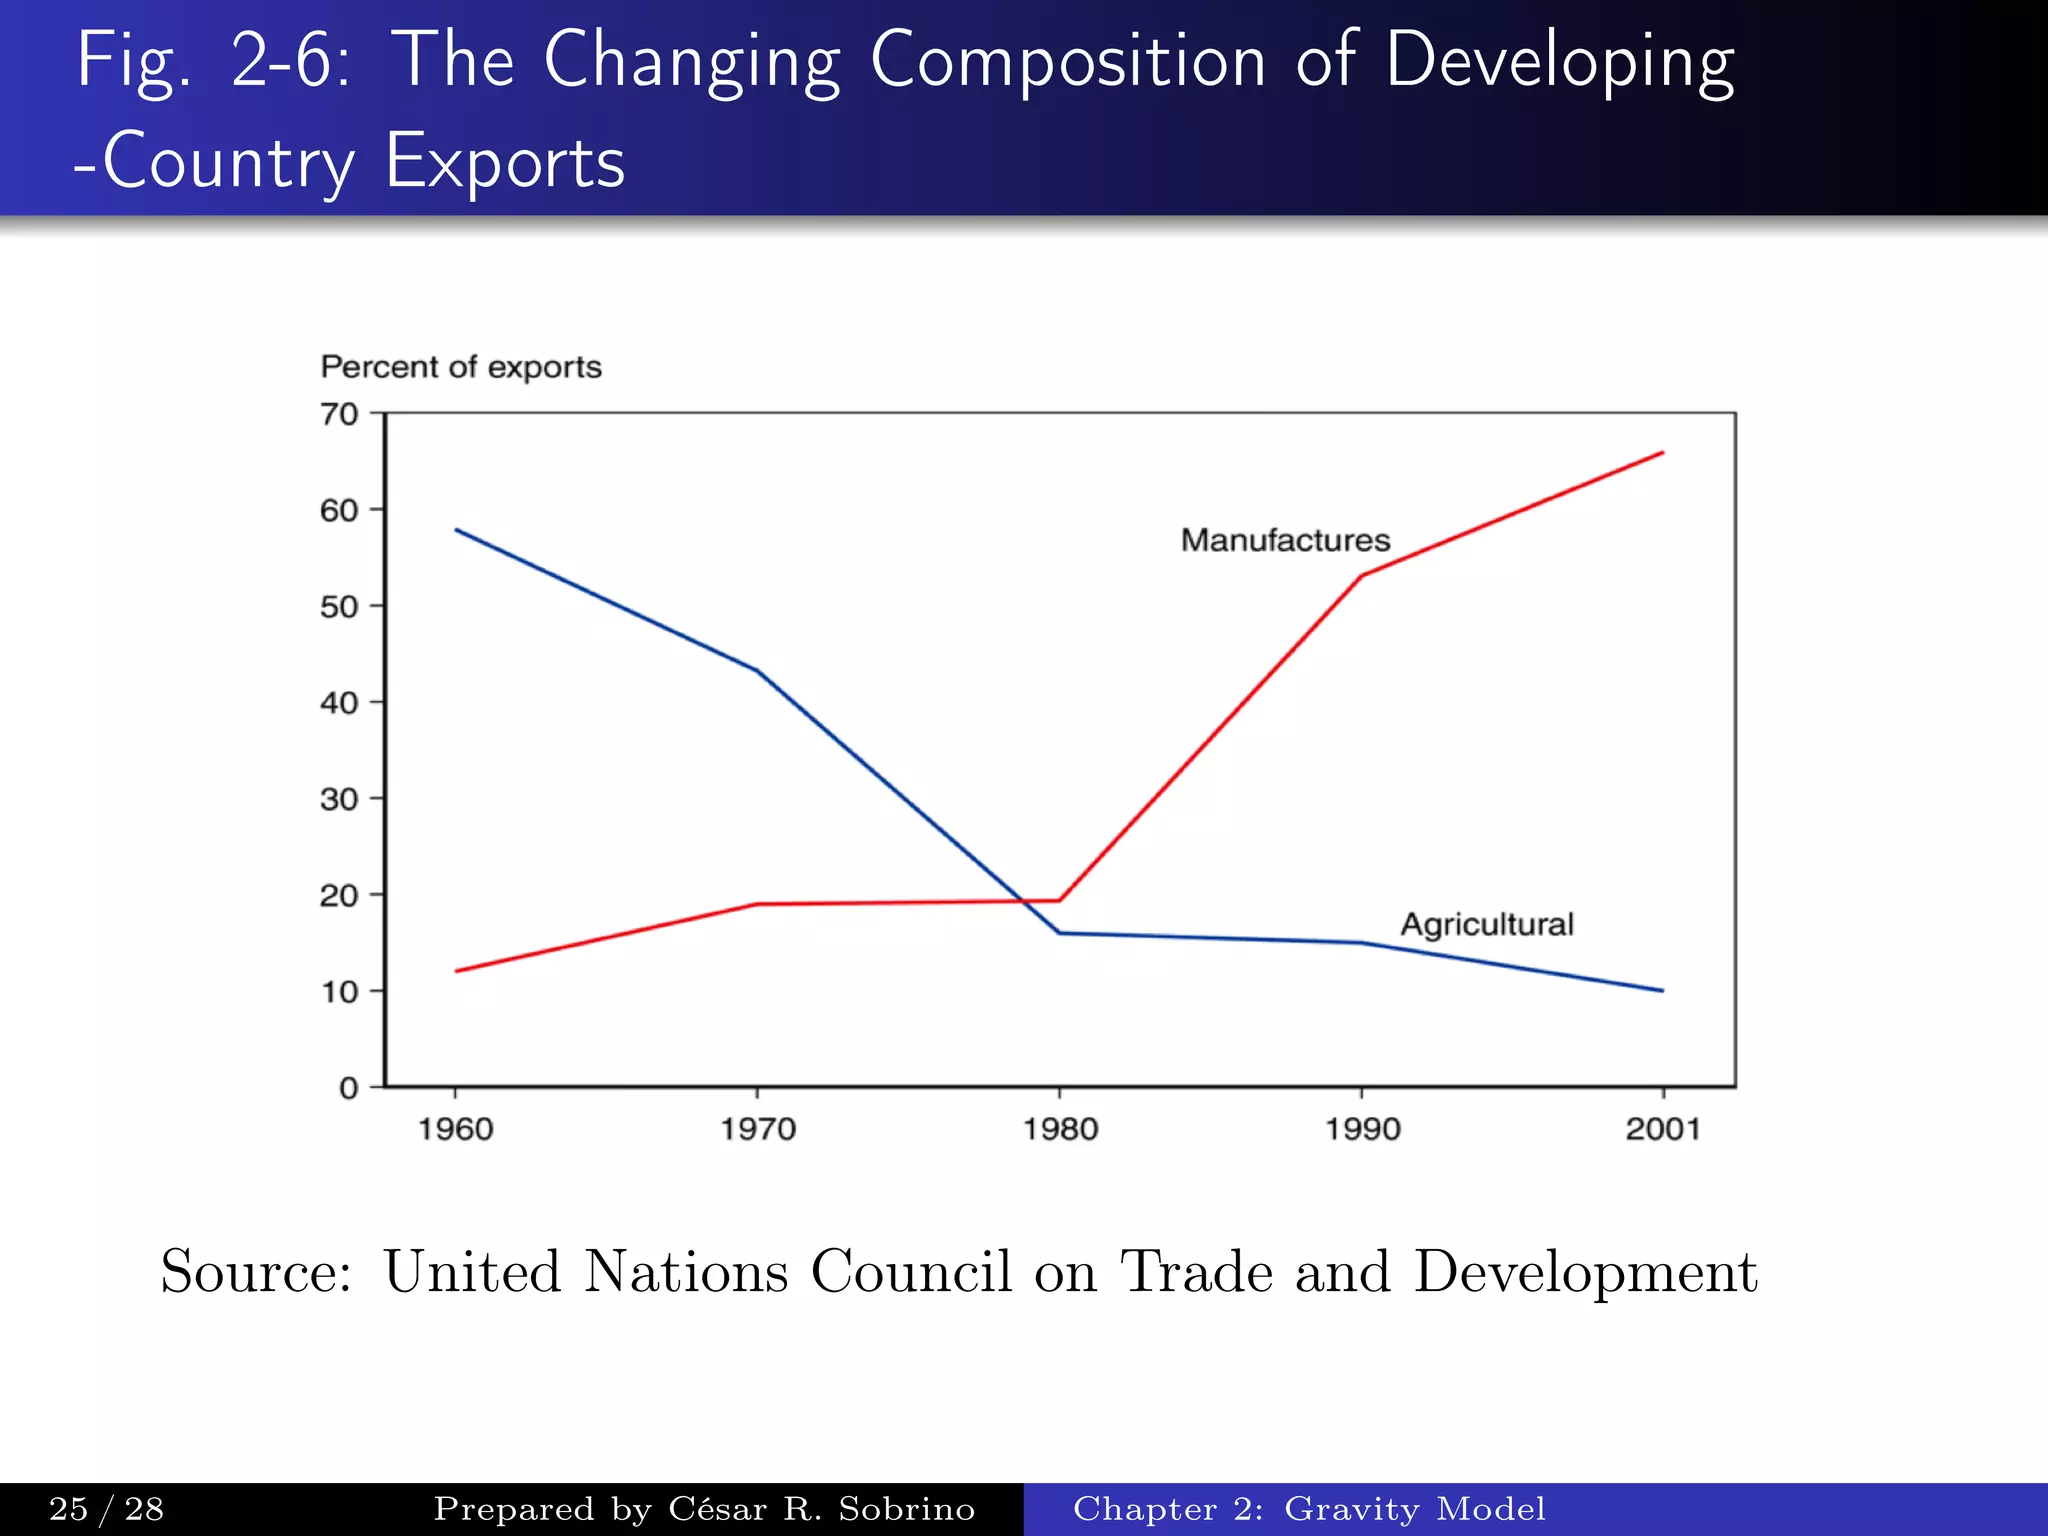


1. The document discusses the gravity model of international trade, which predicts that the volume of trade between two countries is directly related to their GDPs and inversely related to the distance between them. 2. It examines how the largest trading partners of the US are also economies with the largest GDPs in regions like the EU. 3. Over time, trade has shifted from being primarily agricultural and mineral goods to mostly manufactured goods, and distances have become less important due to advances in transportation and communication.


