Correlation and regression are statistical methods used to examine relationships between variables.
Correlation measures strength and direction of association.
Regression predicts the value of one variable based on another.
OVERVIEW
• Correlation andregression are statistical methods used
to examine relationships between variables.
• Correlation measures strength and direction of
association.
• Regression predicts the value of one variable based on
another.
3.
• Indicates thedegree to which two variables move together.
• Measured by the correlation coefficient, r, ranging from -1
to +1.
• Positive correlation: variables increase together.
• Negative correlation: one variable increases as the other
decreases.
CORRELATION EXPLAINED
4.
• Perfect positive(+1), perfect negative (-1), and no correlation
(0).
• Linear vs. non-linear correlation.
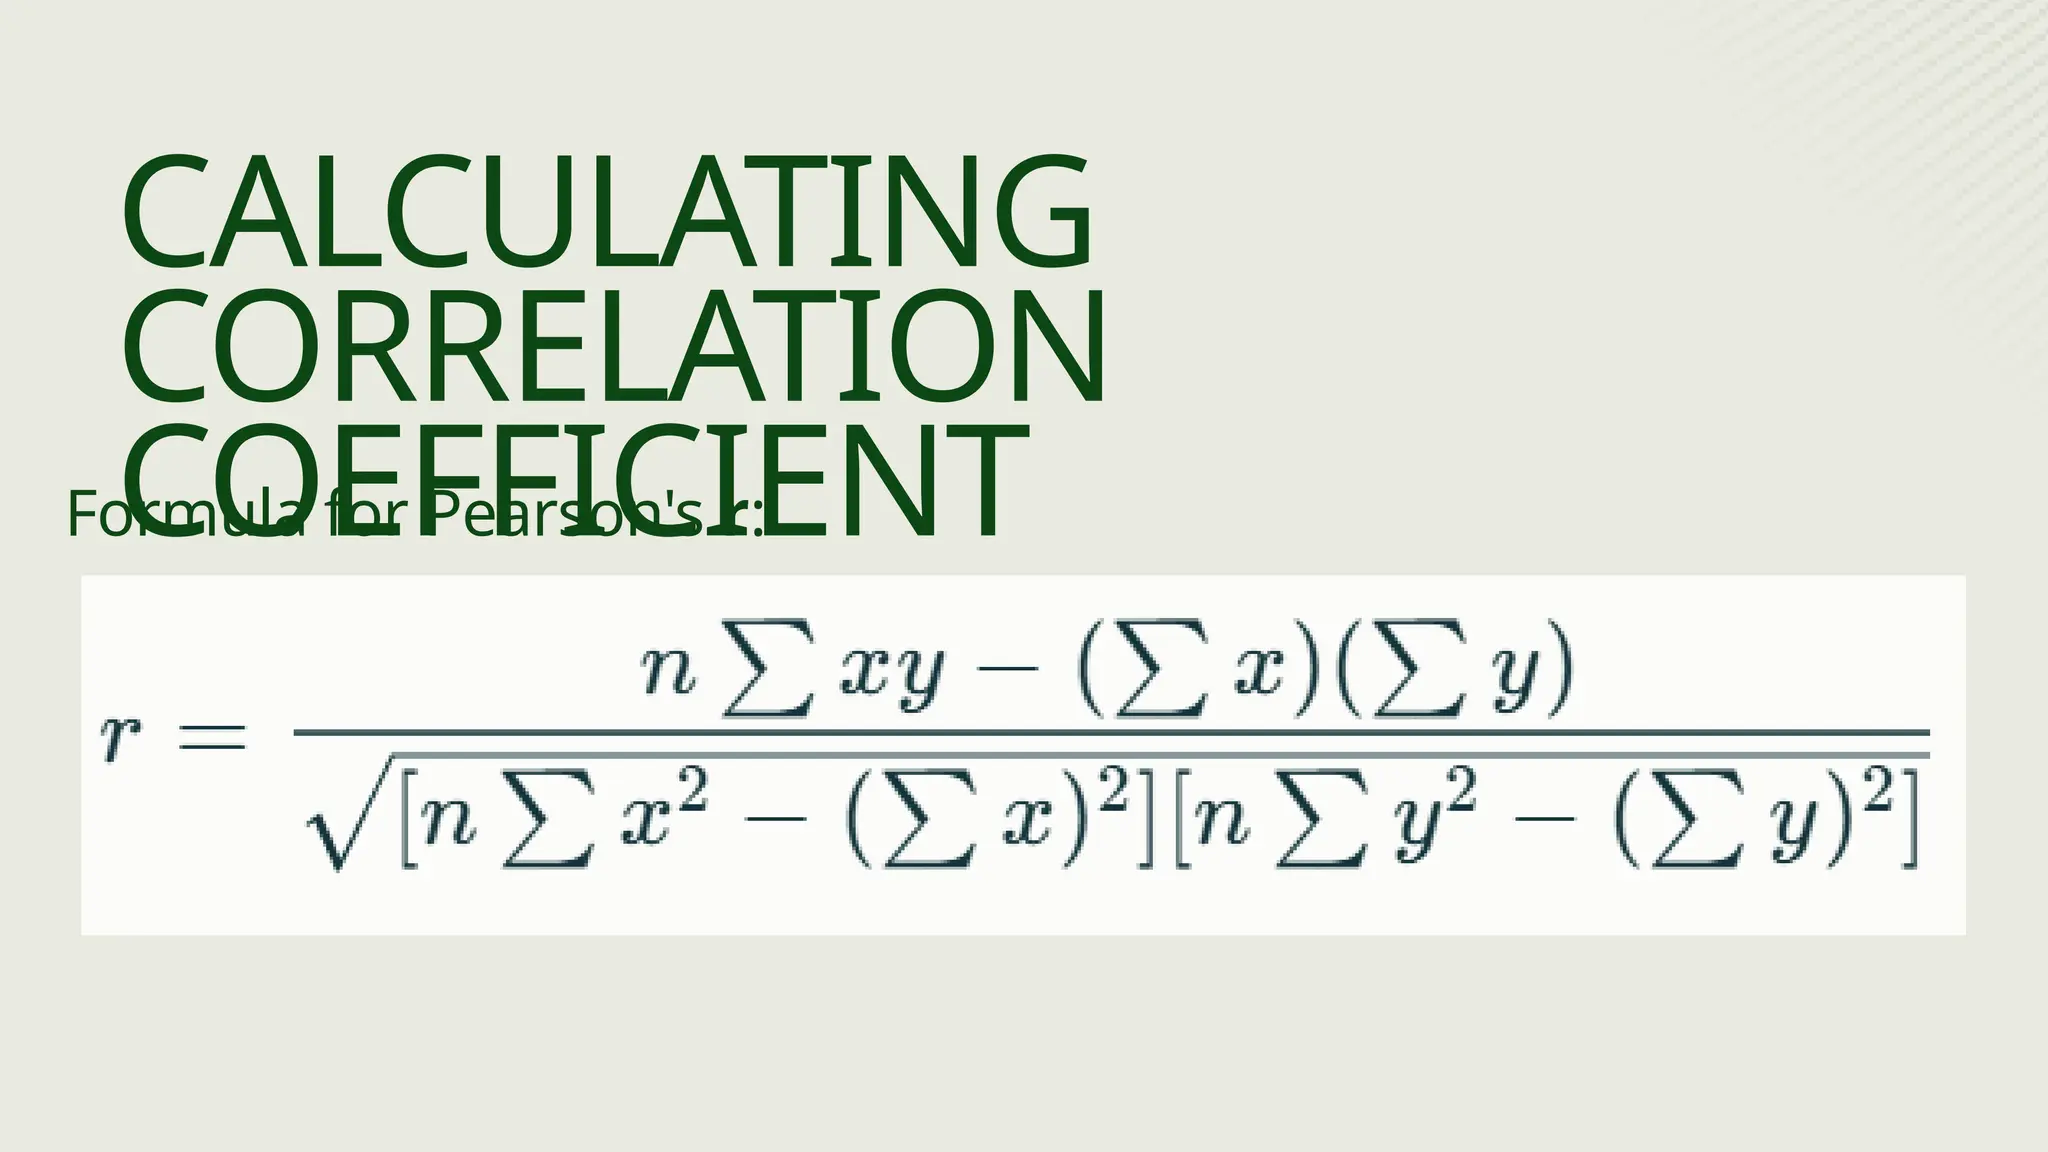
• Pearson’s correlation for linear relationships.
TYPES OF CORRELATION
Example: Height and weight show strong positive correlation.
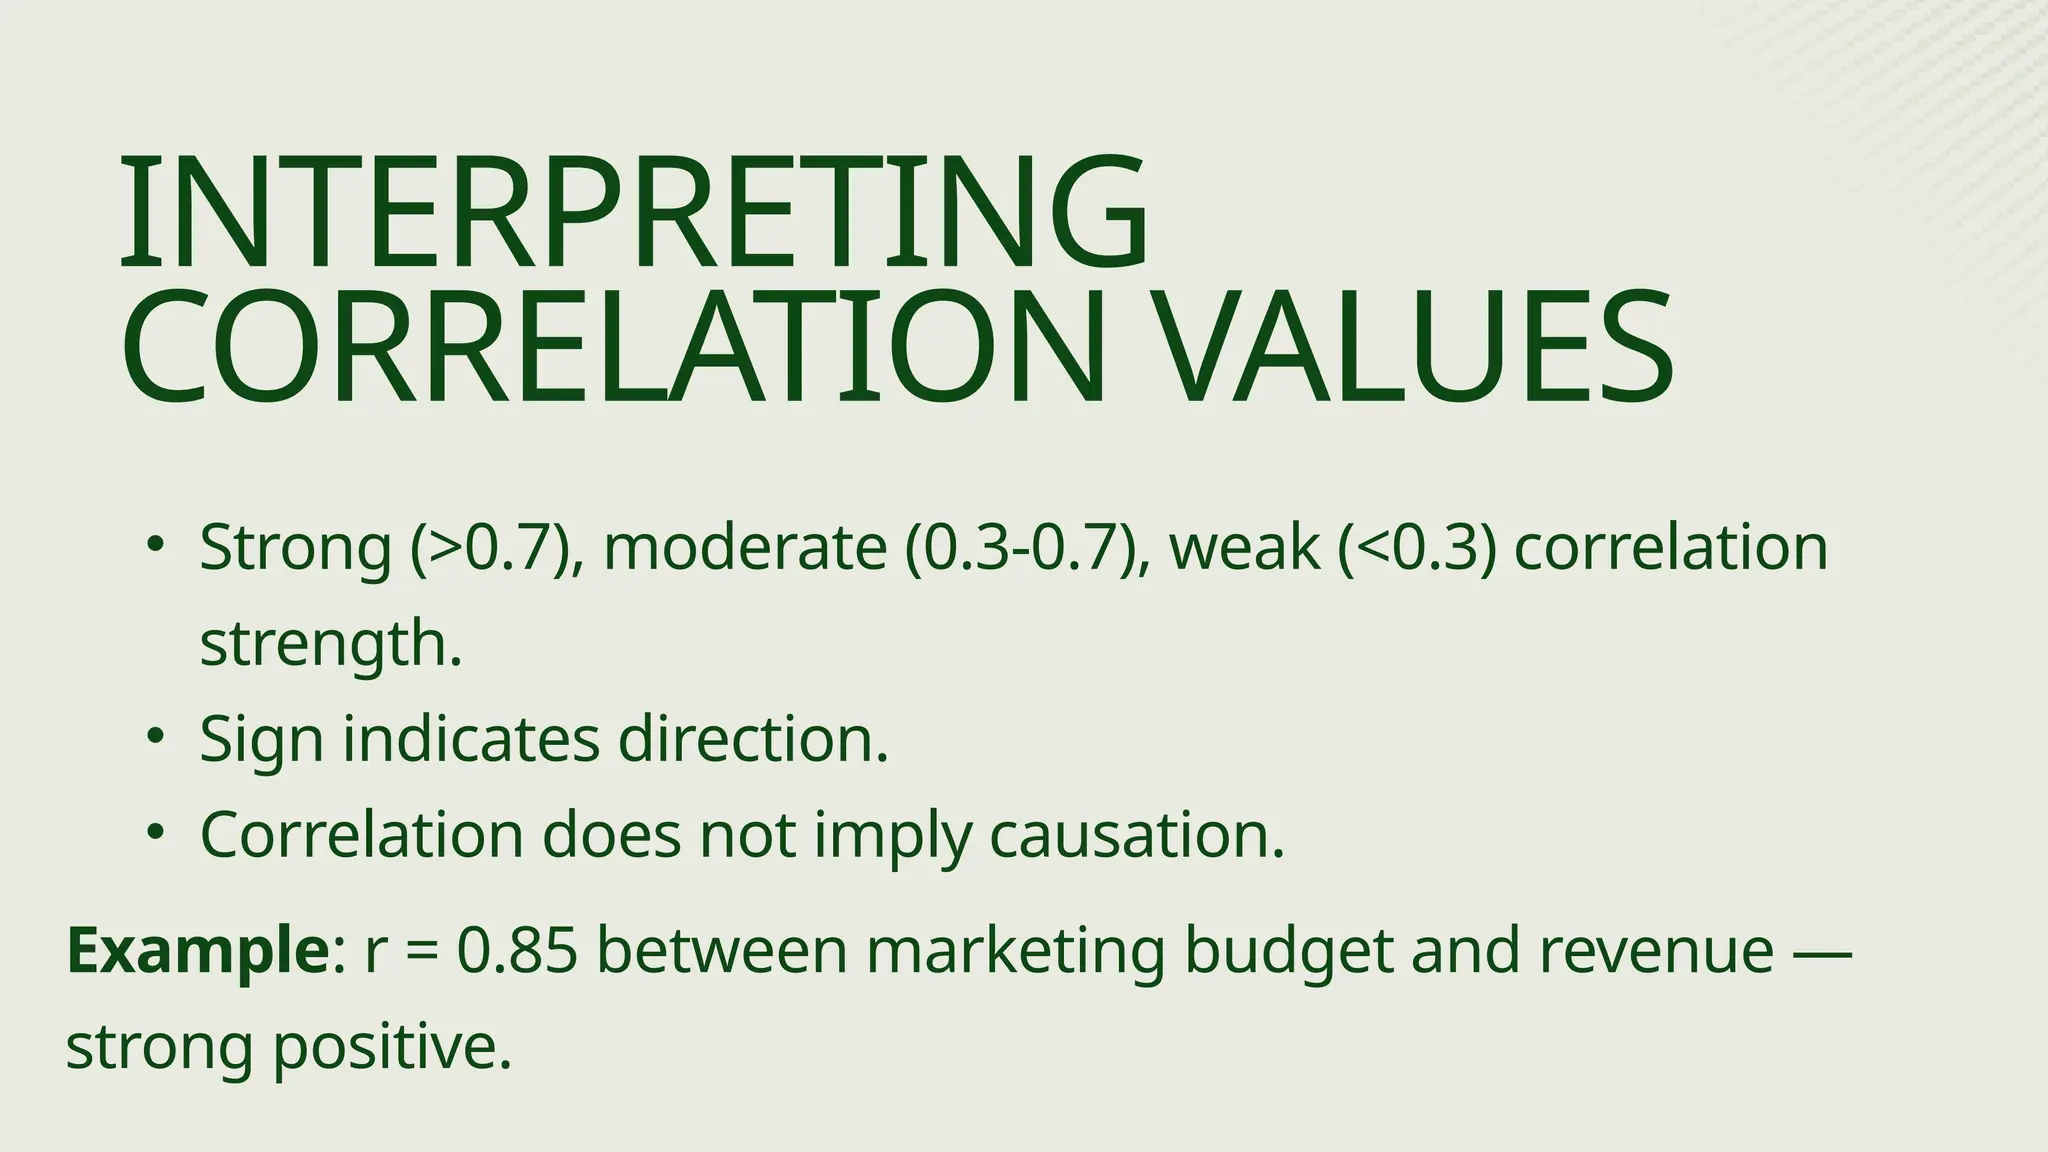
• Strong (>0.7),moderate (0.3-0.7), weak (<0.3) correlation
strength.
• Sign indicates direction.
• Correlation does not imply causation.
INTERPRETING
CORRELATION VALUES
Example: r = 0.85 between marketing budget and revenue —
strong positive.
7.
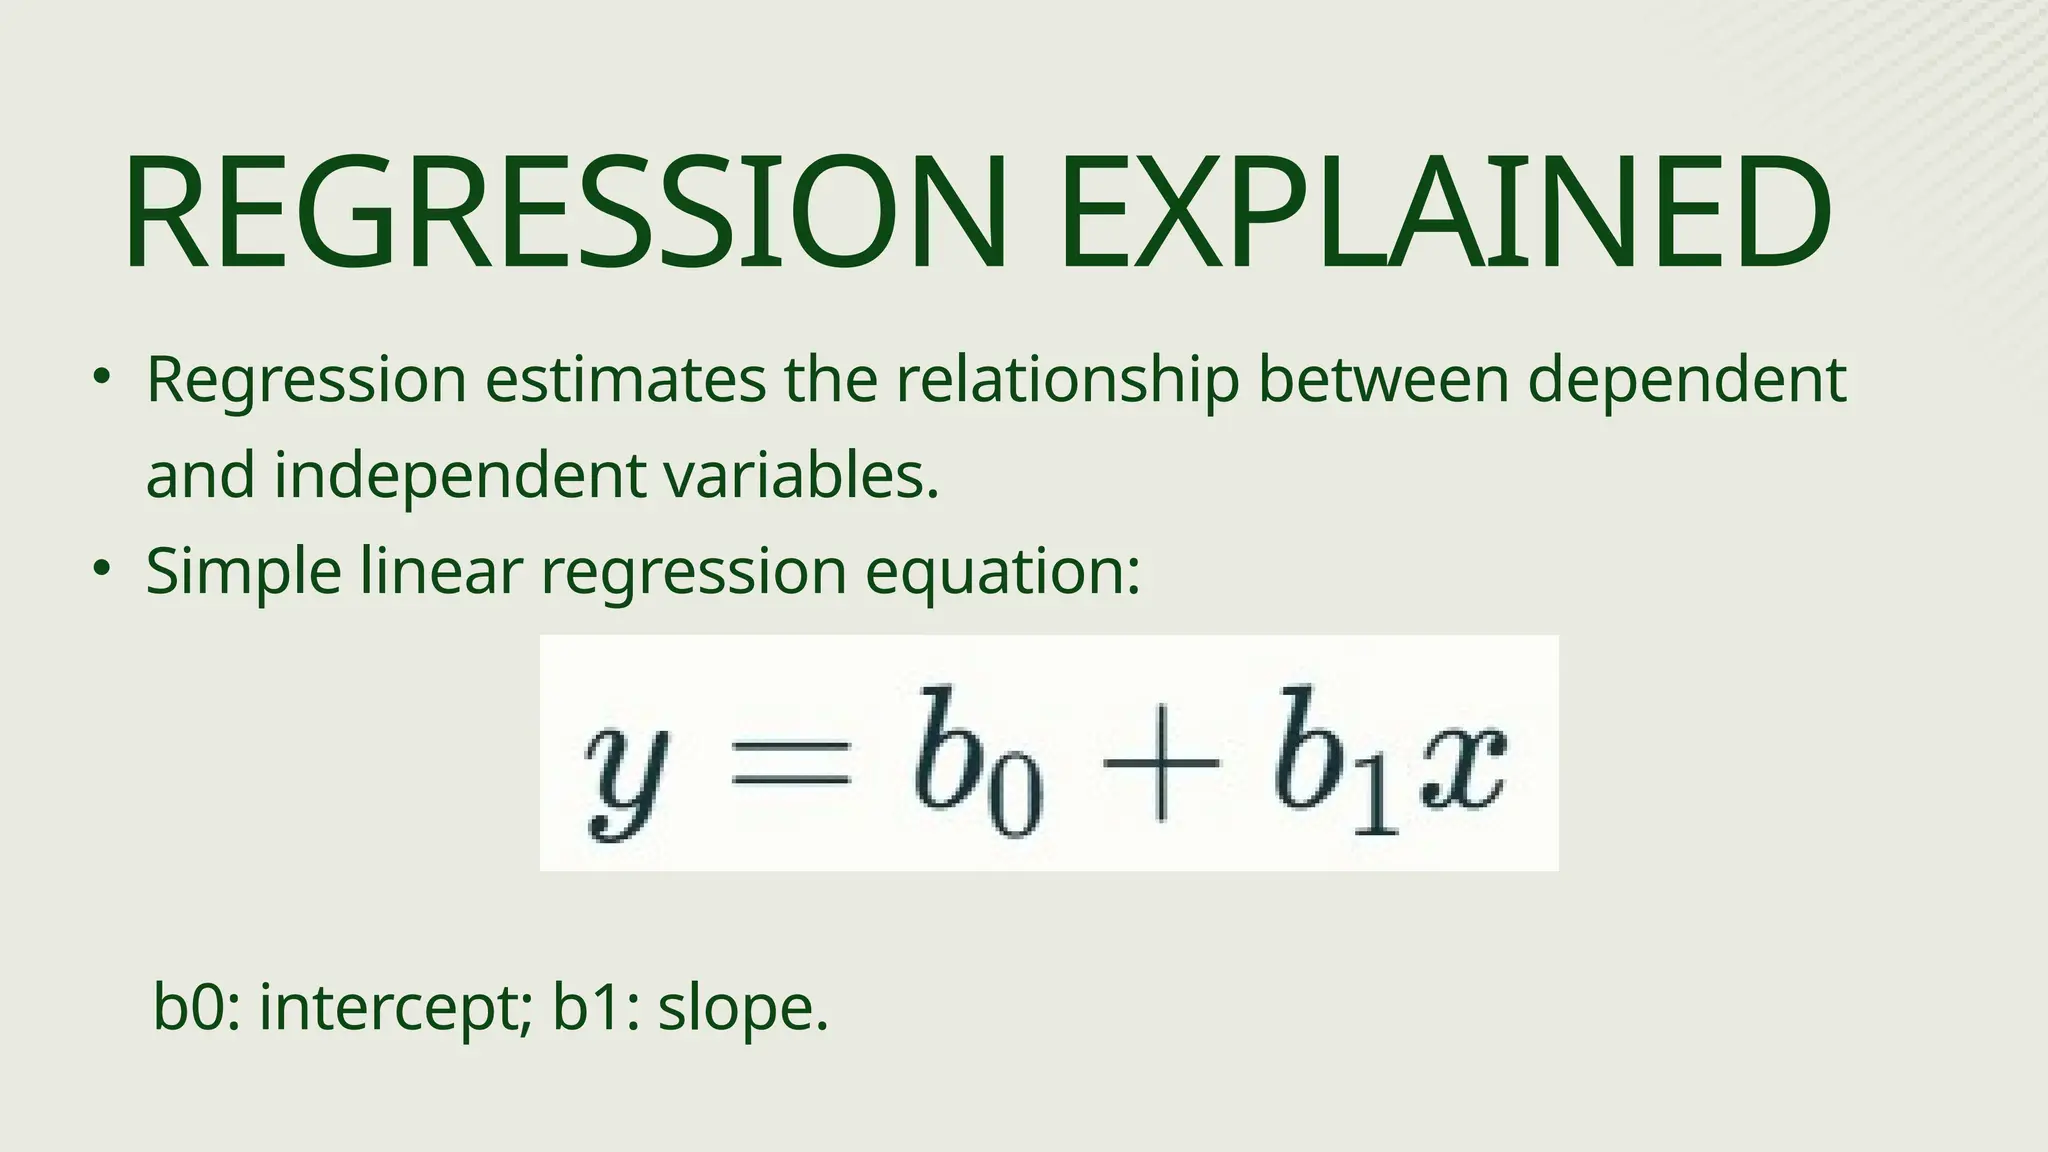
• Regression estimatesthe relationship between dependent
and independent variables.
• Simple linear regression equation:
REGRESSION EXPLAINED
b0: intercept; b1: slope.
8.
• b1 representschange in y for one unit change in x.
• b0 is the predicted value when x=0.
UNDERSTANDING
REGRESSION
COEFFICIENTS
Example: Predict sales (y) based on advertising spend (x).
9.
• Linear relationshipbetween variables.
• Homoscedasticity: constant variance of errors.
• Normally distributed residuals.
ASSUMPTIONS IN
REGRESSION
10.
• Sales forecastingbased on advertising spend.
• Risk assessment and portfolio analysis.
• Customer behavior prediction.
APPLICATIONS IN
BUSINESS AND FINANCE
11.
• Correlation measuresstrength and direction of
relationship.
• Regression models and predicts dependent
variables.
• Both are fundamental tools in data-driven
decision-making.
SUMMARY AND
CONCLUSION