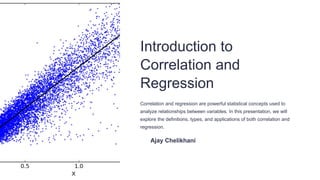
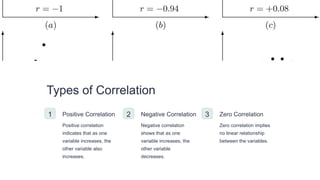
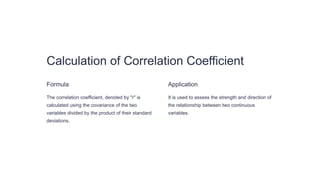
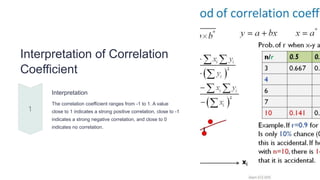
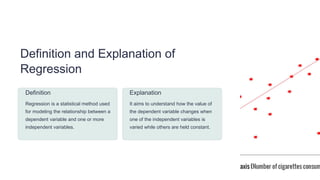
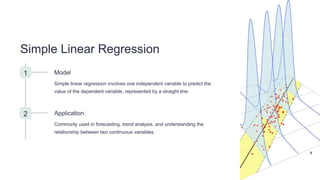
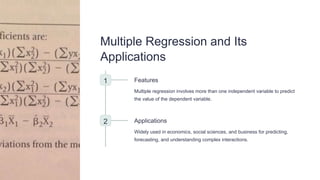
Introduction to
Correlation and
Regression
Correlation and regression are powerful statistical concepts used to
analyze relationships between variables. In this presentation, we will
explore the definitions, types, and applications of both correlation and
regression.
Ajay Chelikhani
Definition and Explanation of Correlation
Definition
Correlation is a statistical measure that describes
the strength and direction of a relationship
between two variables. It quantifies how much
two variables change together.
Explanation
Correlation explains how changes in one variable
are associated with changes in another. It is used
to identify the degree to which variables are
related and whether this relationship is positive,
negative, or zero.
Types of Correlation
1 Positive Correlation
Positive correlation
indicates that as one
variable increases, the
other variable also
increases.
2 Negative Correlation
Negative correlation
shows that as one
variable increases, the
other variable
decreases.
3 Zero Correlation
Zero correlation implies
no linear relationship
between the variables.
Calculation of Correlation Coefficient
Formula
The correlation coefficient, denoted by "r" is
calculated using the covariance of the two
variables divided by the product of their standard
deviations.
Application
It is used to assess the strength and direction of
the relationship between two continuous
variables.
Interpretation of Correlation
Coefficient
Interpretation
The correlation coefficient ranges from -1 to 1. A value
close to 1 indicates a strong positive correlation, close to -1
indicates a strong negative correlation, and close to 0
indicates no correlation.
Definition and Explanation of
Regression
Definition
Regression is a statistical method used
for modeling the relationship between a
dependent variable and one or more
independent variables.
Explanation
It aims to understand how the value of
the dependent variable changes when
one of the independent variables is
varied while others are held constant.
Simple Linear Regression
1 Model
Simple linear regression involves one independent variable to predict the
value of the dependent variable, represented by a straight line.
2 Application
Commonly used in forecasting, trend analysis, and understanding the
relationship between two continuous variables.
Multiple Regression and Its
Applications
1 Features
Multiple regression involves more than one independent variable to predict
the value of the dependent variable.
2 Applications
Widely used in economics, social sciences, and business for predicting,
forecasting, and understanding complex interactions.

Introduction-to-Correlation-and-Regression.pptx

  • 1.
    Introduction to Correlation and Regression Correlationand regression are powerful statistical concepts used to analyze relationships between variables. In this presentation, we will explore the definitions, types, and applications of both correlation and regression. Ajay Chelikhani
  • 2.
    Definition and Explanationof Correlation Definition Correlation is a statistical measure that describes the strength and direction of a relationship between two variables. It quantifies how much two variables change together. Explanation Correlation explains how changes in one variable are associated with changes in another. It is used to identify the degree to which variables are related and whether this relationship is positive, negative, or zero.
  • 3.
    Types of Correlation 1Positive Correlation Positive correlation indicates that as one variable increases, the other variable also increases. 2 Negative Correlation Negative correlation shows that as one variable increases, the other variable decreases. 3 Zero Correlation Zero correlation implies no linear relationship between the variables.
  • 4.
    Calculation of CorrelationCoefficient Formula The correlation coefficient, denoted by "r" is calculated using the covariance of the two variables divided by the product of their standard deviations. Application It is used to assess the strength and direction of the relationship between two continuous variables.
  • 5.
    Interpretation of Correlation Coefficient Interpretation Thecorrelation coefficient ranges from -1 to 1. A value close to 1 indicates a strong positive correlation, close to -1 indicates a strong negative correlation, and close to 0 indicates no correlation.
  • 6.
    Definition and Explanationof Regression Definition Regression is a statistical method used for modeling the relationship between a dependent variable and one or more independent variables. Explanation It aims to understand how the value of the dependent variable changes when one of the independent variables is varied while others are held constant.
  • 7.
    Simple Linear Regression 1Model Simple linear regression involves one independent variable to predict the value of the dependent variable, represented by a straight line. 2 Application Commonly used in forecasting, trend analysis, and understanding the relationship between two continuous variables.
  • 8.
    Multiple Regression andIts Applications 1 Features Multiple regression involves more than one independent variable to predict the value of the dependent variable. 2 Applications Widely used in economics, social sciences, and business for predicting, forecasting, and understanding complex interactions.