1. The document is a practice exam paper for Economics (AS) that contains 5 questions regarding the UK economy.
2. Question 1 defines inflation rate and asks about the effects of 4% inflation. Question 2 defines budget surplus and calculates the expected UK budget deficit for 2015-16.
3. Question 3 explains how unemployment can rise while employment increases and identifies the likely consequence of rising unemployment. The document contains exam questions and supporting information about the UK economy.
![Page 2 Edexcel Economics (AS) – Paper 2: Number 2
Mark scheme - Section A
Q1 The chart below shows the UK’s inflation rate between January 2005 and January 2015.
(a) Define the term ‘inflation rate’: [1 mark]
Knowledge 1
The percentage rate of change in the price index, usually annually
(b) Give one positive effect and one negative effect of an inflation rate of 4% in an economy. [2 marks]
Knowledge 2
Positive (1) – any positive effect, such as reduces the value of debt, usually accompanied by economic
growth / rising income if demand-pull, less harmful than deflation of 4%
Negative (1) – any negative effect, such as fall in real income reducing living standards, higher cost of
borrowing, risk of wage-price spirals, reduction in international competitiveness
(c) Which one of the following can be inferred from the table? [1 mark]
A Consumer prices rose over the whole period
B Consumer prices were at their highest in December 2008
C Consumer prices were at their lowest in January 2015
D Consumer prices were subject to deflation during the period
Answer A
(Total for Question 1 = 4 marks)
Jan 2005 Jan 2007 Jan 2009 Jan 2011 Jan 2013 Jan 2015
Per cent
6
5
4
3
2
1
0
Social protection - £232 billion
Personal social services - £30 billion
Health - £141 billion
Debt interest - £35 billion
Other (including EU transactions) - £48 billion
Public order and safety - £34 billion
Housing and environment - £28 billion
Industry, agriculture and employment - £24 billion
Defence - £45 billion
Education - £99 billion
Transport - £29 billion
Income tax - £170 billion
National insurance - £113 billion
Excise duties- £47 billion
Other (non-taxes) - £45 billion
Other (taxes) - £62 billion
Council tax - £28 billion
Business rates- £28 billion
VAT- £131 billion
Transport - £42 billion
Income tax - £170 billion
National insurance - £113 billion
cise duties- £47 billion
AveragepricelevelAveragepricelevel
Y Y1
P
P 1](https://image.slidesharecdn.com/msedexcelp2no2-170316084837/85/Mark-Scheme-edexcel-Practice-Paper-2-2-320.jpg)
![Edexcel Economics (AS) – Paper 2: Number 2 Page 3
Q2 The pie charts below give details of the UK government’s forecast for taxation revenue and spending
for the financial year 2015-2016. [1 mark]
(a) Define the term ‘budget surplus’: [1 mark]
Knowledge 1
Government tax receipts/income exceeds government spending
(b) Calculate the expected budget surplus or deficit expected in 2015-16. Show your workings: [2 marks]
Knowledge 1, Application 1
1 mark for calculating Total spending = £745bn and Total receipts = £666bn
1 mark for calculating difference between the two = 666 - 745 = -£79bn (i.e. a budget deficit)
Jan 2005 Jan 2007 Jan 2009 Jan 2011 Jan 2013 Jan 2015
5
4
3
2
1
0
Social protection - £232 billion
Personal social services - £30 billion
Health - £141 billion
Debt interest - £35 billion
Other (including EU transactions) - £48 billion
Public order and safety - £34 billion
Housing and environment - £28 billion
Industry, agriculture and employment - £24 billion
Defence - £45 billion
Education - £99 billion
Transport - £29 billion
Income tax - £170 billion
National insurance - £113 billion
Excise duties- £47 billion
Other (non-taxes) - £45 billion
Other (taxes) - £62 billion
Council tax - £28 billion
Business rates- £28 billion
VAT- £131 billion
Transport - £42 billion
Income tax - £170 billion
National insurance - £113 billion
cise duties- £47 billion
AveragepricelevelAveragepricelevel
Y
P
P 1
Jan 2005 Jan 2007 Jan 2009 Jan 2011 Jan 2013 Jan 2015
5
4
3
2
1
0
Social protection - £232 billion
Personal social services - £30 billion
Health - £141 billion
Debt interest - £35 billion
Other (including EU transactions) - £48 billion
Public order and safety - £34 billion
Housing and environment - £28 billion
Industry, agriculture and employment - £24 billion
Defence - £45 billion
Education - £99 billion
Transport - £29 billion
Income tax - £170 billion
National insurance - £113 billion
Excise duties- £47 billion
Other (non-taxes) - £45 billion
Other (taxes) - £62 billion
Council tax - £28 billion
Business rates- £28 billion
VAT- £131 billion
Transport - £42 billion
Income tax - £170 billion
National insurance - £113 billion
cise duties- £47 billion
AveragepricelevelAveragepricelevel
Y1
P
P 1
Chart 1:
Public sector
spending
2015-16
Chart 2: Public
sector receipts
2015-16](https://image.slidesharecdn.com/msedexcelp2no2-170316084837/85/Mark-Scheme-edexcel-Practice-Paper-2-3-320.jpg)
![Page 4 Edexcel Economics (AS) – Paper 2: Number 2
Q3 Unemployment has risen in the first two quarters of 2015, despite there being a rise in the number of
people in work. In June 2015, there were 1.85 million people unemployed in the UK, yet there were
354000 more people in work when compared to a year earlier. Source: BBC News August 2015
(a) Define ‘unemployment rate’: [2 marks]
Knowledge 1
The percentage of the total labour force that is unemployed i.e. without a job but willing and able to work
(b) Explain how unemployment can be rising at the same time as the number of people in work is rising:
[2 marks]
Application 2
The size of the labour force must be increasing (1), so even if the unemployment rate remains constant then the
number of people who are unemployed must also be rising (1)
(c) Which one of the following is the likely consequence of a rise in the unemployment rate: [1 mark]
A Aggregate demand is likely to rise
B There would be downward pressure on real incomes
C Import volumes may rise
D UK goods and services will become less competitive
Answer B
(Total for Question 3 = 4 marks)
c) Which one of the following statements is true? [1 mark]
A The largest area of government spending is on healthcare
B The government earns more from VAT than income tax
C The amount earned from Council Tax is equal to the amount spent on housing and the environment
D The smallest amount of tax revenue comes from excise duties
Answer C
(Total for Question 2 = 4 marks)](https://image.slidesharecdn.com/msedexcelp2no2-170316084837/85/Mark-Scheme-edexcel-Practice-Paper-2-4-320.jpg)
![Edexcel Economics (AS) – Paper 2: Number 2 Page 5
Q4
(a) Using the aggregate demand and supply axes below, show the effect of a rise in the exchange rate on the
equilibrium level of real national output and average price level on the economy. [2 marks]
Knowledge 1, Application 1
Left shift in AD (1) and new price level and real GDP level indicated (1)
(OR some candidates may show a downwards movement in AS, as imported oil/commodities become cheaper)
(b) Which one of the following is likely to cause an appreciation of a country’s currency? [1 mark]
A A reduction in the base rate of interest in the economy
B An increase in import volumes
C An increase in export volumes
D A reduction in inwards foreign direct investment
Answer C
(c) Explain the effect of a depreciation in a country’s exchange rate on its current account balance: [2 marks]
Knowledge 1 Analysis 1
Depreciation means that a currency is weaker and so exports become relatively cheaper and imports relatively
more expensive (1)
Cheaper X plus more expensive M should lead to an improvement in the trade balance, and therefore improve
the current account balance (1)
Award 1 mark max for definitions e.g. depreciation, current account balance
(Total for Question 4 = 4 marks)
Jan 2015
3
2
1
0
ion - £232 billion
ocial services - £30 billion
£170 billion
insurance - £113 billion
ion
£170 billion
insurance - £113 billion
ion
Averagepricelevel
Real GDP
Real GDP
Averagepricelevel
Y Y1
LRAS
P
P 1
AD1
AD](https://image.slidesharecdn.com/msedexcelp2no2-170316084837/85/Mark-Scheme-edexcel-Practice-Paper-2-5-320.jpg)
![Page 6 Edexcel Economics (AS) – Paper 2: Number 2
Q5 Below is a graph of the UK’s quarterly growth rate between 2012 and 2015.
(a) Which of the following statements can be correctly inferred from the chart above? [1 mark]
A GDP was lowest in Q4 2012
B GDP was highest in 2014
C GDP was highest in Q2 2015
D The value of GDP in Q4 2013 was identical to the value of GDP in Q1 2015
Answer C
(b) Explain two factors that may cause an increase in a country’s short run growth rate: [2 marks]
Analysis 2 (1 + 1)
Factors include anything that could cause aggregate demand to increase e.g. lower interest rates, higher
consumer/business confidence, an increase in the amount of government spending relative to tax etc.
(c) Distinguish between GDP and GNP [1 mark]
Knowledge 1
(GDP = Gross Domestic Product, GNP = Gross National Product)
GDP refers to the value of output produced within a country’s geographical boundaries regardless of who
owns the factors of production, whereas GNP refers to the value of output produced by a country’s factors of
production, regardless of their location
(Total for Question 5 = 4 marks)
TOTAL FOR SECTION A = 20 MARKS
%change
2000000
1800000
1600000
1400000
1200000
1000000
1.2
1.0
0.8
0.6
0.4
0.2
0.
-0.2
2012 2013 2013 2014 2014 2015 2015
Q3 2012 Q4 2012 Q1 2013 Q2 2013 Q3 2013 Q4 2013 Q1 2014 Q2 2014 Q3 2014 Q4 2014 Q1 2015 Q2 2015 Q3 2015
40
30
20
10
0
-10
-20
-30
-40
Q1 Q2 Q3 Q4 Q1 Q2 Q3 Q4 Q1 Q2 Q3 Q4 Q1 Q2 Q3 Q4 Q1 Q2 Q3 Q4 Q1 Q2 Q3 Q4
2010 2011 2012 2013 2014 2015](https://image.slidesharecdn.com/msedexcelp2no2-170316084837/85/Mark-Scheme-edexcel-Practice-Paper-2-6-320.jpg)
![Edexcel Economics (AS) – Paper 2: Number 2 Page 7
Mark scheme - Section B
(a) With reference to Figure 1, explain what has happened to manufacturing activity between 2007 and
2015 according to the purchasing managers’ survey. [4 marks]
Knowledge 2, Application 2
Knowledge:
N Explanation of “manufacturing” (2)
N Explanation of GDP (1)
Application:
N Between 2008 and 2010, the level of manufacturing activity was below 50, which indicates falling levels of
manufacturing (1)
N The highest level of manufacturing activity reported was in 2011 and the lowest level was in early 2009 (1)
N Manufacturing activity levels fell from mid 2011 to mid 2013 (1)
N Comment on volatility of manufacturing (1)
N.b. there must be a specific reference to the data for both application marks to be awarded
(b) With reference to Extract A, explain the likely effect of a ‘contraction in the investment goods sector’
on the performance of the UK economy. [5 marks]
Knowledge 1, Application 2, Analysis 2
Knowledge:
N Definition of investment (an increase in the capital stock of an economy) (1)
N Recognition that economic performance is measured through macro indicators such as unemployment rate,
growth rate, inflation rate etc (1)
Application:
N 2 points for 2 data references from Extract A, for example, upturn in inflation, UK growth is unbalanced, lack
of exports
Analysis:
N 2 x analytical chains linking reduction in production of investment goods to an economic performance
indicator, e.g. reduction in investment causes AD to decrease since I is a component of AD, therefore causing
short-run growth to fall, or a lack of investment goods reduces the available stock of factors of production
which can reduce the level of full capacity and prevent long run economic growth](https://image.slidesharecdn.com/msedexcelp2no2-170316084837/85/Mark-Scheme-edexcel-Practice-Paper-2-7-320.jpg)
![Page 8 Edexcel Economics (AS) – Paper 2: Number 2
(c) With reference to Extract A, explain two reasons why a strengthening of Sterling may affect the market for
Britain’s manufactured goods. [6 marks]
Knowledge 2, Application 2, Analysis 2 (2 x 3)
Knowledge:
N identification of two reasons (1 + 1) e.g. UK’s manufactured goods are less internationally competitive, imported
manufactured goods are more competitive
Application:
Link to Extract A for each of the reasons mentioned (1 + 1) e.g. reference to unbalanced growth,
Analysis:
Linked development of how each reason affects the market for manufactured goods (1 + 1), for example:
N Stronger currency makes exports appear more expensive overseas ceteris paribus therefore reducing the
quantity demanded
N Britain’s manufactures are already very expensive compared with manufactures from countries such as Germany,
or even China, so a stronger currency reduces further the chance that manufactures will get exported
N British producers are more likely to buy imported manufactured goods rather than buy British because the
stronger Sterling makes imports seem relatively cheaper
N The market for manufactured goods may decline even further, worsening the balance of output in the UK
(d) Assess the significance of having balanced growth in both manufacturing and consumer goods sectors
in the UK economy. [10 marks]
Knowledge 2, Application 2, Analysis 2
Possible points for inclusion:
N Definition of balanced growth
N Distinguish between manufactured goods and consumer goods (n.b. candidates may use the terms capital
goods and consumer goods)
N Use of PPF to illustrate current scenario of SR movement along away from capital goods towards consumer
goods, and then LR inwards shift – balance allows the PPF to continue to shift outwards, therefore allowing both
SR and LR growth
N Importance of manufactured goods – cause LRAS to shift right, therefore boosting productive capacity, allowing
non-inflationary growth, can lead to increased employment if firms are expanding, prevents over-reliance on
services
N Importance of consumer goods – can increase living standards / happiness, generates SR growth which also
drives employment
N Link with increased equality – different regions produce different goods, so balanced growth allows all regions to
grow](https://image.slidesharecdn.com/msedexcelp2no2-170316084837/85/Mark-Scheme-edexcel-Practice-Paper-2-8-320.jpg)
![Edexcel Economics (AS) – Paper 2: Number 2 Page 9
Level Mark Descriptor
0 Completely inaccurate response
1 1 -3 Displays isolated or imprecise knowledge and understanding of key terms, concepts, theories
and models. Uses generic or irrelevant information or examples. Descriptive approach with no
link between causes and consequences.
2 4 - 6 Displays elements of knowledge and understanding of economic principles, concepts
and theories. Applies economic ideas and relates them to economic problems in context,
although does not focus on the broad elements of the question. A narrow response; chains of
reasoning may be developed but the answer may lack balance.
4 7 - 9 Demonstrates accurate knowledge and understanding of the concepts, theories and models.
Ability to link knowledge and understanding in context using relevant and focused examples
which are fully integrated. Economic ideas are applied appropriately to the broad elements of
the question.
Evaluation 4
Possible points for inclusion
N Comparative advantage theory suggests we should specialise in producing what we are best at producing in
order to boost productive efficiency – this implies that balanced growth is undesirable
N Not really possible to compete with the likes of Germany or Japan in terms of high tech manufactured items, or
China in terms of low-cost high-volume manufactured goods
N UK does not have the infrastructure to have balanced growth – it would take too long to achieve
N UK focus should be on services
N Balanced growth requires large amounts of government intervention, which can be costly and misguided – could
“back the wrong horse”
Level Mark Descriptor
0 No evaluative comments
1 1-2 Identification of generic evaluative comments without supporting evidence or reference to
context. No evidence of a logical chain of reasoning.
2 3-4 Evaluative comments supported by chains of reasoning and appropriate reference to
context. Evaluation is balanced and considers the broad elements of the question.
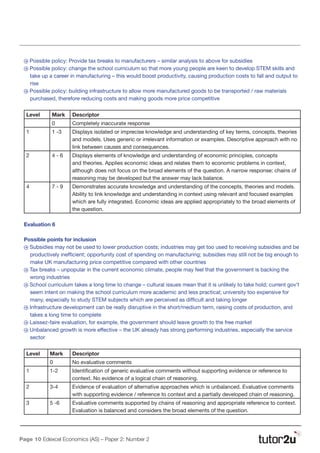
(e) Discuss the policies the UK Government could adopt to achieve a stronger growth rate in the UK’s
manufacturing sector. [15 marks]
Knowledge 3, Application 3, Analysis 3
Possible points for inclusion
N Definition of growth rate
N Definition of supply-side policies
N Outlines of at least 2 policies
N Possible policy: provide subsidies to manufacturers, to lower production costs and make manufactures more
price competitive, therefore boosting demand for UK manufactures and providing more profit to manufacturers
which can then be used for further investment](https://image.slidesharecdn.com/msedexcelp2no2-170316084837/85/Mark-Scheme-edexcel-Practice-Paper-2-9-320.jpg)
![Edexcel Economics (AS) – Paper 2: Number 2 Page 11
EITHER
(f) Evaluate the use of fiscal policy to achieve the UK’s macroeconomic objectives [20 marks]
Knowledge 4, Application 4, Analysis 6
Possible points for inclusion:
N Definition of fiscal policy
N Explanation of UK macro objectives (economic growth, low unemployment, low stable inflation, current account
equilibrium, balanced budget deficit, environmental protection, greater income equality)
N Outline of possible fiscal policies e.g. more progressive income tax / lower income tax for the poor, greater use of
excise duty to help protect the environment, lower corporation tax to boost employment and growth, reduction
in benefits to boost labour market participation rates, increased spending on education and healthcare to boost
living standards
N Answers should cover the impact on a range of macroeconomic objectives
N It is likely that answers would be illustrated with at least one AD/AS diagram to show the impact of a particular
fiscal policy/policies on GDP, the price level and employment levels
Level Mark Descriptor
0 Completely inaccurate response
1 1 -3 Displays isolated or imprecise knowledge and understanding of key terms, concepts, theories
and models. Uses generic or irrelevant information or examples. Descriptive approach with no
chains of reasoning and no link between causes and consequences.
2 4 - 6 Displays elements of knowledge and understanding of economic principles, concepts and
theories. Applies economic ideas and relates them to economic problems in context, although
does not focus on the broad elements of the question. A narrow response or superficial , two-
stage chains of reasoning only.
3 7 - 10 Demonstrates accurate knowledge and understanding of the concepts, theories and models.
Ability to apply economic concepts and relate them directly to broad elements of the question
with evidence integrated into the answer. Analysis is clear and coherent, although it may lack
balance. Chains of reasoning are developed, but the answer may lack balance.
4 11 - 14 Demonstrates precise knowledge and understanding of the concepts, theories and models.
Ability to link knowledge and understanding in context using appropriate examples. Analysis
is relevant and focused with evidence fully and reliably integrated. Economic ideas are
carefully selected and applied appropriately to economic issues and problems. The answer
demonstrates logical and coherent chains of reasoning.
Evaluation 6
Possible points for inclusion:
N Fiscal policy is only really changed once per year in the Budget, and occasionally the Autumn Statement, but
changes can take some time to come into play
N Key aim of fiscal policy over recent years has been to move the budget balance into a surplus rather than a
deficit, and eliminate the structural deficit altogether – this has outweighed other macro objectives](https://image.slidesharecdn.com/msedexcelp2no2-170316084837/85/Mark-Scheme-edexcel-Practice-Paper-2-11-320.jpg)
![Page 12 Edexcel Economics (AS) – Paper 2: Number 2
N Monetary policy is the key tool for managing inflation, not fiscal policy
N Objectives may be better met through non-interventionary supply side policies
N Views on fiscal policy depend on the governing political party – Conservatives traditionally more likely to cut
taxes and cut government spending than, for example, Labour
N Specific evaluation of individual policies mentioned n.b. the evaluation must focus on whether or not that policy
will allow macro objectives to be achieved or not
N Trade-offs between macro objectives e.g. rising AD as a result of rising government spending will cause rising
GDP but could be inflationary – possible use of the Philips Curve to illustrate
N Impact of fiscal policy depends on the size and nature of the output gap
Level Mark Descriptor
0 No evaluative comments
1 1-2 Identification of generic evaluative comments without supporting evidence or reference to
context. No evidence of a logical chain of reasoning.
2 3-4 Evidence of evaluation of alternative approaches which is unbalanced. Evaluative comments
with supporting evidence / reference to context and a partially developed chain of reasoning.
3 5 -6 Evaluative comments supported by chains of reasoning and appropriate reference to context.
Evaluation is balanced and considers the broad elements of the question.
OR
(g) Evaluate whether low and stable inflation should remain as the main macroeconomic objective for the
UK government. . [20 marks]
Knowledge 4, Application 4, Analysis 6
Possible points for inclusion:
N Definition of inflation
N Explanation of other UK macro objectives (economic growth, low unemployment, current account equilibrium,
balanced budget deficit, environmental protection, greater income equality)
N Explanation of UK’s 2% CPI inflation target, and the use of monetary policy by the MPC at the Bank of England
for controlling it
N Recognition that we need some inflation, rather than deflation – sign of a growing economy
N Problems associated with inflation e.g. menu costs / shoe leather costs, redistribution of income from savers to
borrowers, hits those on benefits hardest because they may not rise in line with inflation, reduces real income
and therefore purchasing power, can reduce confidence which in turn reduces growth and employment, may
cause exports to be less price competitive
N Ideally the achievement of low stable inflation should be linked to how it can help to achieve other macro
objectives
Level Mark Descriptor
0 Completely inaccurate response
1 1 -3 Displays isolated or imprecise knowledge and understanding of key terms, concepts, theories
and models. Uses generic or irrelevant information or examples. Descriptive approach with no
chains of reasoning and no link between causes and consequences.](https://image.slidesharecdn.com/msedexcelp2no2-170316084837/85/Mark-Scheme-edexcel-Practice-Paper-2-12-320.jpg)