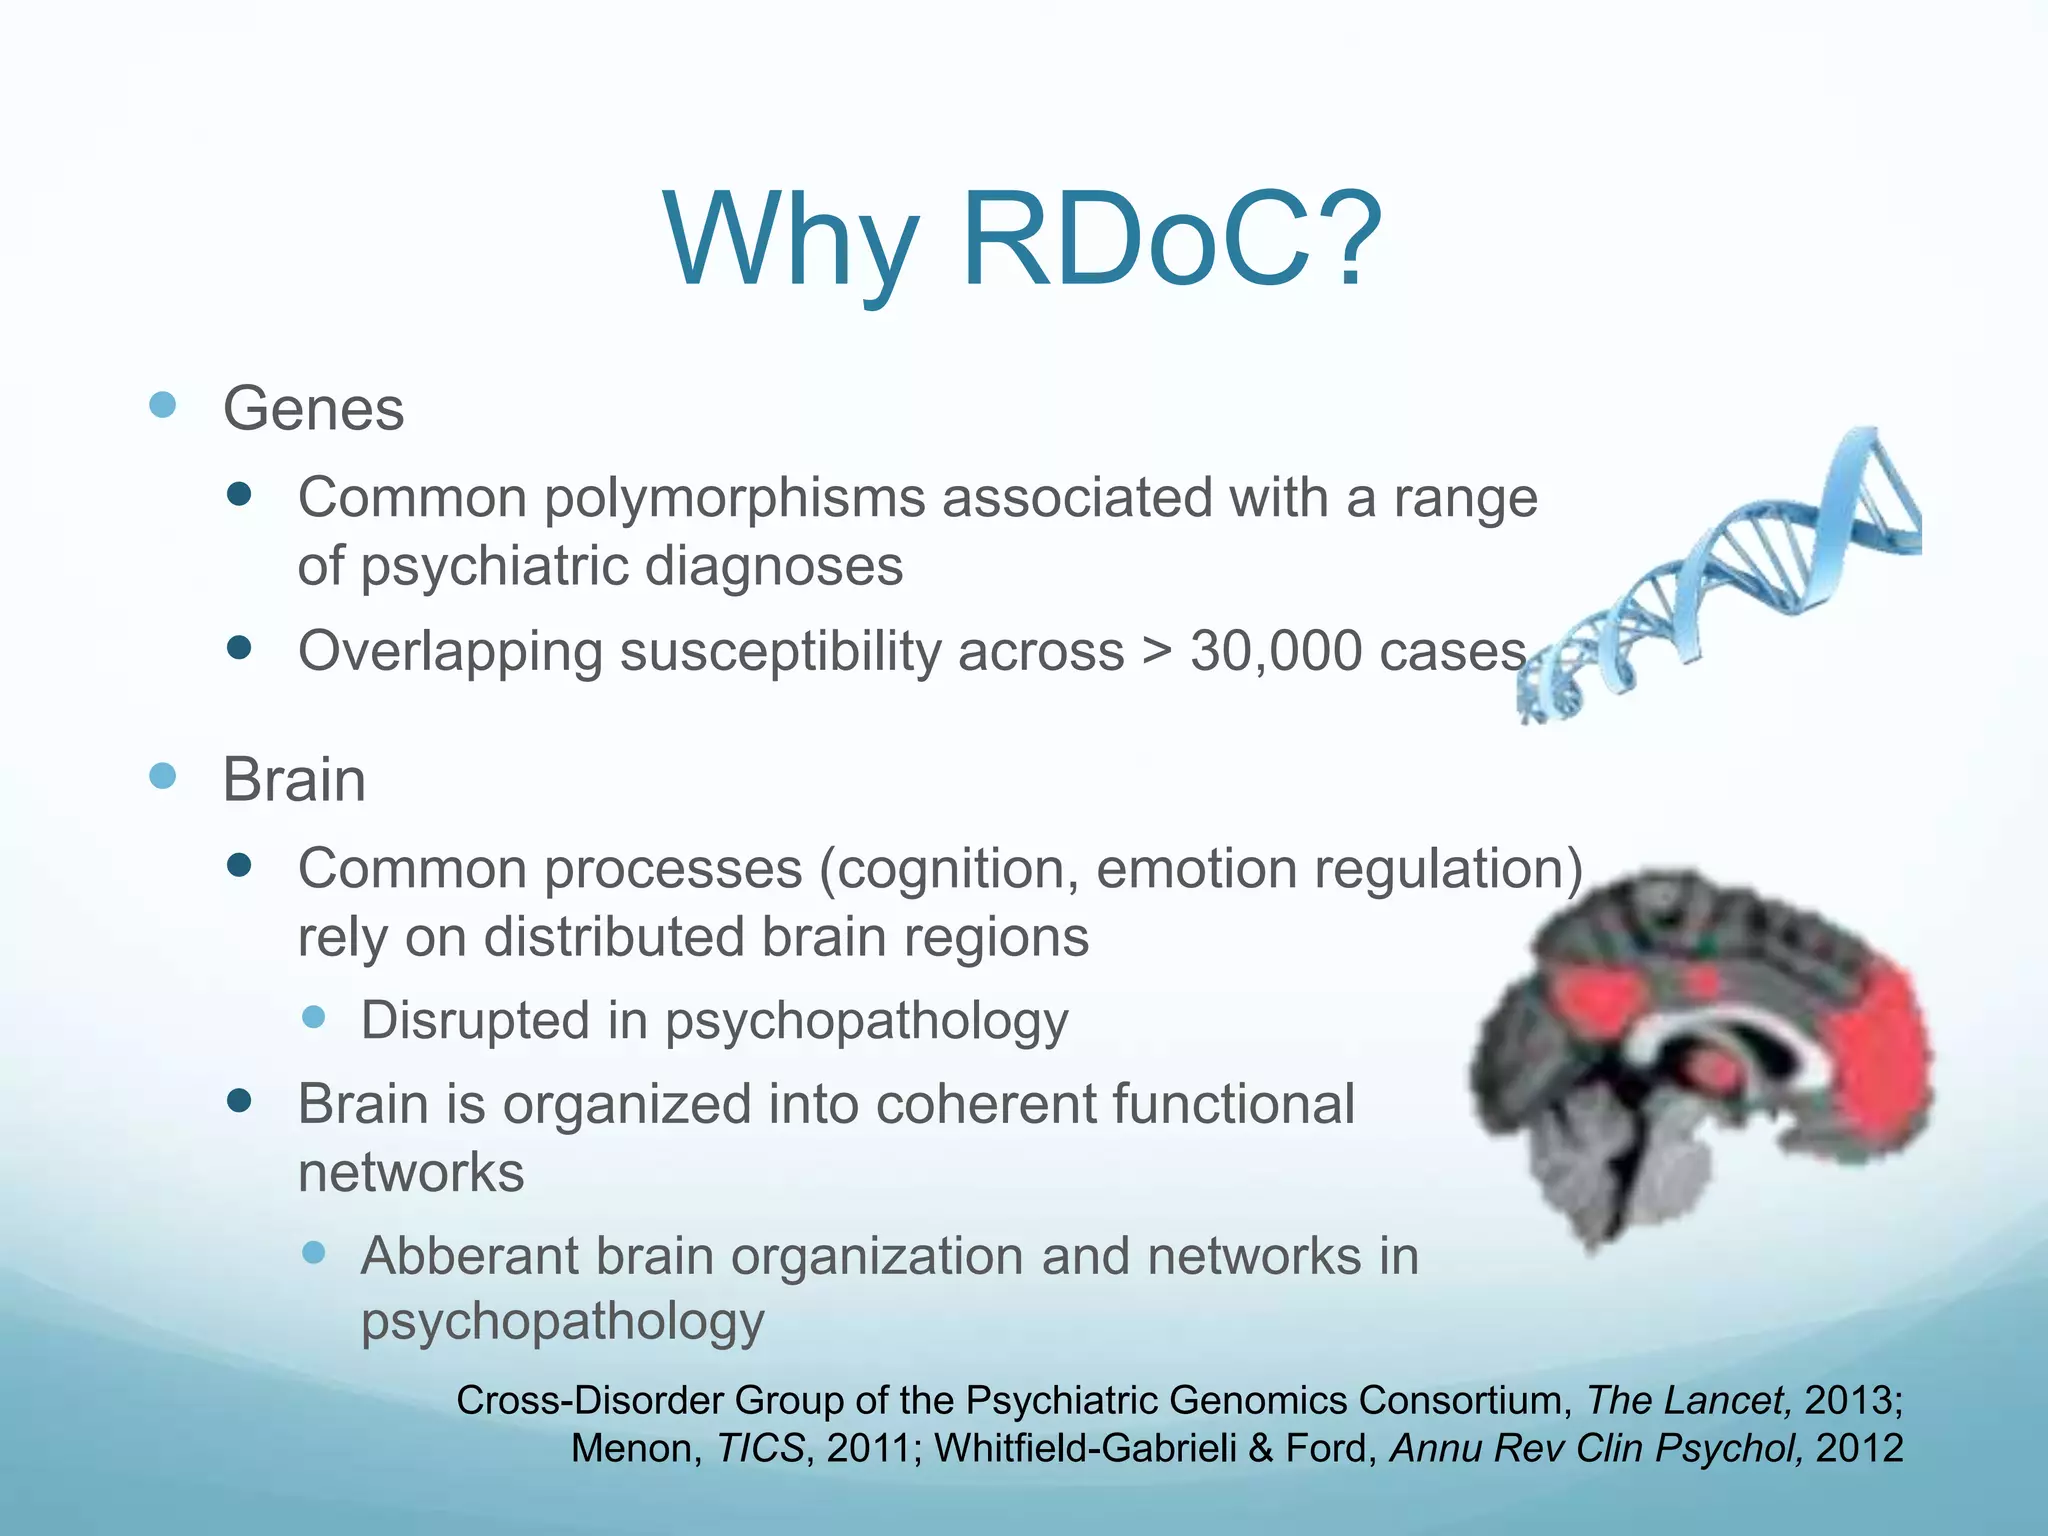
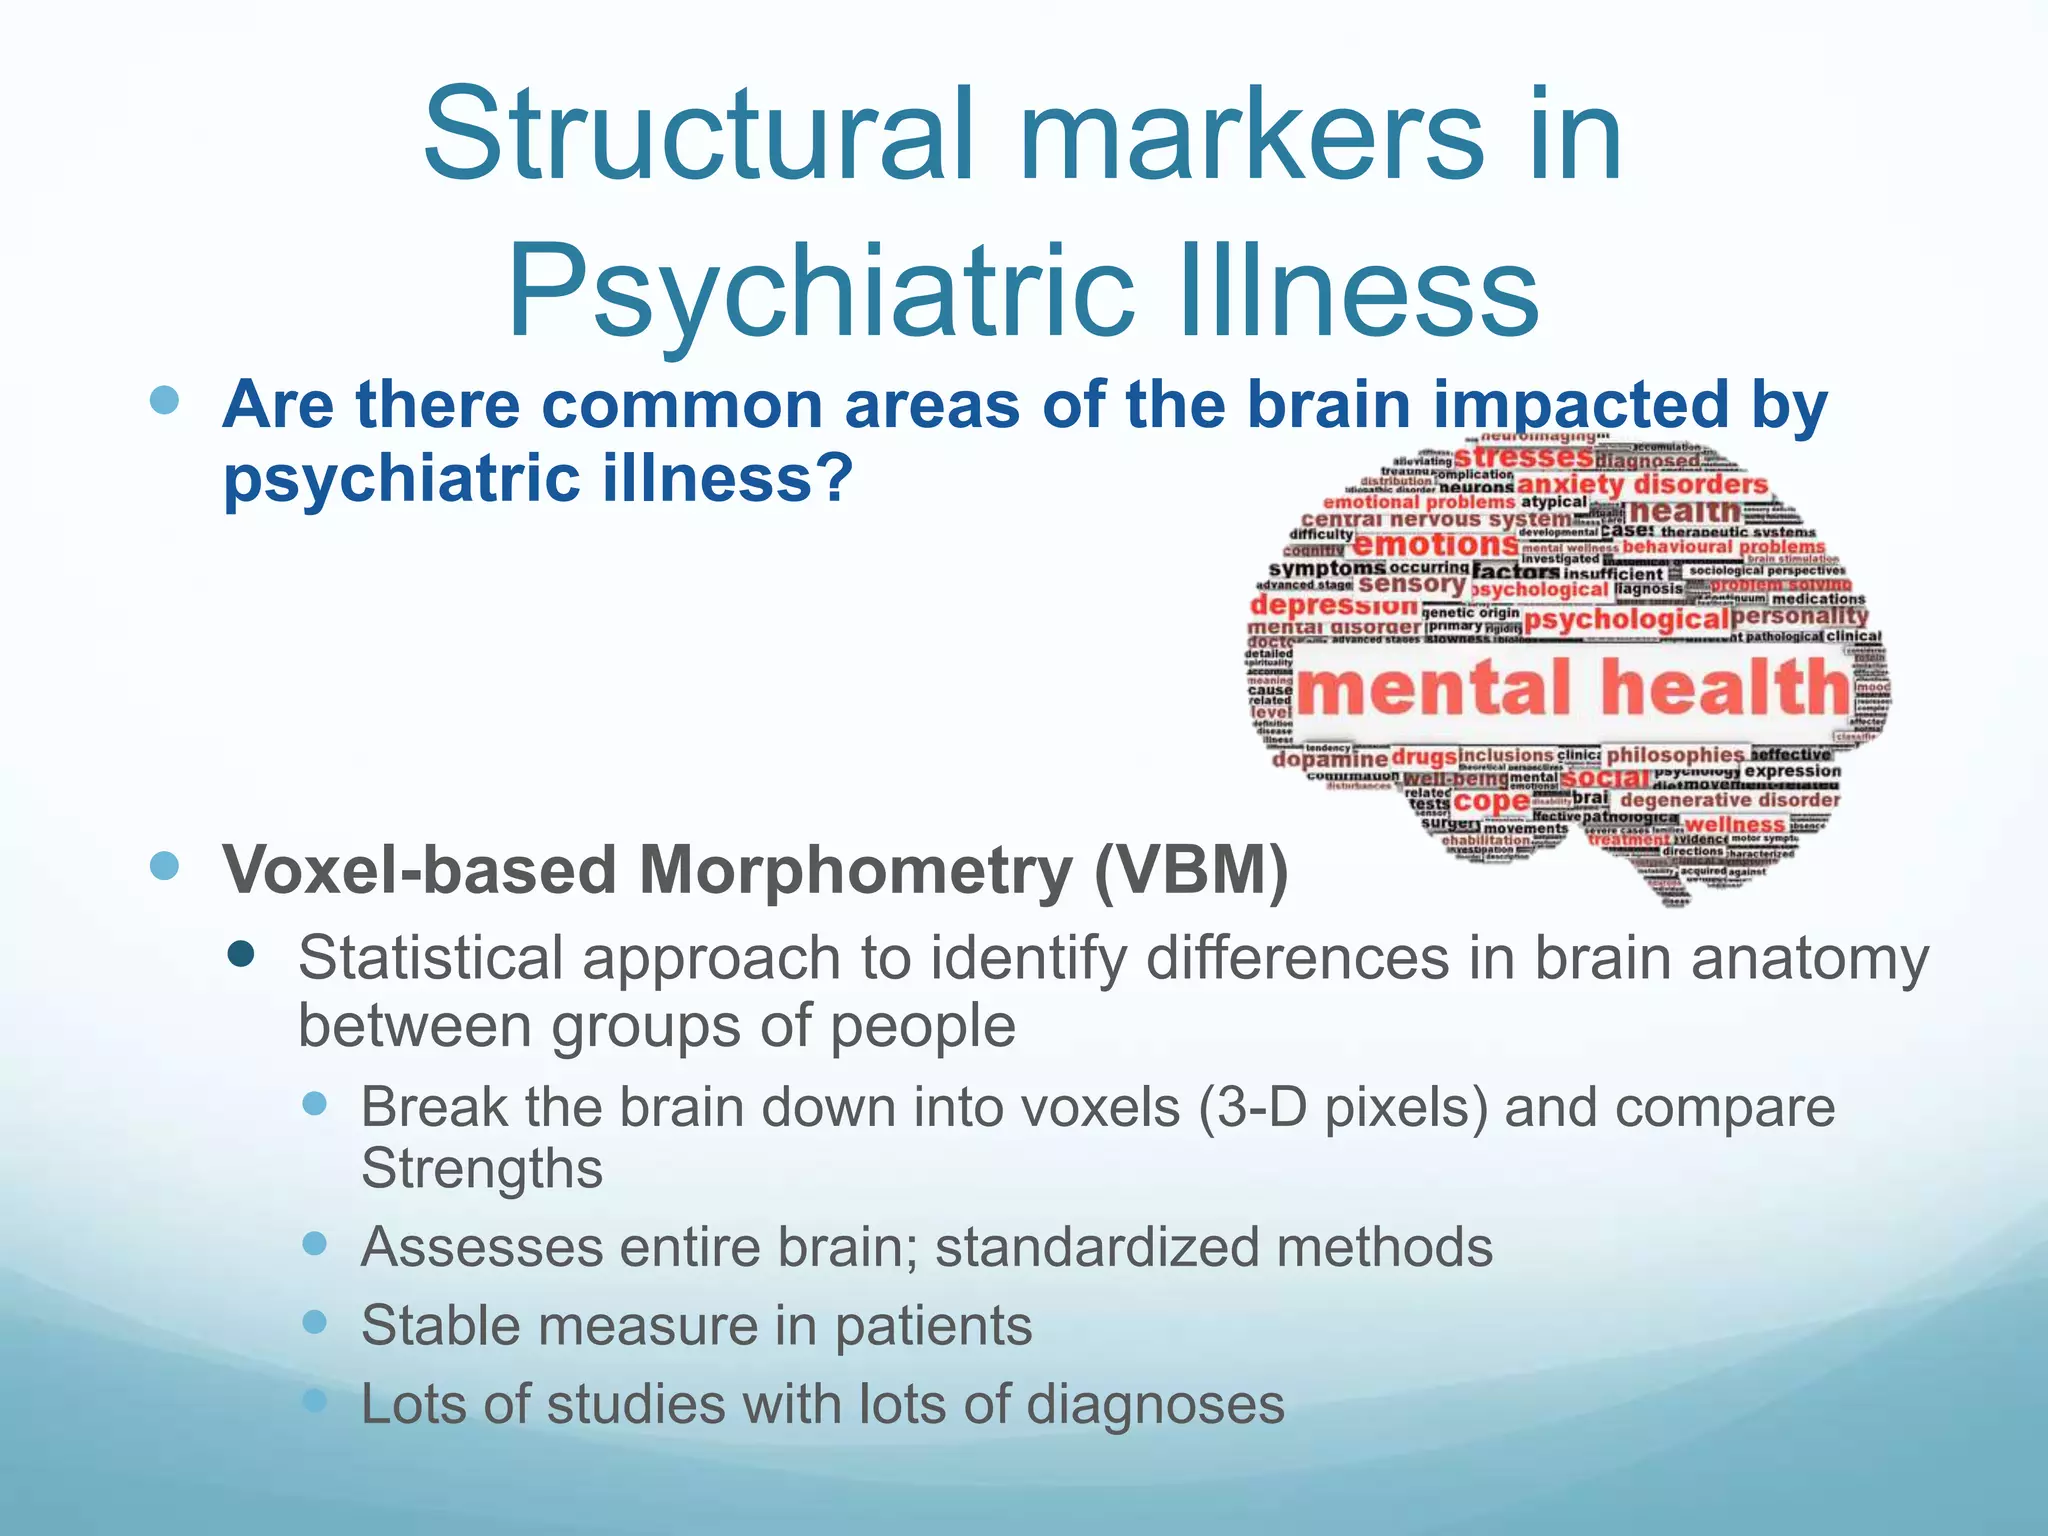
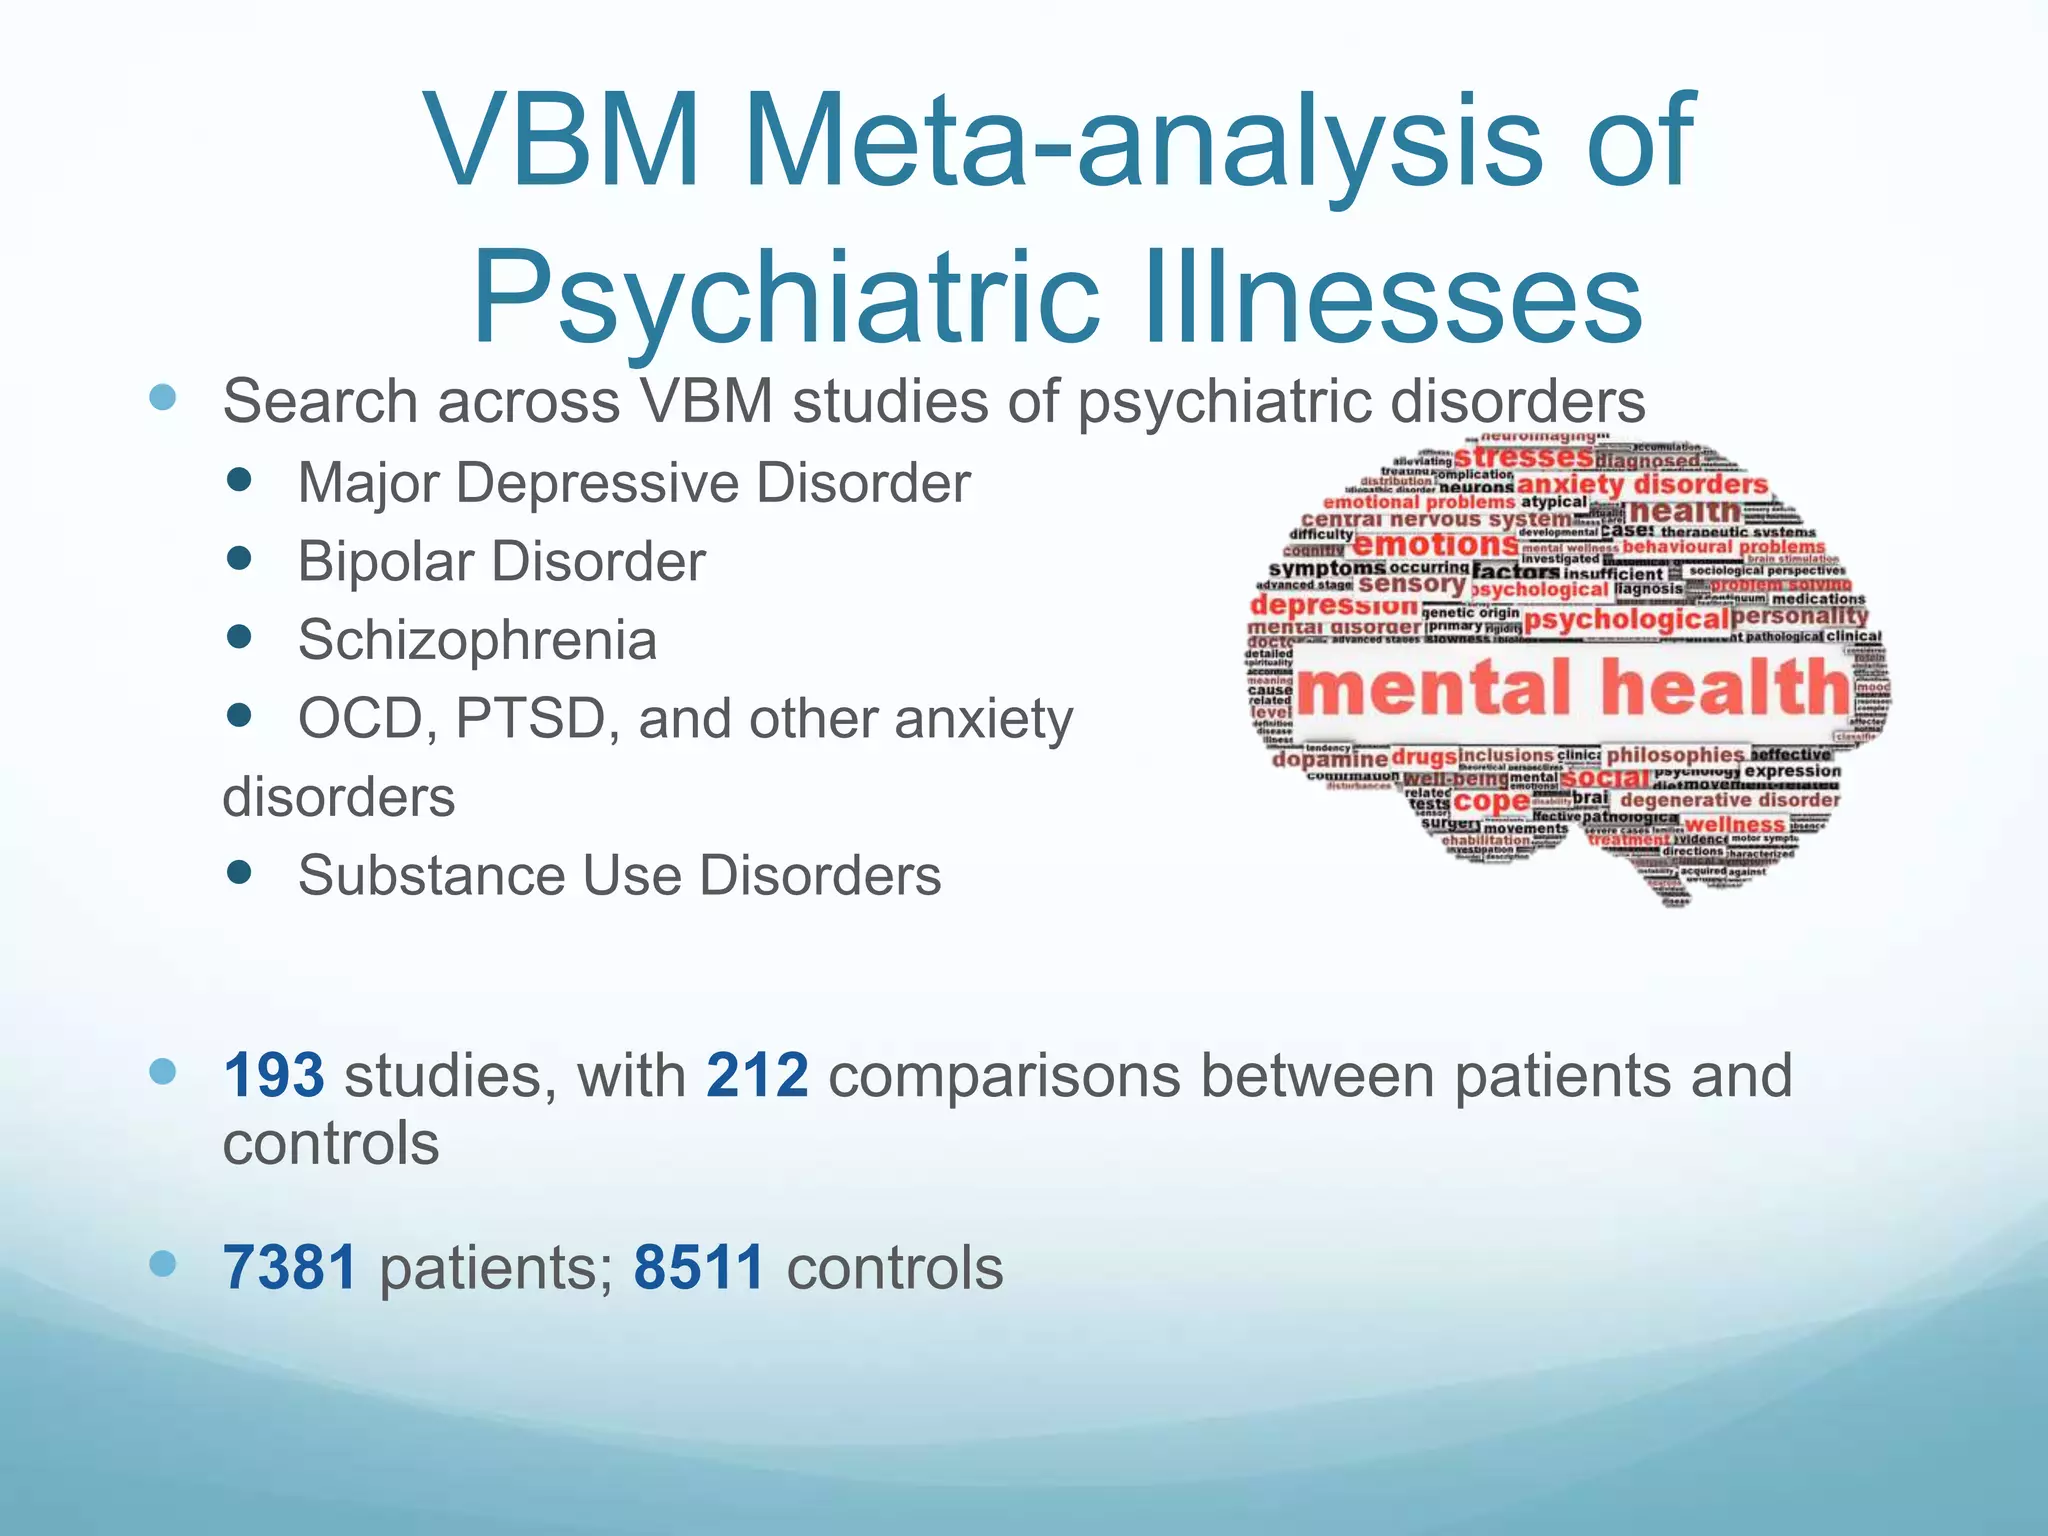
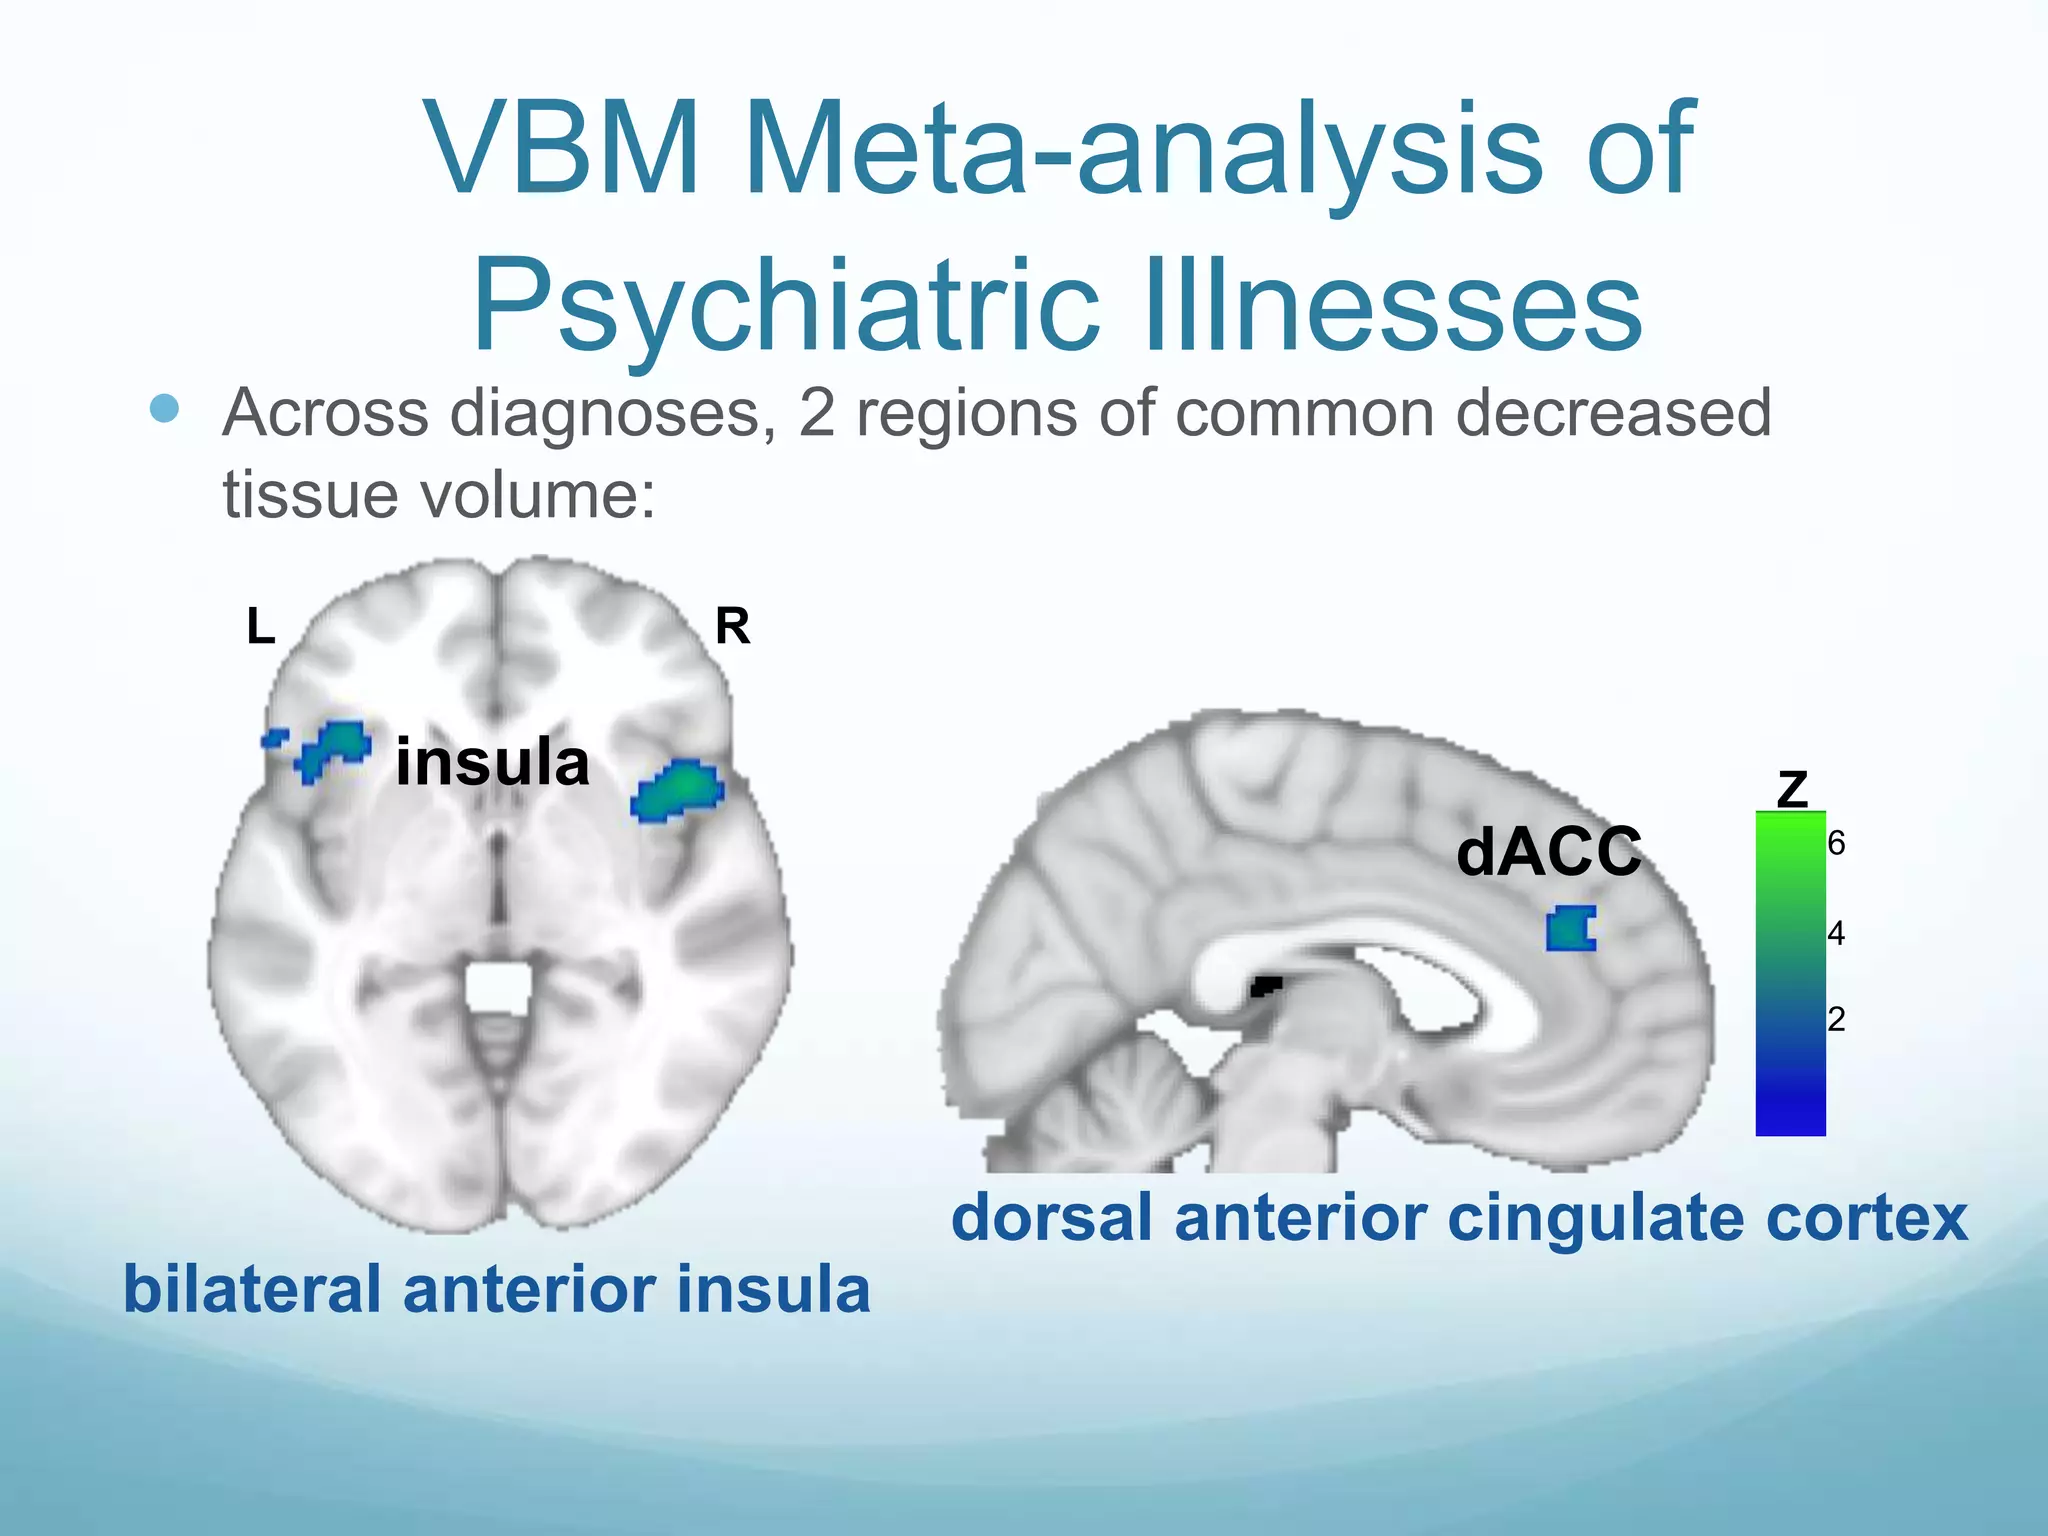
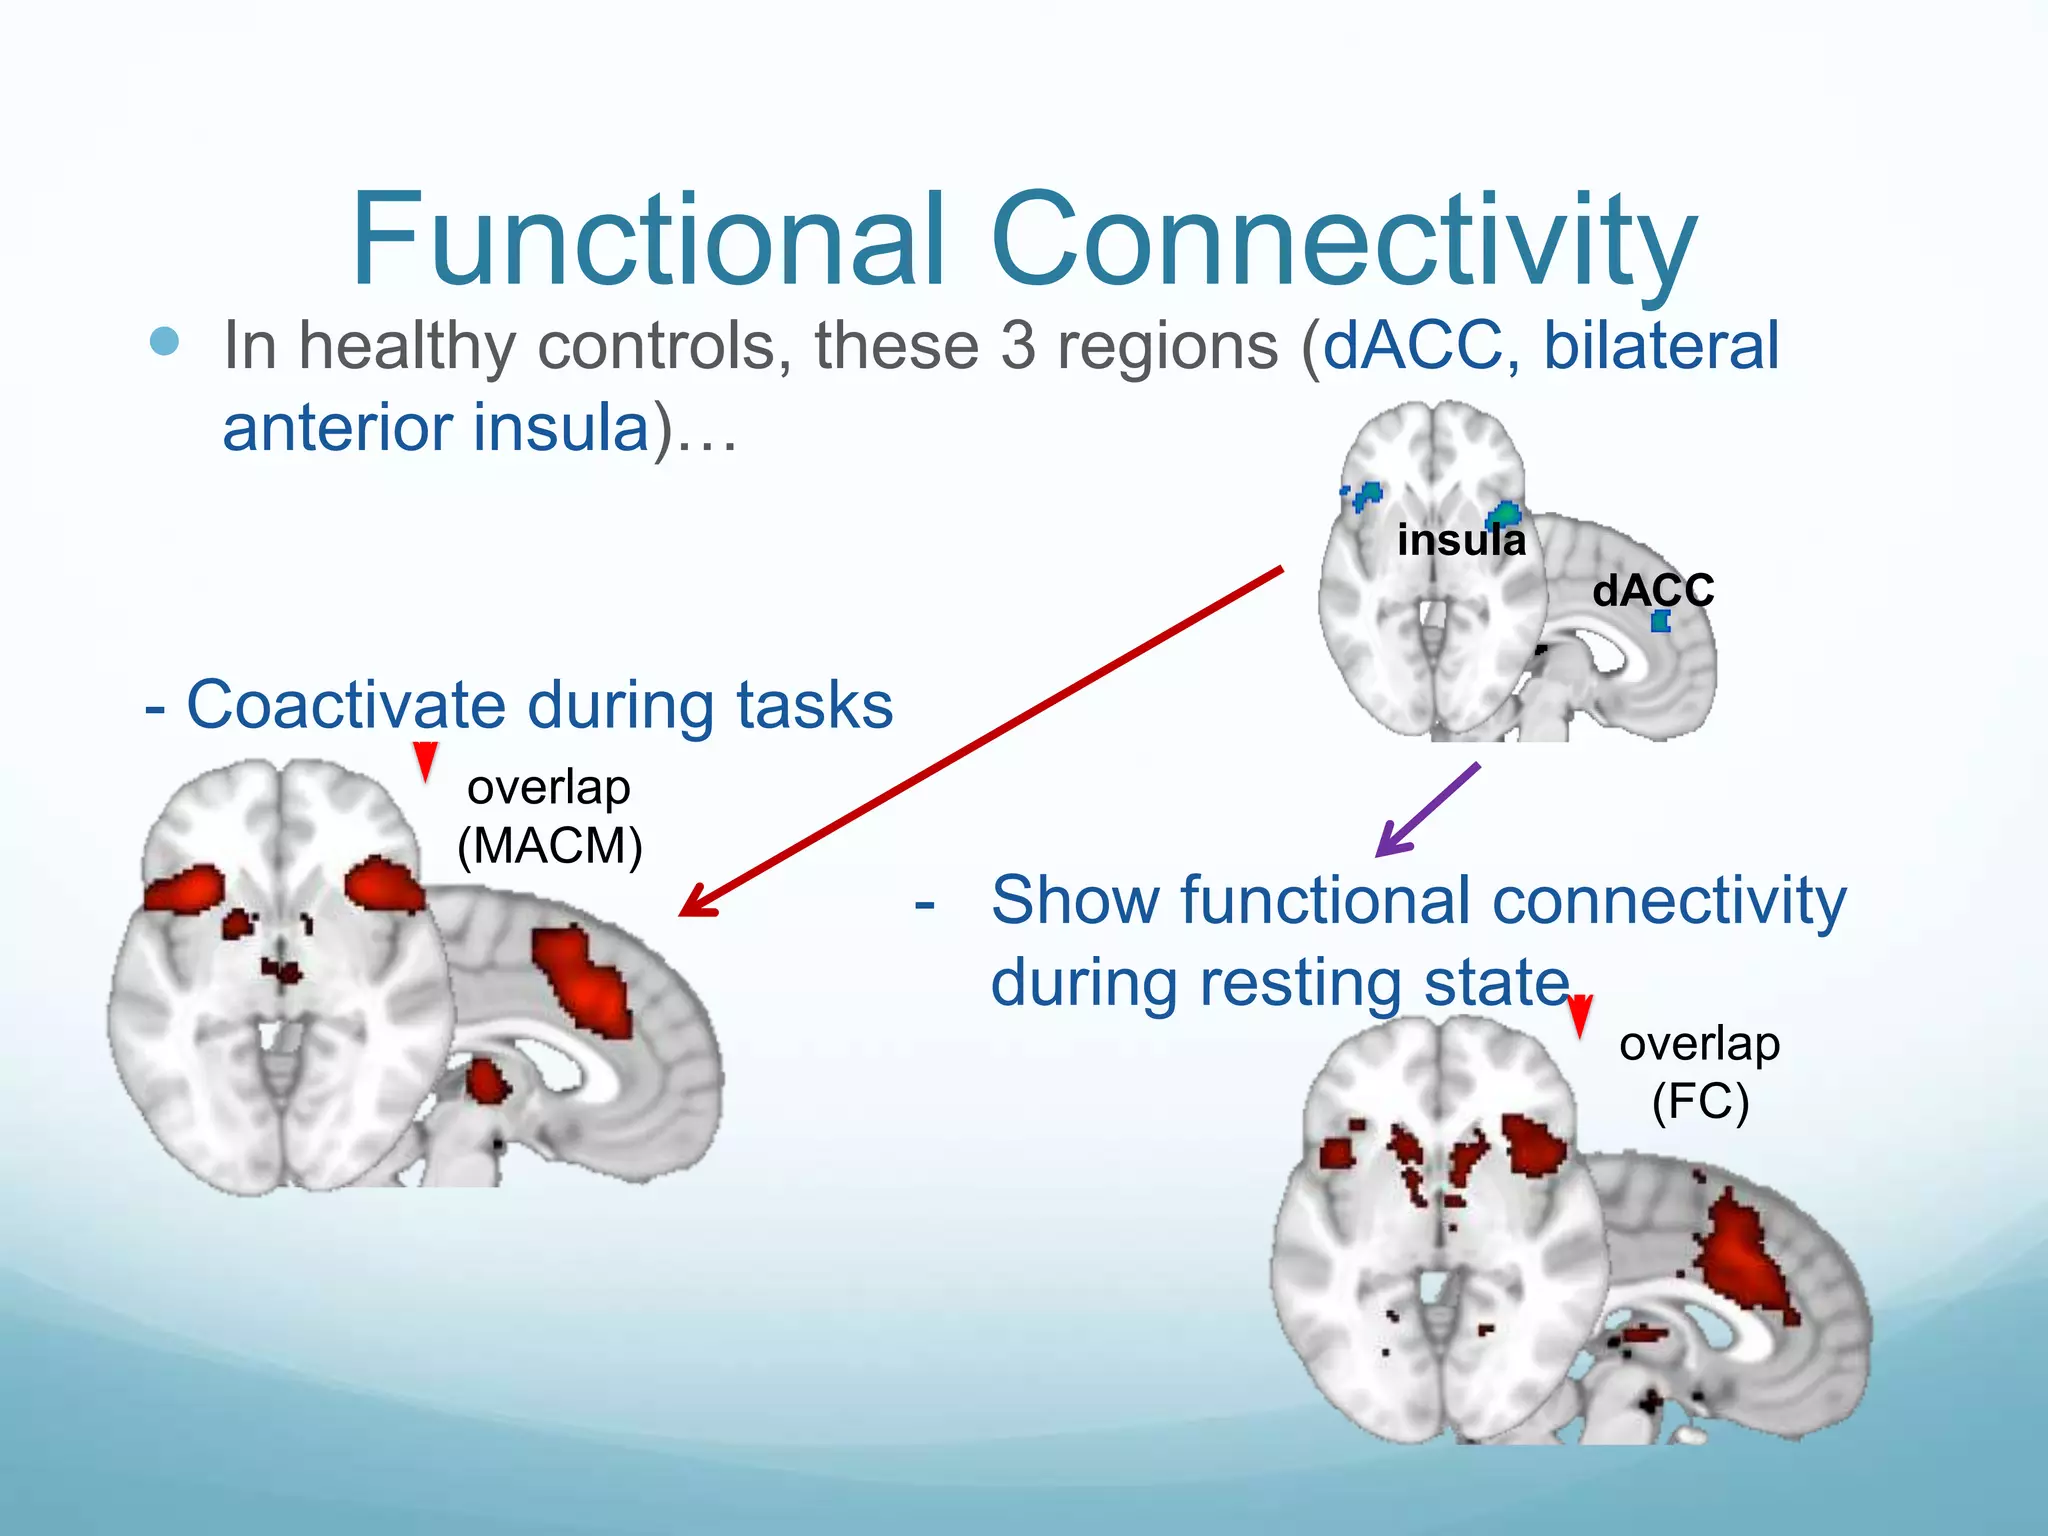
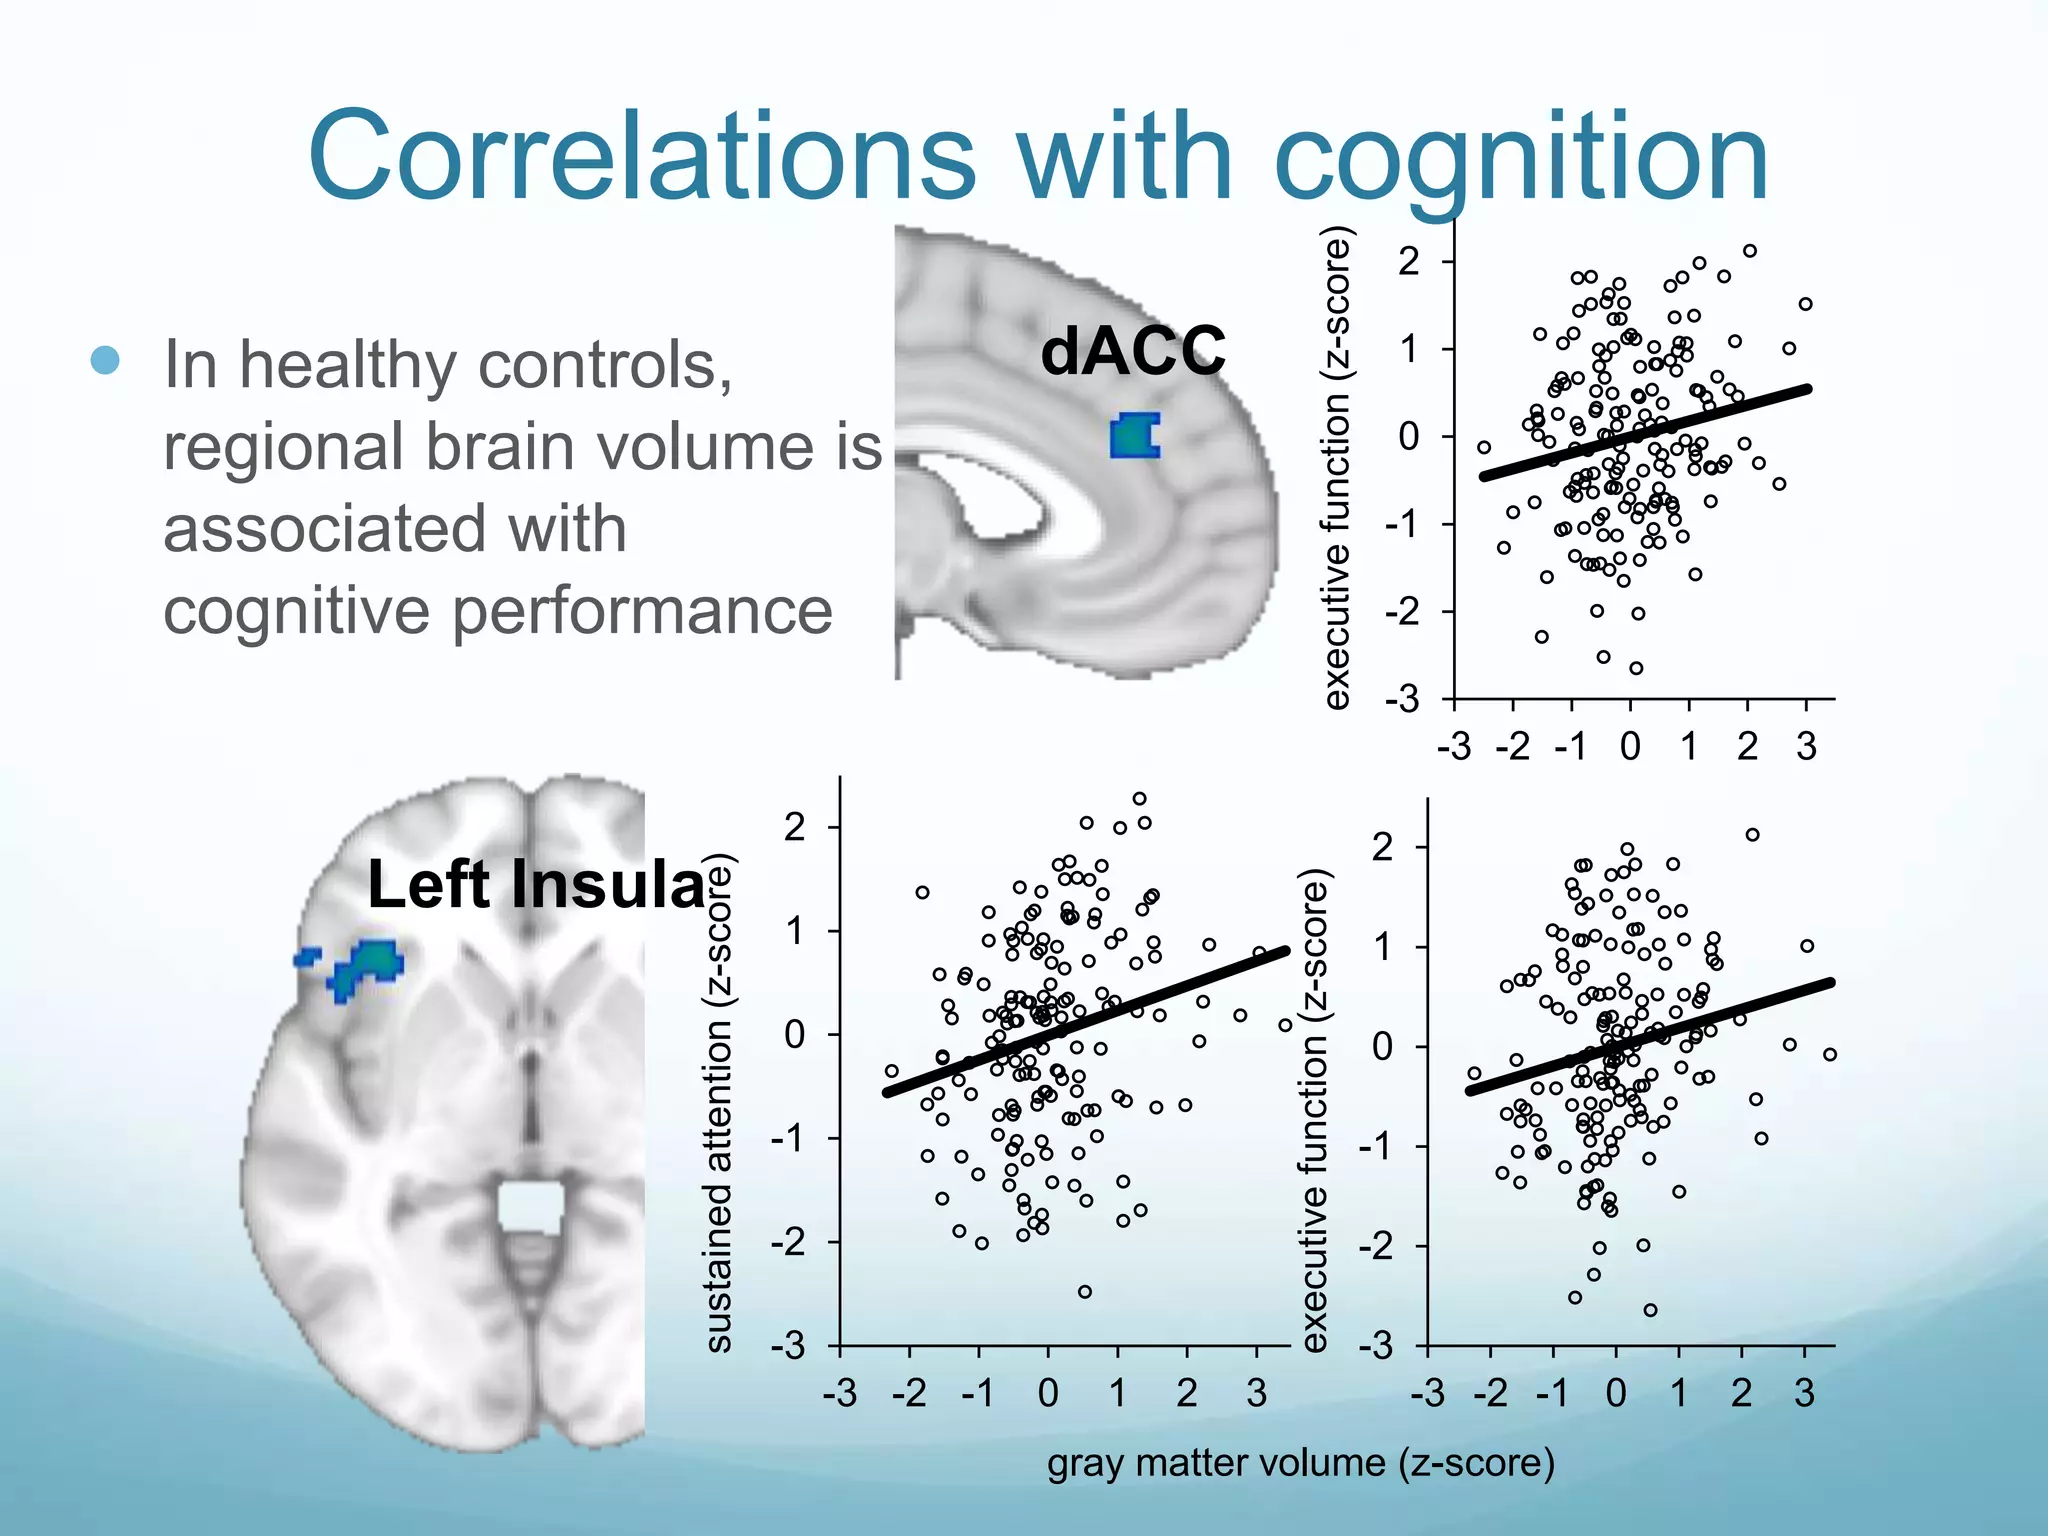
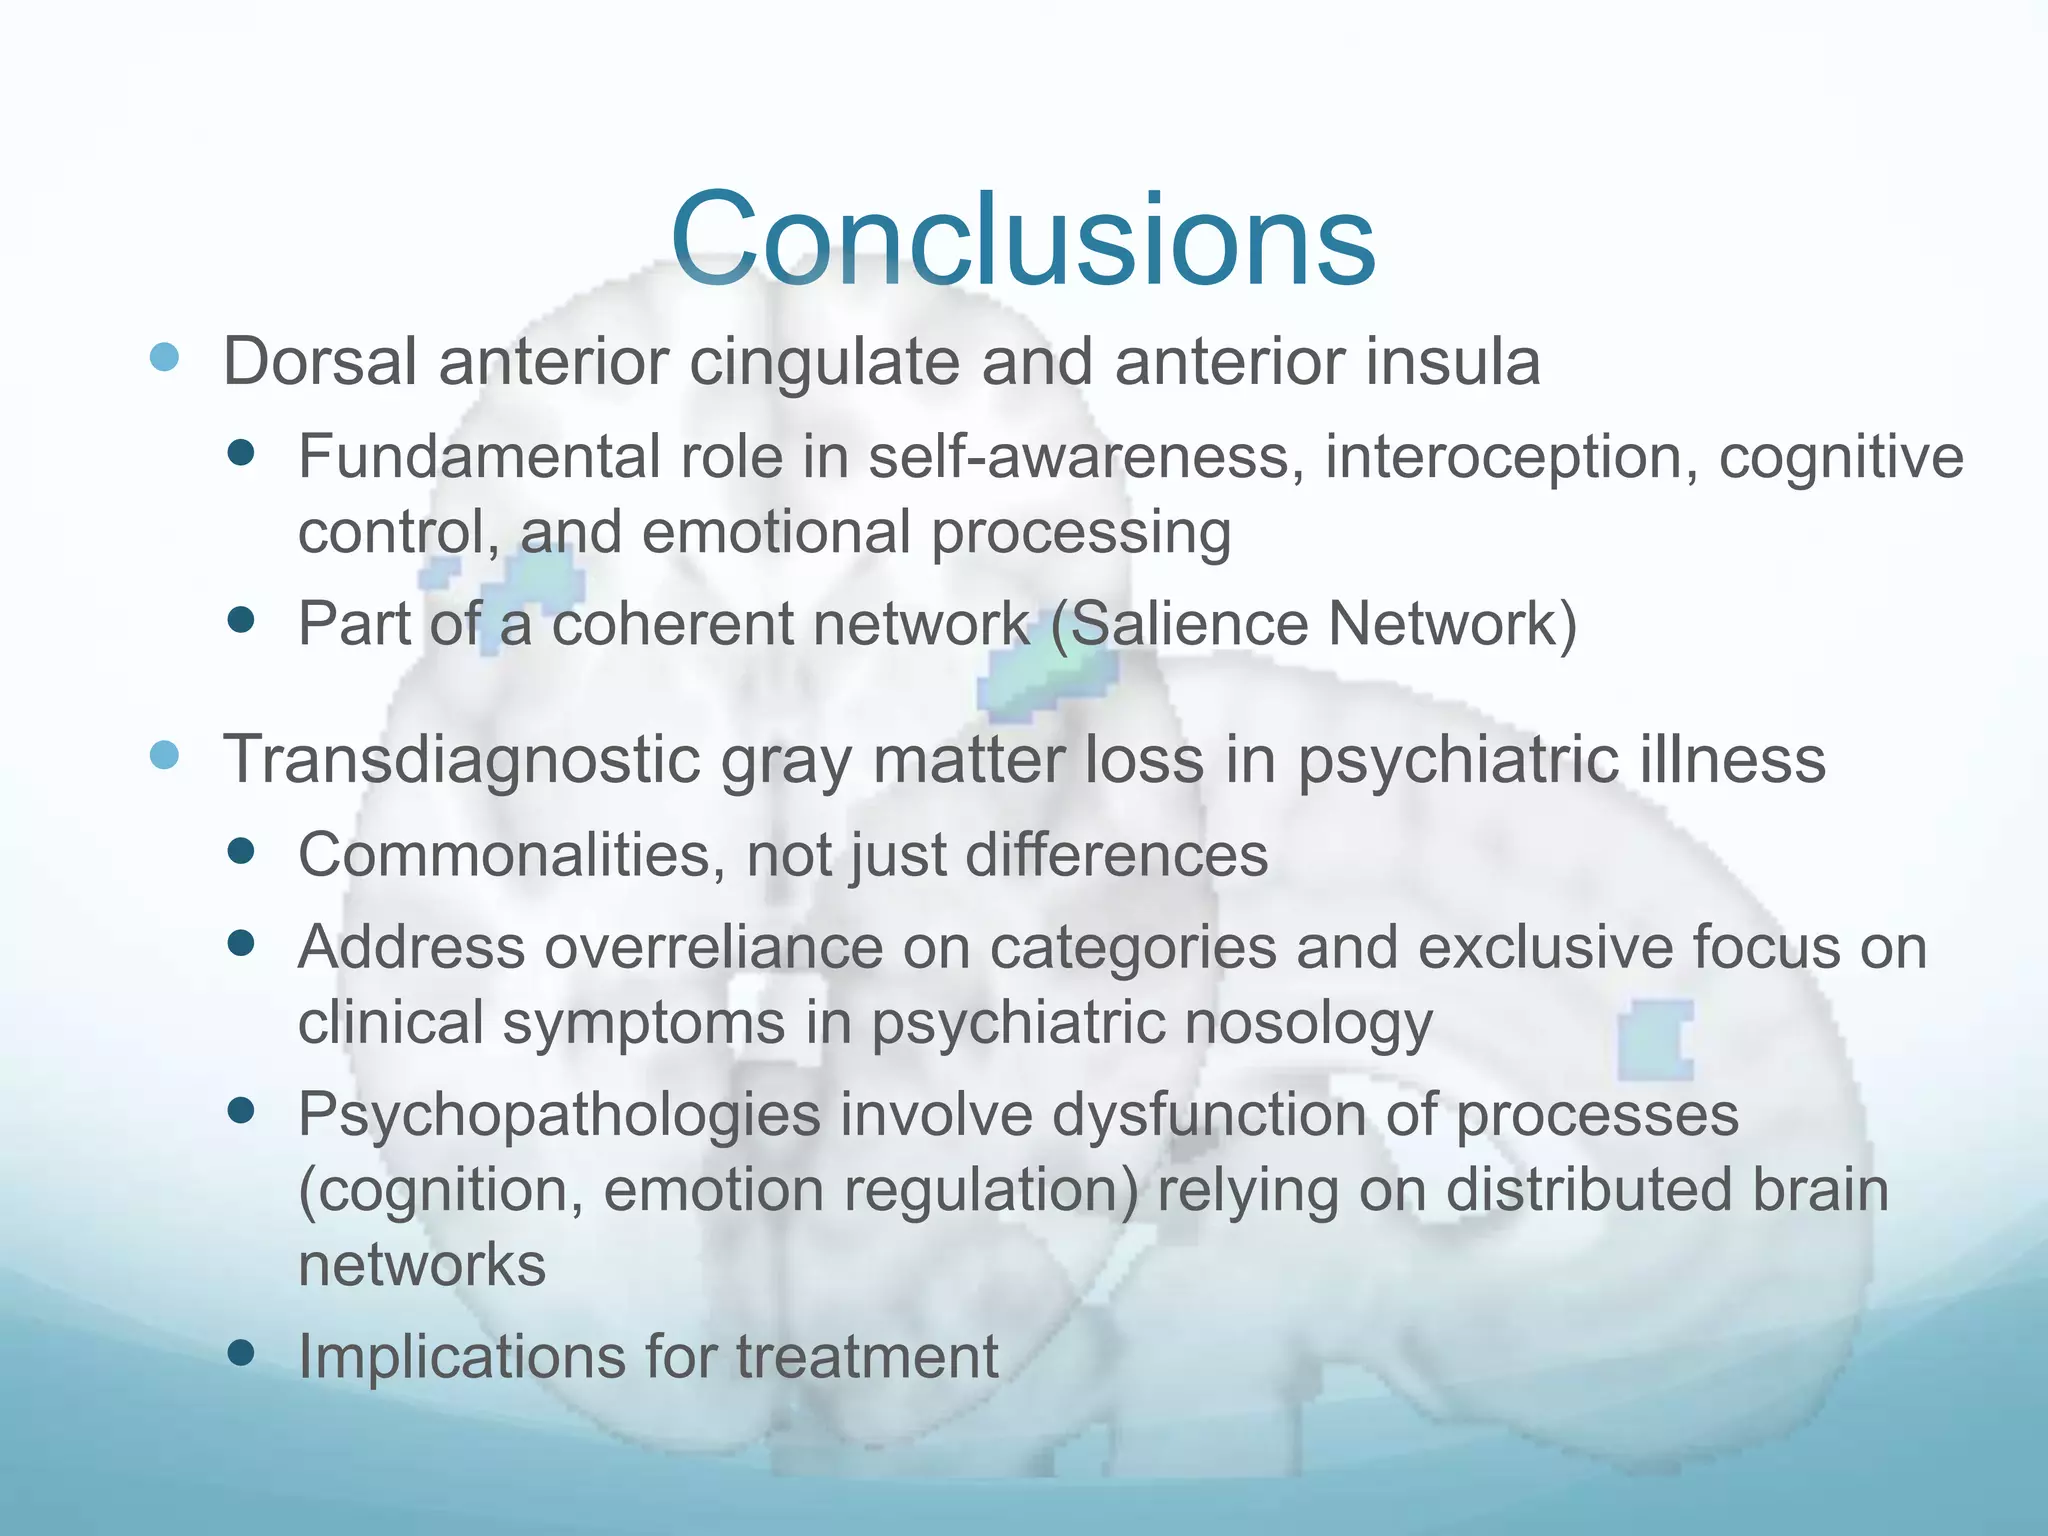
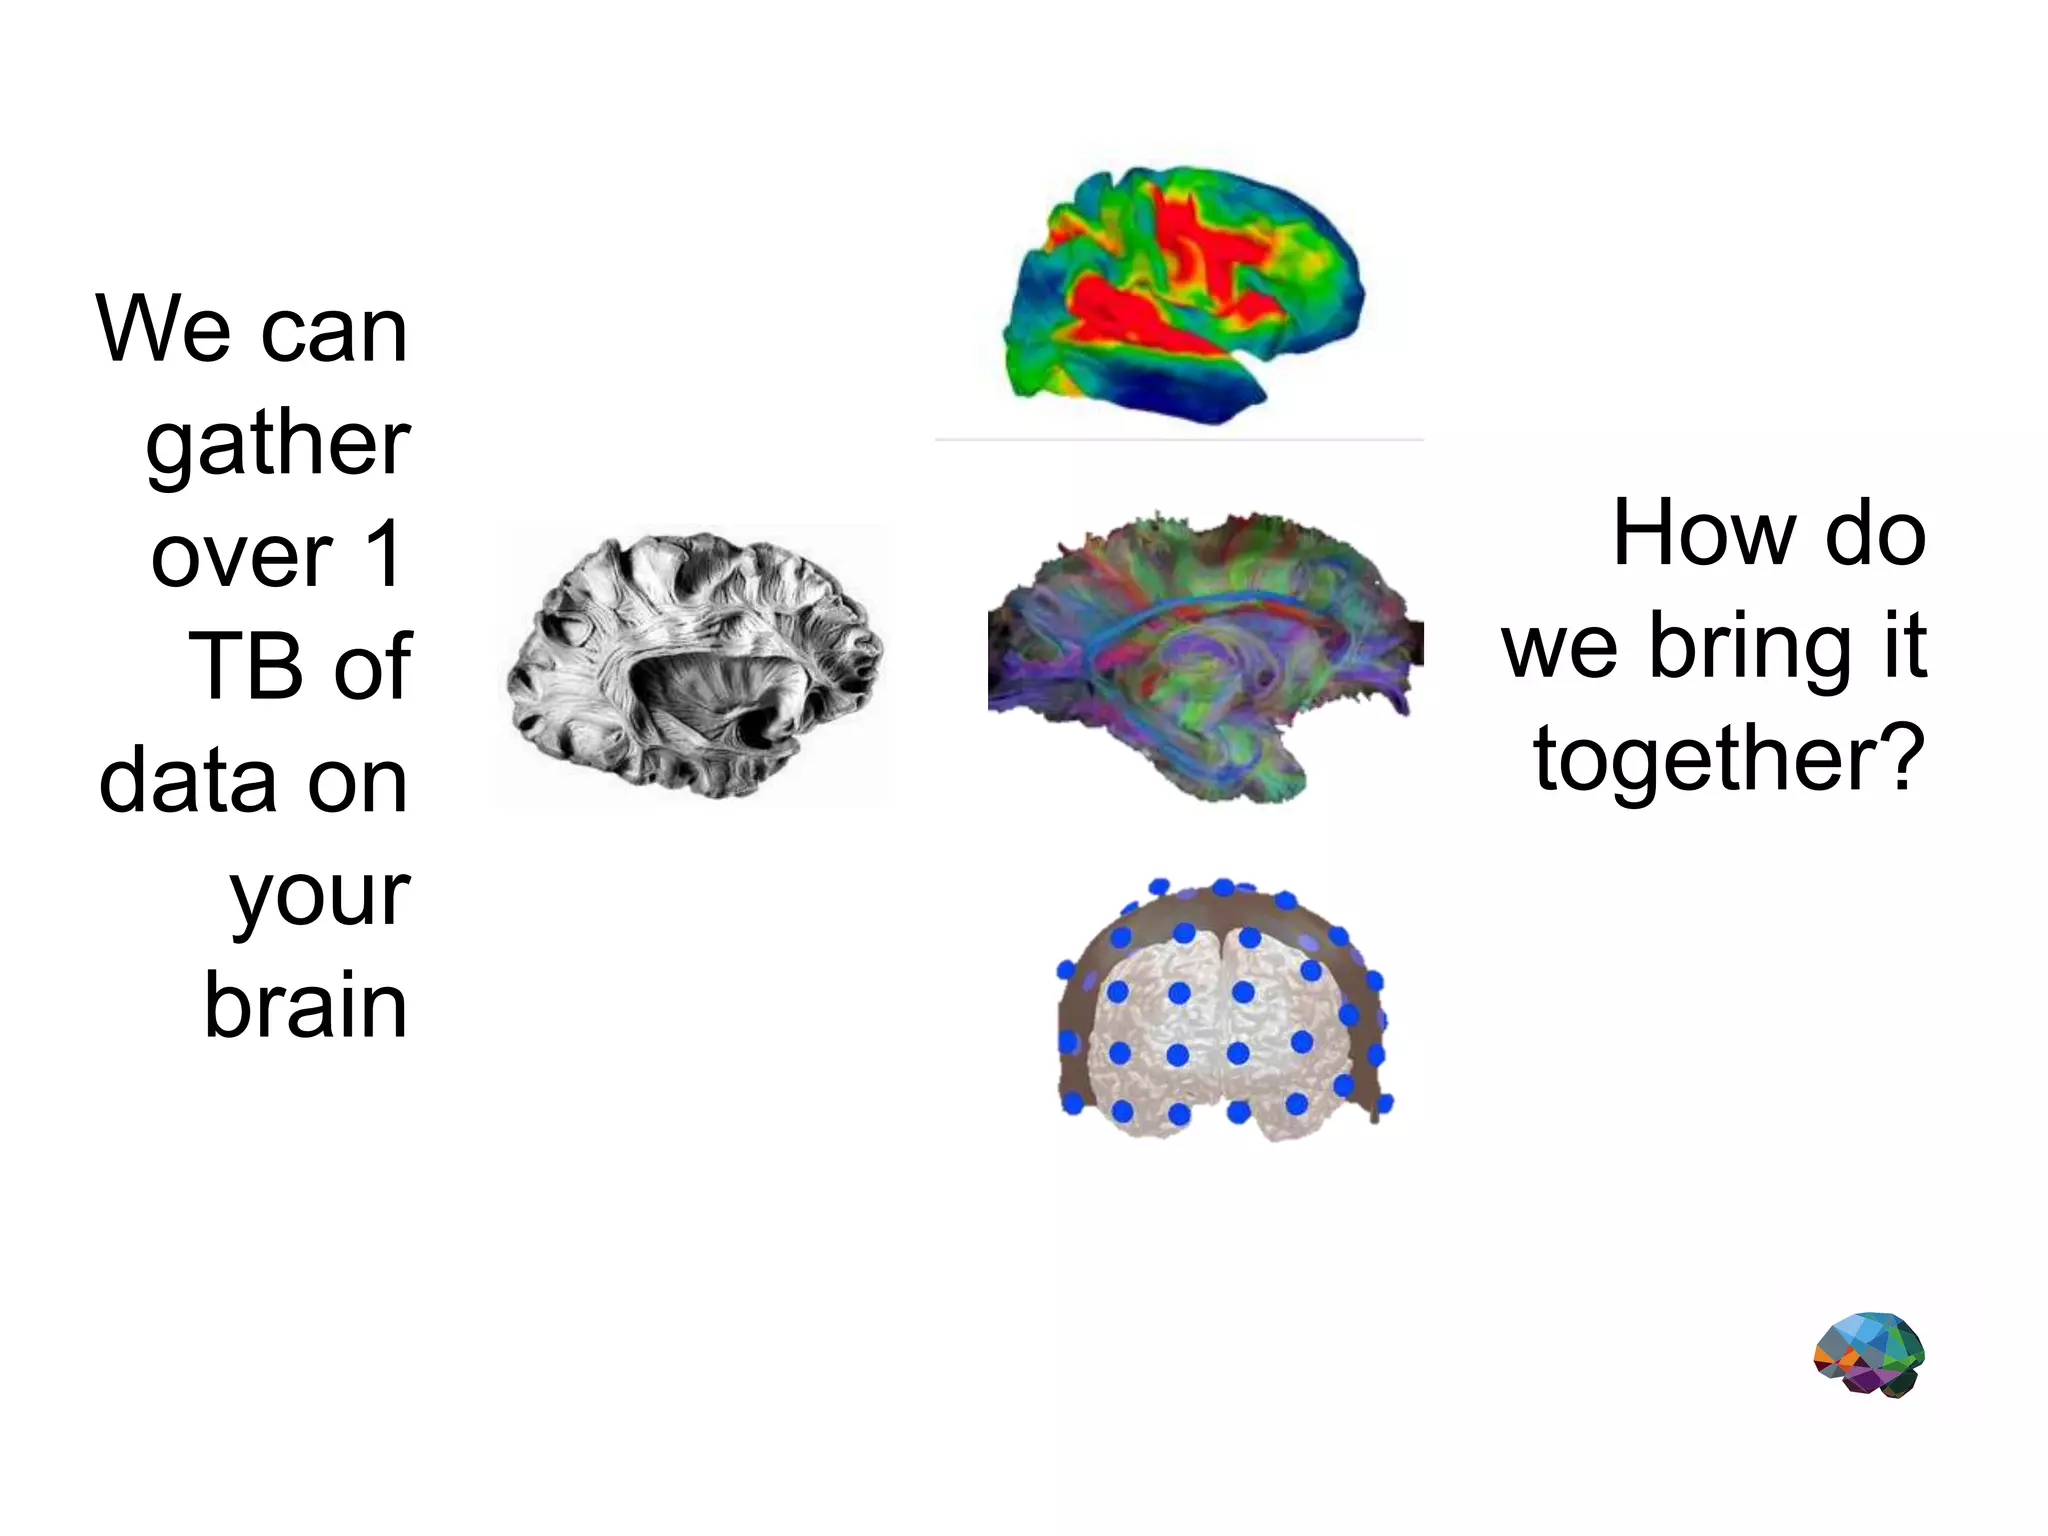
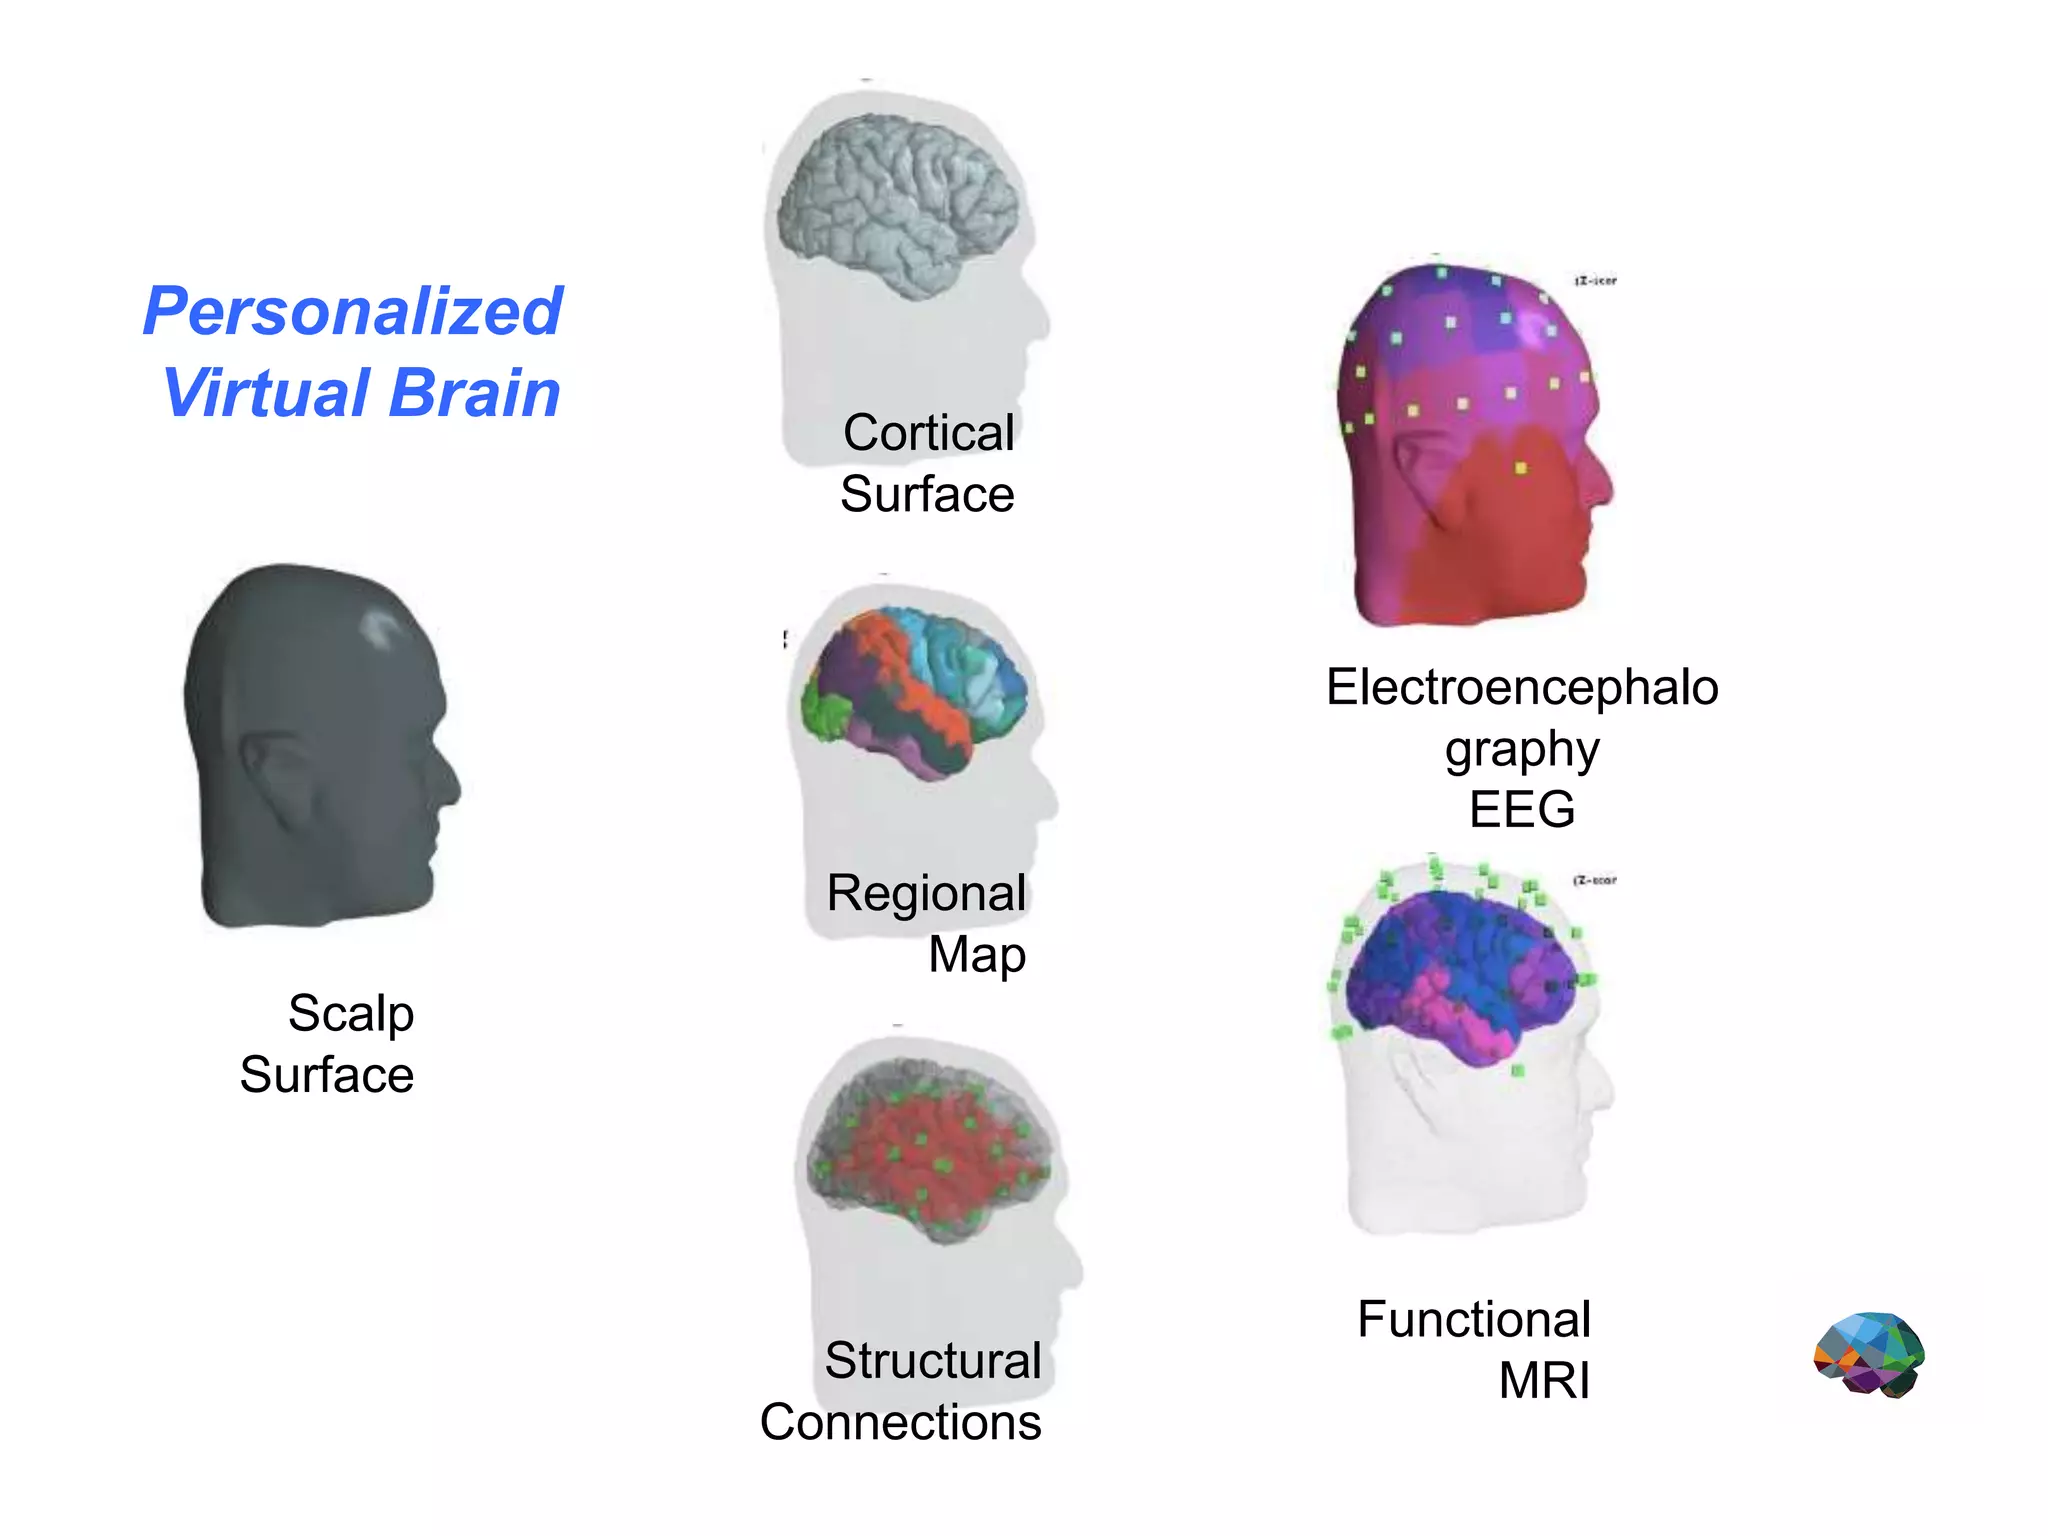
How to measure
and improve
brain-based
outcomes that
matter in health
care
How to measure and improve brain-based
outcomes that matter in health care
Chaired by: Alvaro Fernandez,
CEO of SharpBrains
Dr. Madeleine S Goodkind,
Staff Psychologist at
New Mexico VA Health Care System
Dr. Randy McIntosh,
VP of R&D at Baycrest’s
Rotman Research Institute
Chris Berka,
CEO and Co-Founder of
Advanced Brain Monitoring (ABM)
A Neurobiological
Substrate of Psychiatric
Disorders
Madeleine Goodkind, PhD
Staff Psychologist, New Mexico VA Healthcare System
Assistant Clinical Professor, University of New Mexico
School of Medicine
Introduction
 An example: PTSD
 Heterogeneity within the diagnosis
 Comorbidity is the norm
 Common symptoms across diagnoses
 Most studies, grants, treatments follow a
categorical approach
Research Domain Criteria
(RDoC)
 NIMH’s Strategic Plan: “Develop, for research
purposes, new ways of classifying mental disorders
based on dimensions of observable behavior and
neurobiological measures”.
 Emphasis:
 Dimensions that cut across diagnoses
 Neuroscience and behavioral science above descriptive
phenomenology
Why RDoC?
 Genes
 Common polymorphisms associated with a range
of psychiatric diagnoses
 Overlapping susceptibility across > 30,000 cases
 Brain
 Common processes (cognition, emotion regulation)
rely on distributed brain regions
 Disrupted in psychopathology
 Brain is organized into coherent functional
networks
 Abberant brain organization and networks in
psychopathology
Cross-Disorder Group of the Psychiatric Genomics Consortium, The Lancet, 2013;
Menon, TICS, 2011; Whitfield-Gabrieli & Ford, Annu Rev Clin Psychol, 2012
 Are there common areas of the brain impacted by
psychiatric illness?
 Voxel-based Morphometry (VBM)
 Statistical approach to identify differences in brain anatomy
between groups of people
 Break the brain down into voxels (3-D pixels) and compare
Strengths
 Assesses entire brain; standardized methods
 Stable measure in patients
 Lots of studies with lots of diagnoses
Structural markers in
Psychiatric Illness
 Search across VBM studies of psychiatric disorders
 Major Depressive Disorder
 Bipolar Disorder
 Schizophrenia
 OCD, PTSD, and other anxiety
disorders
 Substance Use Disorders
 193 studies, with 212 comparisons between patients and
controls
 7381 patients; 8511 controls
VBM Meta-analysis of
Psychiatric Illnesses
 Across diagnoses, 2 regions of common decreased
tissue volume:
2
4
6
Z
dACC
RL
insula
VBM Meta-analysis of
Psychiatric Illnesses
bilateral anterior insula
dorsal anterior cingulate cortex
Functional Connectivity
 In healthy controls, these 3 regions (dACC, bilateral
anterior insula)…
- Coactivate during tasks
dACC
insula
cingulate
R insulaL insula
overlap
(MACM)
cingulate
R insulaL insula
overlap
(FC)
- Show functional connectivity
during resting state
-3
-2
-1
0
1
2
-3 -2 -1 0 1 2 3
-3
-2
-1
0
1
2
-3 -2 -1 0 1 2 3
 In healthy controls,
regional brain volume is
associated with
cognitive performance
Correlations with cognition
Left Insula
executivefunction(z-score)
sustainedattention(z-score)
gray matter volume (z-score)
-3
-2
-1
0
1
2
-3 -2 -1 0 1 2 3
executivefunction(z-score)
dACC
Conclusions
 Dorsal anterior cingulate and anterior insula
 Fundamental role in self-awareness, interoception, cognitive
control, and emotional processing
 Part of a coherent network (Salience Network)
 Transdiagnostic gray matter loss in psychiatric illness
 Commonalities, not just differences
 Address overreliance on categories and exclusive focus on
clinical symptoms in psychiatric nosology
 Psychopathologies involve dysfunction of processes
(cognition, emotion regulation) relying on distributed brain
networks
 Implications for treatment
Thank you
& questions?
Randy McIntosh
Rotman Research Institute - Baycrest
How do
we bring it
together?
We can
gather
over 1
TB of
data on
your
brain
Need for a large-scale network-based thinking
time delays via long range connections
local connectivity
neural mass
Large-scale brain networks
Sanz Leon et al Front NeuroInformatics 2013
Real data are fed into
TheVirtualBrain to make a
person’s own brain model
Function
Structure
Modeled
Original
Connections This means you can use it now to
directly link computational models to
data
Virtual brain- data fitting
Ritter et al, Brain Connectivity, 2013
Fitting of individual’s EEG
wave forms
Stroke
Virtual Brain
Anatomical Model
Change in
Communication
Preliminary tests suggest the
parameter values for local
populations in a patient also predict
recovery of motor function!
Mapping the dynamic landscape in
stroke recovery
Whole brain Subcortical regions
Epilepsy patient: Geometry
Epilepsy patient: Fiber tracts
Epilepsy patient: Complex partial seizure
Simulation: Complex seizure – the whole system
Task: Spread between
both hippocampi
Run simulations:
Different epilepto-
genicity values for
cross-hippocampus
paths
Jirsa et al Brain (2014); Proix et al JNS (under review); Proix et al (in
preparation)
26
Personalized brain models
27
Constructing subject-specific
Virtual Brains
Schirner, Rothmeier, Jirsa, McIntosh, Ritter (2015) Neuroimage
An automated pipeline for constructing personalized virtual brains from multimodal neuroimaging data
Scalp
Surface
Regional
Map
Cortical
Surface
Electroencephalo
graphy
EEG
Functional
MRIStructural
Connections
Personalized
Virtual Brain
Presented by:
Chris Berka
CEO & Co-Founder
EEG Biomarkers: Day & Night
For over fifteen years, ABM has pioneered the development
of mobile, scalable, and easy-to-use platform technologies
to monitor and interpret physiological signals.
• Recipient of over $32 mm in government R&D funding
• 20 patents issued; 11 patents-pending
• ISO 13485 and FDA Device Manufacturer
• Clinical trial capabilities:
• Scalable data acquisition and analyses
• Study site training, certification, and support
• Fully compliant with all regulatory guidelines (21 CFR Part 11; HIPPA)
• Inc. 5000 Fastest Growing Companies five consecutive years
• 70+ papers validating suite of technologies
• Worldwide distribution networks
• Over 500 customers worldwide including 14 Fortune 500 clients
Company Profile
Electroencephalography (EEG) provides cost-effective
neuroassessment that is exquisitely sensitive to CNS
disease and treatment efficacy
Daytime EEG captures activation of neural circuits during
resting state or while performing neurocognitive tasks.
ABM Stat X-Series EEG systems acquire up to 24
channels of EEG during resting state or activation tasks.
Nighttime EEG captures sleep quality and architecture as
well as discrete processes underlying cognitive functions
(e.g., memory consolidation).
ABM Sleep Profiler™, multi-night sleep architecture,
spindles, atonia, hypoxemia, and arousals
Converging EEG biomarkers confer increased reliability,
sensitivity, and specificity, for tracking disease
progression and/or treatment response.
FDA cleared mobile wireless EEG features:
• Lightweight & comfortable headset
• Rapid, efficient set-up & cleaning
• 20m wireless transmission with real-time signal quality monitoring
• Saves data in EDF for compatibility
• Secure data management portal
Epoch-by-Epoch
Changes Over Time
Epoch lengths ranging from
0.5 sec to several minutes
Power Spectral Densities
1-40 Hz, Relative or
Absolute
Custom bins or bands
Traditional Bands
Delta (1-3)
Theta (3-7)
Alpha (8-13)
Beta (13-30)
Gamma (25-40)
High Gamma (40+)
Wavelets
Topographic Mapping
frontal, central, parietal,
left, midline, right
Automated detection of
epileptiform EEG
Event Locked
Analyses
Events can be external stimuli,
responses, or biological
Pre- and Post-Event Analyses
ERPs
Averaged over trials
Averaged over sites for
single-trial ERPs
Enables regional
comparisons
Measurement tools for
amplitude latency
area-under-the-curve
PERPs (PSDs)
ERD / ERS
Event related B-Alert
Metrics
LORETA/sLORETA
3D Imaging
Resting-state brain connectivity
analysis and modeling
EEG coherence and
phase-related analyses
Compute amplitude
asymmetry
Real-time 3-Dimensional
Source and Network
Dynamics
Brodmann Areas: source
correlations, coherence, and
phase differences
Adaptive neurofeedback:
Z-Score, and LORETA Z-Score
EEG Analysis Approaches
AMP Introduction
Alertness & Memory Profiler
Clinical Research Applications
• Quantified excessive daytime sleepiness and
neurocognitive deficits in OSA patients (NYU); quantified
treatment outcomes CPAP and oral appliance therapy
• Validated nutraceutical Omega-3 fatty acids efficacy in
mitigating effects of sleep deprivation
• Creating neurocognitive drug profiles: amphetamines,
benzos, marijuana
• Characterizing HIV-associated cognitive decline (UCSD,
Sharp Hospital)
• Identifying biomarkers for Mood Disorders, PTSD
• Characterizing cognitive decline in PD/PDD (Scripps, UI)
10 neuro-psych tests with synchronized EEG and/or
ECG from any B-Alert system
JAVA-based platform for web delivery to any tablet or
desktop interface
Automated measures of cognitive engagement and
workload, with comparison to normative database
• FDA cleared for assessment of sleep architecture and sleep continuity
• Record 16+ hrs without battery charge; Easily self-applied before bed
• Frontal EEG, pulse rate, snoring, head movement and position, with
optional EMG or ECG
• Automated sleep staging - Validation: International Archives of Medicine
• Cloud based processing, over-scoring, and report generation
In-home Sleep Studies
CNS Disease and
Cognitive/Clinical
Symptom
Nighttime EEG Daytime EEG
Parkinson’s Disease
and Dementia
REM Sleep w/o Atonia,
EMG, Sleep Disordered
Breathing, Limb
Movements
Asymmetries in ERPs,
PSDs, and Band Ratios
across Brain Regions
during Resting State
Mood and Anxiety
REM Latency, REM
Duration and Density,
Light NREM, Autonomic
Activation
ERPs, HRV, Cordance, &
Circuit-Level Engagement
during Emotion Tasks
Memory Functions
Slow Wave Activity, Sleep
Quality, Spindle Frequency
and Type
ERPs, Phase-Amplitude
Coupling (PAC), and
Coherence during
Memory Tasks
Attention/Executive
Processes
Sleep Continuity, Spindle
Density, REM Density,
Hypoxemia
ERPs, Coherence, &
Circuit-Level Engagement
during Vigilance and
Executive Function Tasks
EEG-Based Biomarkers
Bandwidth Power Spectral Density
(PSD) Analysis
• Analyzed a (Biogen-owned) database of
Healthy controls and Alzheimer’s patients:
• Computed PSDs for all standard bands:
delta, theta, alpha, sigma, beta, gamma.
• Found statistically significant differences
between AD (L) and healthy controls (R) in:
– alpha: largest decrease in the parietal, posterior
temporal, and right temporal
– sigma: universal decrease across all regions
– beta: universal decrease across all regions
• Significance determined by one-way ANOVA
(p < 0.05).
• Results align with findings in the literature.
EEG-Based AD Analysis
Low Resolution Electromagnetic Tomography Analysis
• LORETA 3D source analysis can
identify and map excessive and/or
reduced current sources in the
brain.
• Can analyze amplitude
asymmetry, EEG coherence, and
EEG phase.
 can compare these measures
against a database of age-
matched controls to detect
abnormalities.
Elevated sLORETA current sources
were present in the parietal lobe of the
postcentral gyrus and the inferior
parietal lobule with a maximum at 7
Hz (Brodmann areas 2, 5, & 40)
Example of LORETA with AD
Example of Coherence Analyses in Parkinson’s
Patients implanted for DBS:
Illustration of abnormal theta
coherence patterns (i.e.,
increase in frontal, decrease in
parietal) characteristic of
Parkinson’s Disease
(Sarnthein, 2007).
Eyes Closed Z-Scored FFT Coherence from a PD patient
(1005) in Theta (L), Beta (C), and High Beta (R).
Emotion Elicitation Testbed:
International Affective Picture System (IAPS)
• 1000+ emotionally stimulating pictures
• Designed to investigate positive, negative, and neutral emotions
• Normative ratings were developed from a large sample
• Emotional Faces Image Recognition
– N170 component is modulated with emotion:
– Negative stimulus - Amplitude increase
– Mood disorder patients – amplitude increase abolished
Other Empathy/Emotion Elicitation Testbeds:
• Empathy Videos: social interation, aimed to elicit mu suppression (UCSD)
• Narrative Networks: storytelling paradigm based upon themes of justice (DARPA, Boeing)
• Eustress/Distress Videos: clips that evoke humor and/or stress (Loma Linda Univ.)
• Mental Imagery: visualization of different emotional states
*Lang, P.J., Bradley, M.M., & Cuthbert, B.N. (2008). International affective picture system (IAPS): Affective
ratings of pictures and instruction manual. Technical Report A-8. University of Florida, Gainesville, FL
Biomarkers of Emotion
• Heart Rate Variability increases in response to stressful stimuli in both groups
• PTS subjects exhibit increased gamma activity in response to stressful stimuli
• PTS group displays a heightened
response at initial stimulus onset,
suggesting recognition of task but
impaired attention resources and
processing.
• Data suggest a possible association
with hypervigilance.
ERPs during 3CVT
Post Traumatic Stress Assessment
Closed-loop EEG/FES Neurorehabilitation
EEG provides real-time spatial and spectral information during adaptive rehab
Partnership with U Miami Project to Cure Paralysis
EEG maps cortical plasticity post-injury & throughout rehab
Spinal Cord Injury
Summit is on Lunch.
(we will resume at 12:30pm Pacific Time)
Chat forums will be available during the Watercooler session
To learn more, visit sharpbrains.com

How to mea­sure and improve brain-based out­comes that mat­ter in health care

  • 1.
    How to measure andimprove brain-based outcomes that matter in health care
  • 2.
    How to measureand improve brain-based outcomes that matter in health care Chaired by: Alvaro Fernandez, CEO of SharpBrains Dr. Madeleine S Goodkind, Staff Psychologist at New Mexico VA Health Care System Dr. Randy McIntosh, VP of R&D at Baycrest’s Rotman Research Institute Chris Berka, CEO and Co-Founder of Advanced Brain Monitoring (ABM)
  • 3.
    A Neurobiological Substrate ofPsychiatric Disorders Madeleine Goodkind, PhD Staff Psychologist, New Mexico VA Healthcare System Assistant Clinical Professor, University of New Mexico School of Medicine
  • 4.
    Introduction  An example:PTSD  Heterogeneity within the diagnosis  Comorbidity is the norm  Common symptoms across diagnoses  Most studies, grants, treatments follow a categorical approach
  • 5.
    Research Domain Criteria (RDoC) NIMH’s Strategic Plan: “Develop, for research purposes, new ways of classifying mental disorders based on dimensions of observable behavior and neurobiological measures”.  Emphasis:  Dimensions that cut across diagnoses  Neuroscience and behavioral science above descriptive phenomenology
  • 6.
    Why RDoC?  Genes Common polymorphisms associated with a range of psychiatric diagnoses  Overlapping susceptibility across > 30,000 cases  Brain  Common processes (cognition, emotion regulation) rely on distributed brain regions  Disrupted in psychopathology  Brain is organized into coherent functional networks  Abberant brain organization and networks in psychopathology Cross-Disorder Group of the Psychiatric Genomics Consortium, The Lancet, 2013; Menon, TICS, 2011; Whitfield-Gabrieli & Ford, Annu Rev Clin Psychol, 2012
  • 7.
     Are therecommon areas of the brain impacted by psychiatric illness?  Voxel-based Morphometry (VBM)  Statistical approach to identify differences in brain anatomy between groups of people  Break the brain down into voxels (3-D pixels) and compare Strengths  Assesses entire brain; standardized methods  Stable measure in patients  Lots of studies with lots of diagnoses Structural markers in Psychiatric Illness
  • 8.
     Search acrossVBM studies of psychiatric disorders  Major Depressive Disorder  Bipolar Disorder  Schizophrenia  OCD, PTSD, and other anxiety disorders  Substance Use Disorders  193 studies, with 212 comparisons between patients and controls  7381 patients; 8511 controls VBM Meta-analysis of Psychiatric Illnesses
  • 9.
     Across diagnoses,2 regions of common decreased tissue volume: 2 4 6 Z dACC RL insula VBM Meta-analysis of Psychiatric Illnesses bilateral anterior insula dorsal anterior cingulate cortex
  • 10.
    Functional Connectivity  Inhealthy controls, these 3 regions (dACC, bilateral anterior insula)… - Coactivate during tasks dACC insula cingulate R insulaL insula overlap (MACM) cingulate R insulaL insula overlap (FC) - Show functional connectivity during resting state
  • 11.
    -3 -2 -1 0 1 2 -3 -2 -10 1 2 3 -3 -2 -1 0 1 2 -3 -2 -1 0 1 2 3  In healthy controls, regional brain volume is associated with cognitive performance Correlations with cognition Left Insula executivefunction(z-score) sustainedattention(z-score) gray matter volume (z-score) -3 -2 -1 0 1 2 -3 -2 -1 0 1 2 3 executivefunction(z-score) dACC
  • 12.
    Conclusions  Dorsal anteriorcingulate and anterior insula  Fundamental role in self-awareness, interoception, cognitive control, and emotional processing  Part of a coherent network (Salience Network)  Transdiagnostic gray matter loss in psychiatric illness  Commonalities, not just differences  Address overreliance on categories and exclusive focus on clinical symptoms in psychiatric nosology  Psychopathologies involve dysfunction of processes (cognition, emotion regulation) relying on distributed brain networks  Implications for treatment
  • 13.
  • 14.
    Randy McIntosh Rotman ResearchInstitute - Baycrest
  • 15.
    How do we bringit together? We can gather over 1 TB of data on your brain
  • 16.
    Need for alarge-scale network-based thinking time delays via long range connections local connectivity neural mass Large-scale brain networks
  • 17.
    Sanz Leon etal Front NeuroInformatics 2013
  • 18.
    Real data arefed into TheVirtualBrain to make a person’s own brain model Function Structure Modeled Original Connections This means you can use it now to directly link computational models to data
  • 19.
    Virtual brain- datafitting Ritter et al, Brain Connectivity, 2013 Fitting of individual’s EEG wave forms
  • 20.
  • 21.
    Preliminary tests suggestthe parameter values for local populations in a patient also predict recovery of motor function! Mapping the dynamic landscape in stroke recovery
  • 22.
    Whole brain Subcorticalregions Epilepsy patient: Geometry
  • 23.
  • 24.
  • 25.
    Simulation: Complex seizure– the whole system Task: Spread between both hippocampi Run simulations: Different epilepto- genicity values for cross-hippocampus paths Jirsa et al Brain (2014); Proix et al JNS (under review); Proix et al (in preparation)
  • 26.
  • 27.
    27 Constructing subject-specific Virtual Brains Schirner,Rothmeier, Jirsa, McIntosh, Ritter (2015) Neuroimage An automated pipeline for constructing personalized virtual brains from multimodal neuroimaging data
  • 28.
  • 30.
    Presented by: Chris Berka CEO& Co-Founder EEG Biomarkers: Day & Night
  • 31.
    For over fifteenyears, ABM has pioneered the development of mobile, scalable, and easy-to-use platform technologies to monitor and interpret physiological signals. • Recipient of over $32 mm in government R&D funding • 20 patents issued; 11 patents-pending • ISO 13485 and FDA Device Manufacturer • Clinical trial capabilities: • Scalable data acquisition and analyses • Study site training, certification, and support • Fully compliant with all regulatory guidelines (21 CFR Part 11; HIPPA) • Inc. 5000 Fastest Growing Companies five consecutive years • 70+ papers validating suite of technologies • Worldwide distribution networks • Over 500 customers worldwide including 14 Fortune 500 clients Company Profile
  • 32.
    Electroencephalography (EEG) providescost-effective neuroassessment that is exquisitely sensitive to CNS disease and treatment efficacy Daytime EEG captures activation of neural circuits during resting state or while performing neurocognitive tasks. ABM Stat X-Series EEG systems acquire up to 24 channels of EEG during resting state or activation tasks. Nighttime EEG captures sleep quality and architecture as well as discrete processes underlying cognitive functions (e.g., memory consolidation). ABM Sleep Profiler™, multi-night sleep architecture, spindles, atonia, hypoxemia, and arousals Converging EEG biomarkers confer increased reliability, sensitivity, and specificity, for tracking disease progression and/or treatment response.
  • 33.
    FDA cleared mobilewireless EEG features: • Lightweight & comfortable headset • Rapid, efficient set-up & cleaning • 20m wireless transmission with real-time signal quality monitoring • Saves data in EDF for compatibility • Secure data management portal
  • 34.
    Epoch-by-Epoch Changes Over Time Epochlengths ranging from 0.5 sec to several minutes Power Spectral Densities 1-40 Hz, Relative or Absolute Custom bins or bands Traditional Bands Delta (1-3) Theta (3-7) Alpha (8-13) Beta (13-30) Gamma (25-40) High Gamma (40+) Wavelets Topographic Mapping frontal, central, parietal, left, midline, right Automated detection of epileptiform EEG Event Locked Analyses Events can be external stimuli, responses, or biological Pre- and Post-Event Analyses ERPs Averaged over trials Averaged over sites for single-trial ERPs Enables regional comparisons Measurement tools for amplitude latency area-under-the-curve PERPs (PSDs) ERD / ERS Event related B-Alert Metrics LORETA/sLORETA 3D Imaging Resting-state brain connectivity analysis and modeling EEG coherence and phase-related analyses Compute amplitude asymmetry Real-time 3-Dimensional Source and Network Dynamics Brodmann Areas: source correlations, coherence, and phase differences Adaptive neurofeedback: Z-Score, and LORETA Z-Score EEG Analysis Approaches
  • 35.
    AMP Introduction Alertness &Memory Profiler Clinical Research Applications • Quantified excessive daytime sleepiness and neurocognitive deficits in OSA patients (NYU); quantified treatment outcomes CPAP and oral appliance therapy • Validated nutraceutical Omega-3 fatty acids efficacy in mitigating effects of sleep deprivation • Creating neurocognitive drug profiles: amphetamines, benzos, marijuana • Characterizing HIV-associated cognitive decline (UCSD, Sharp Hospital) • Identifying biomarkers for Mood Disorders, PTSD • Characterizing cognitive decline in PD/PDD (Scripps, UI) 10 neuro-psych tests with synchronized EEG and/or ECG from any B-Alert system JAVA-based platform for web delivery to any tablet or desktop interface Automated measures of cognitive engagement and workload, with comparison to normative database
  • 36.
    • FDA clearedfor assessment of sleep architecture and sleep continuity • Record 16+ hrs without battery charge; Easily self-applied before bed • Frontal EEG, pulse rate, snoring, head movement and position, with optional EMG or ECG • Automated sleep staging - Validation: International Archives of Medicine • Cloud based processing, over-scoring, and report generation In-home Sleep Studies
  • 37.
    CNS Disease and Cognitive/Clinical Symptom NighttimeEEG Daytime EEG Parkinson’s Disease and Dementia REM Sleep w/o Atonia, EMG, Sleep Disordered Breathing, Limb Movements Asymmetries in ERPs, PSDs, and Band Ratios across Brain Regions during Resting State Mood and Anxiety REM Latency, REM Duration and Density, Light NREM, Autonomic Activation ERPs, HRV, Cordance, & Circuit-Level Engagement during Emotion Tasks Memory Functions Slow Wave Activity, Sleep Quality, Spindle Frequency and Type ERPs, Phase-Amplitude Coupling (PAC), and Coherence during Memory Tasks Attention/Executive Processes Sleep Continuity, Spindle Density, REM Density, Hypoxemia ERPs, Coherence, & Circuit-Level Engagement during Vigilance and Executive Function Tasks EEG-Based Biomarkers
  • 38.
    Bandwidth Power SpectralDensity (PSD) Analysis • Analyzed a (Biogen-owned) database of Healthy controls and Alzheimer’s patients: • Computed PSDs for all standard bands: delta, theta, alpha, sigma, beta, gamma. • Found statistically significant differences between AD (L) and healthy controls (R) in: – alpha: largest decrease in the parietal, posterior temporal, and right temporal – sigma: universal decrease across all regions – beta: universal decrease across all regions • Significance determined by one-way ANOVA (p < 0.05). • Results align with findings in the literature. EEG-Based AD Analysis
  • 39.
    Low Resolution ElectromagneticTomography Analysis • LORETA 3D source analysis can identify and map excessive and/or reduced current sources in the brain. • Can analyze amplitude asymmetry, EEG coherence, and EEG phase.  can compare these measures against a database of age- matched controls to detect abnormalities. Elevated sLORETA current sources were present in the parietal lobe of the postcentral gyrus and the inferior parietal lobule with a maximum at 7 Hz (Brodmann areas 2, 5, & 40) Example of LORETA with AD
  • 40.
    Example of CoherenceAnalyses in Parkinson’s Patients implanted for DBS: Illustration of abnormal theta coherence patterns (i.e., increase in frontal, decrease in parietal) characteristic of Parkinson’s Disease (Sarnthein, 2007). Eyes Closed Z-Scored FFT Coherence from a PD patient (1005) in Theta (L), Beta (C), and High Beta (R).
  • 41.
    Emotion Elicitation Testbed: InternationalAffective Picture System (IAPS) • 1000+ emotionally stimulating pictures • Designed to investigate positive, negative, and neutral emotions • Normative ratings were developed from a large sample • Emotional Faces Image Recognition – N170 component is modulated with emotion: – Negative stimulus - Amplitude increase – Mood disorder patients – amplitude increase abolished Other Empathy/Emotion Elicitation Testbeds: • Empathy Videos: social interation, aimed to elicit mu suppression (UCSD) • Narrative Networks: storytelling paradigm based upon themes of justice (DARPA, Boeing) • Eustress/Distress Videos: clips that evoke humor and/or stress (Loma Linda Univ.) • Mental Imagery: visualization of different emotional states *Lang, P.J., Bradley, M.M., & Cuthbert, B.N. (2008). International affective picture system (IAPS): Affective ratings of pictures and instruction manual. Technical Report A-8. University of Florida, Gainesville, FL Biomarkers of Emotion
  • 42.
    • Heart RateVariability increases in response to stressful stimuli in both groups • PTS subjects exhibit increased gamma activity in response to stressful stimuli • PTS group displays a heightened response at initial stimulus onset, suggesting recognition of task but impaired attention resources and processing. • Data suggest a possible association with hypervigilance. ERPs during 3CVT Post Traumatic Stress Assessment
  • 43.
    Closed-loop EEG/FES Neurorehabilitation EEGprovides real-time spatial and spectral information during adaptive rehab Partnership with U Miami Project to Cure Paralysis EEG maps cortical plasticity post-injury & throughout rehab Spinal Cord Injury
  • 44.
    Summit is onLunch. (we will resume at 12:30pm Pacific Time) Chat forums will be available during the Watercooler session
  • 45.
    To learn more,visit sharpbrains.com

Editor's Notes