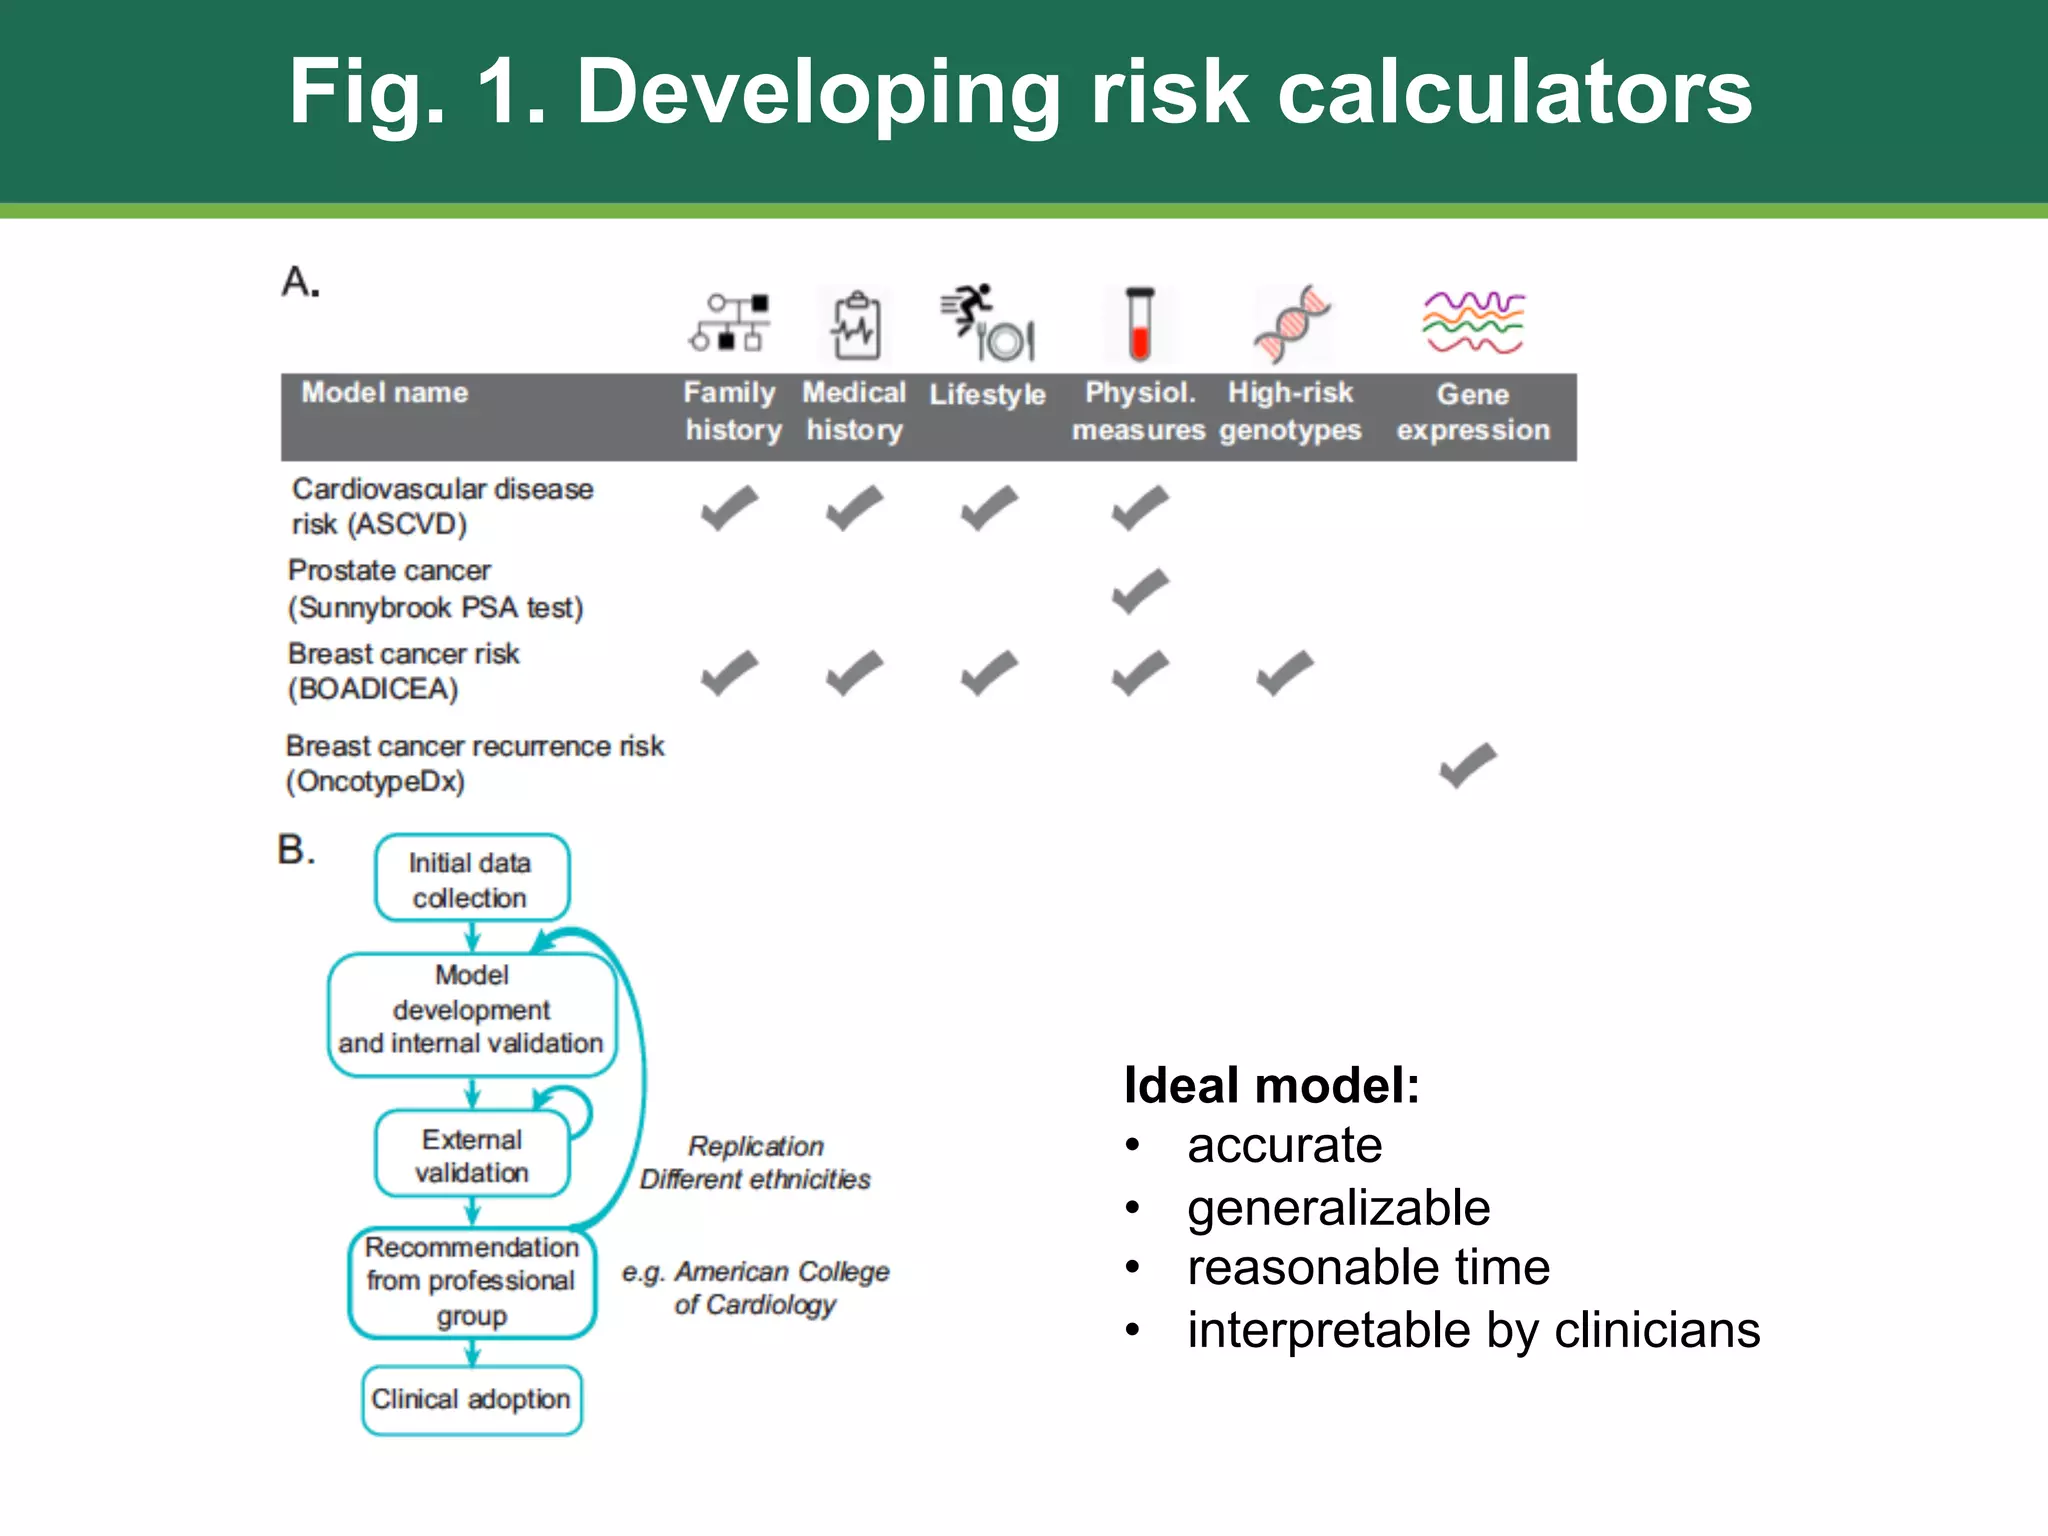
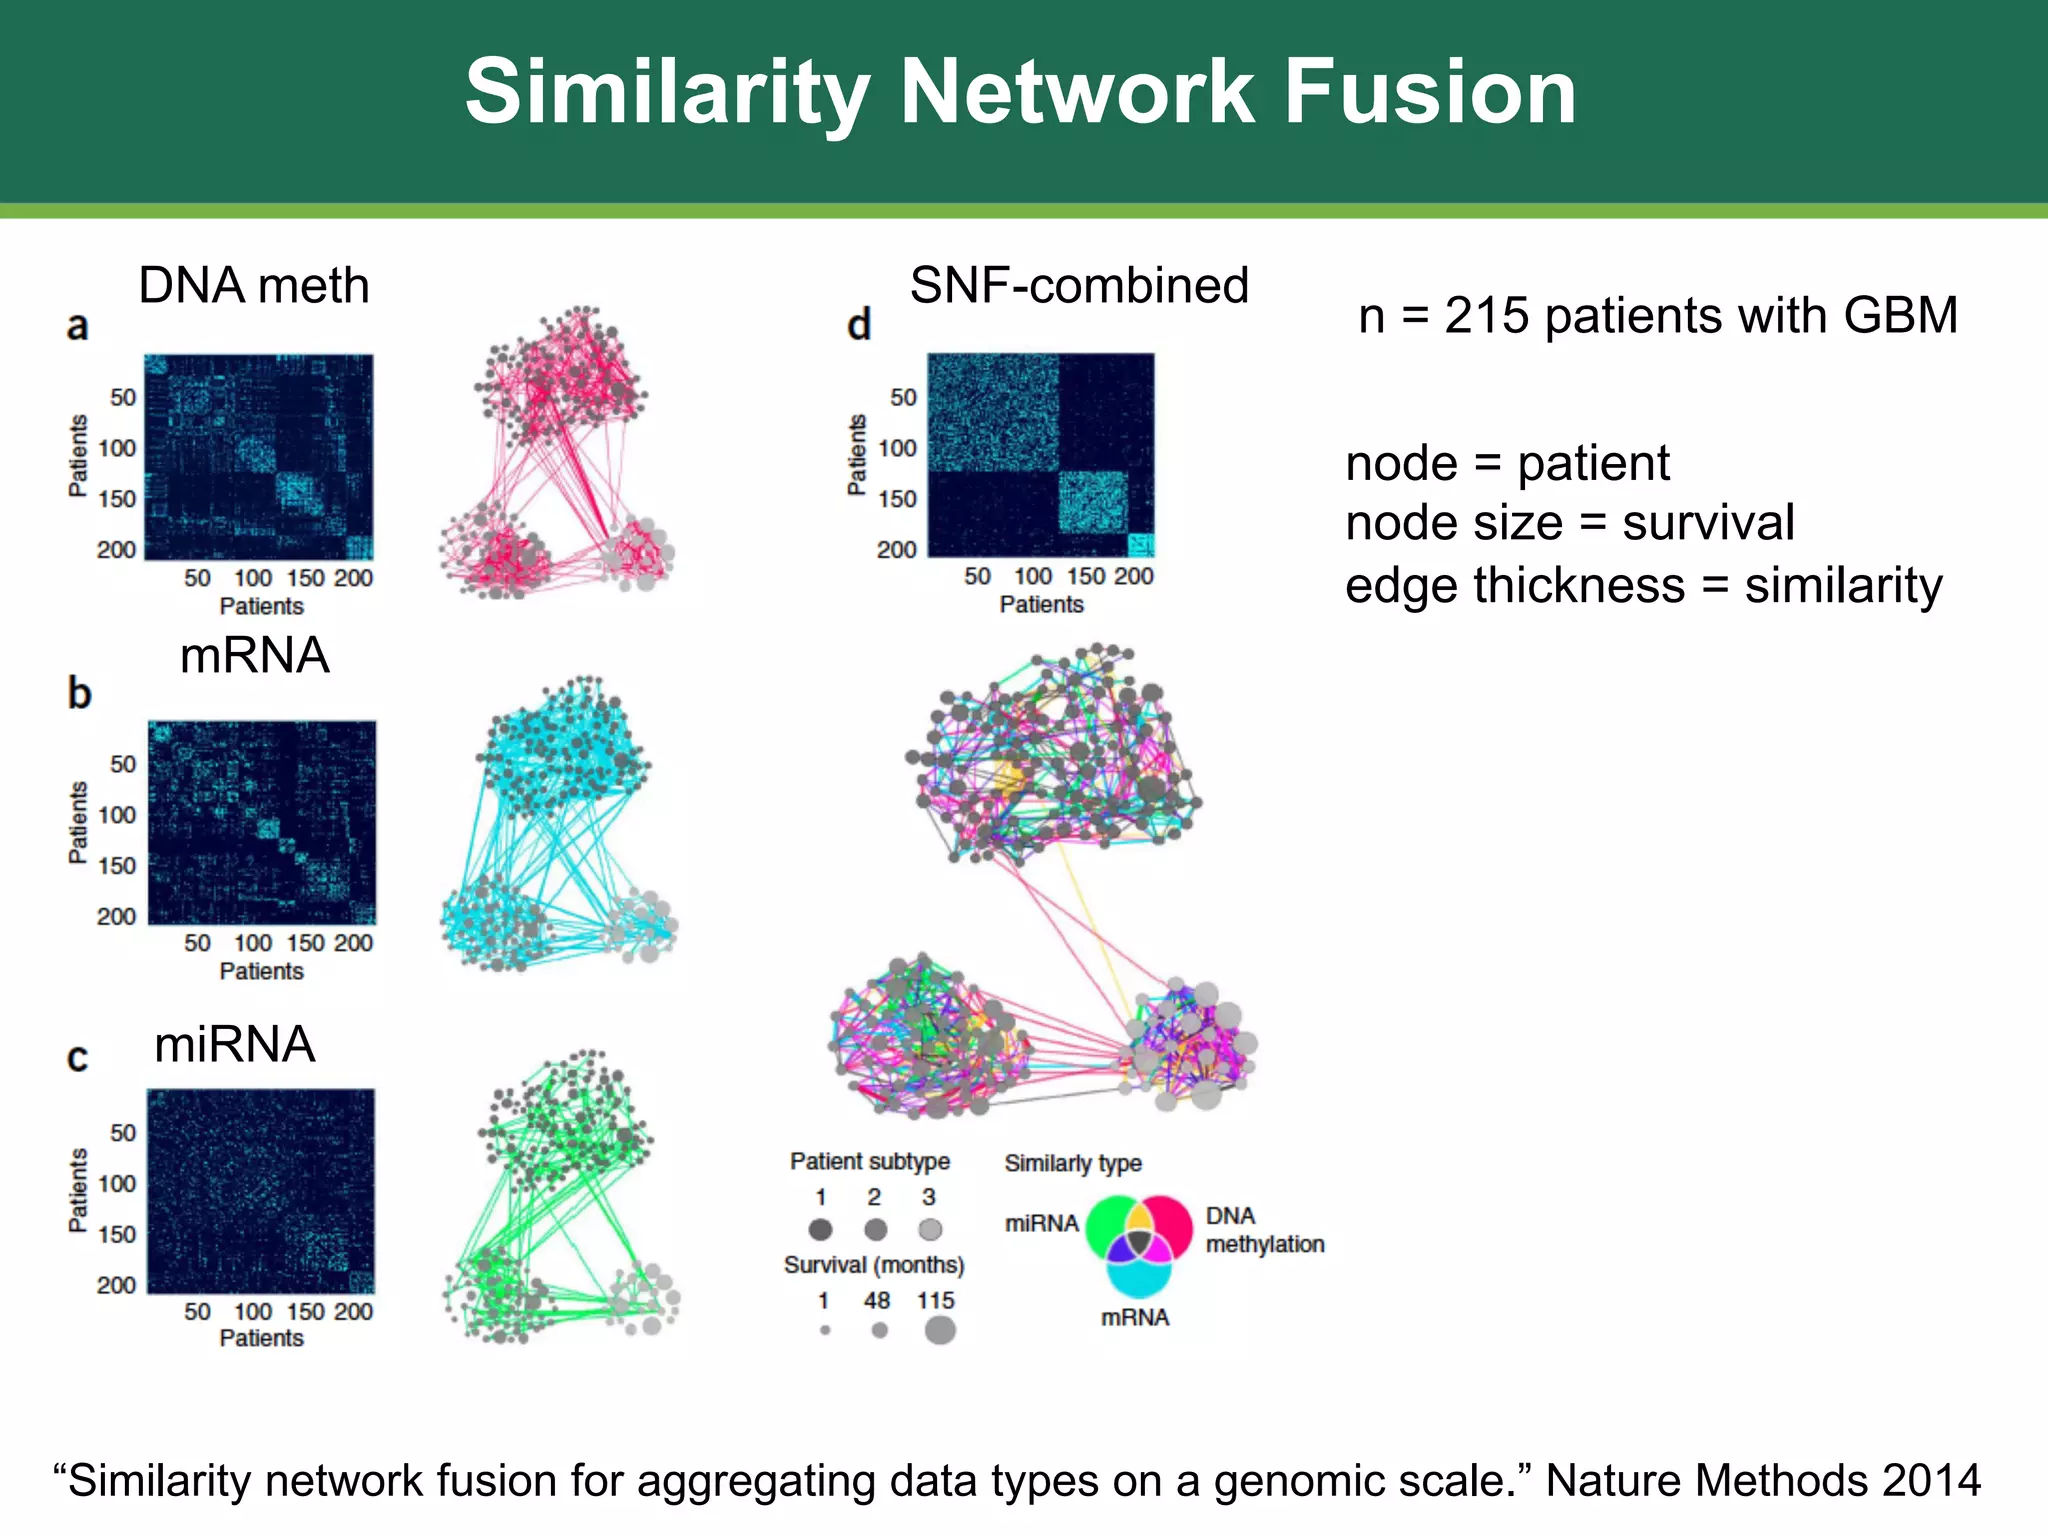
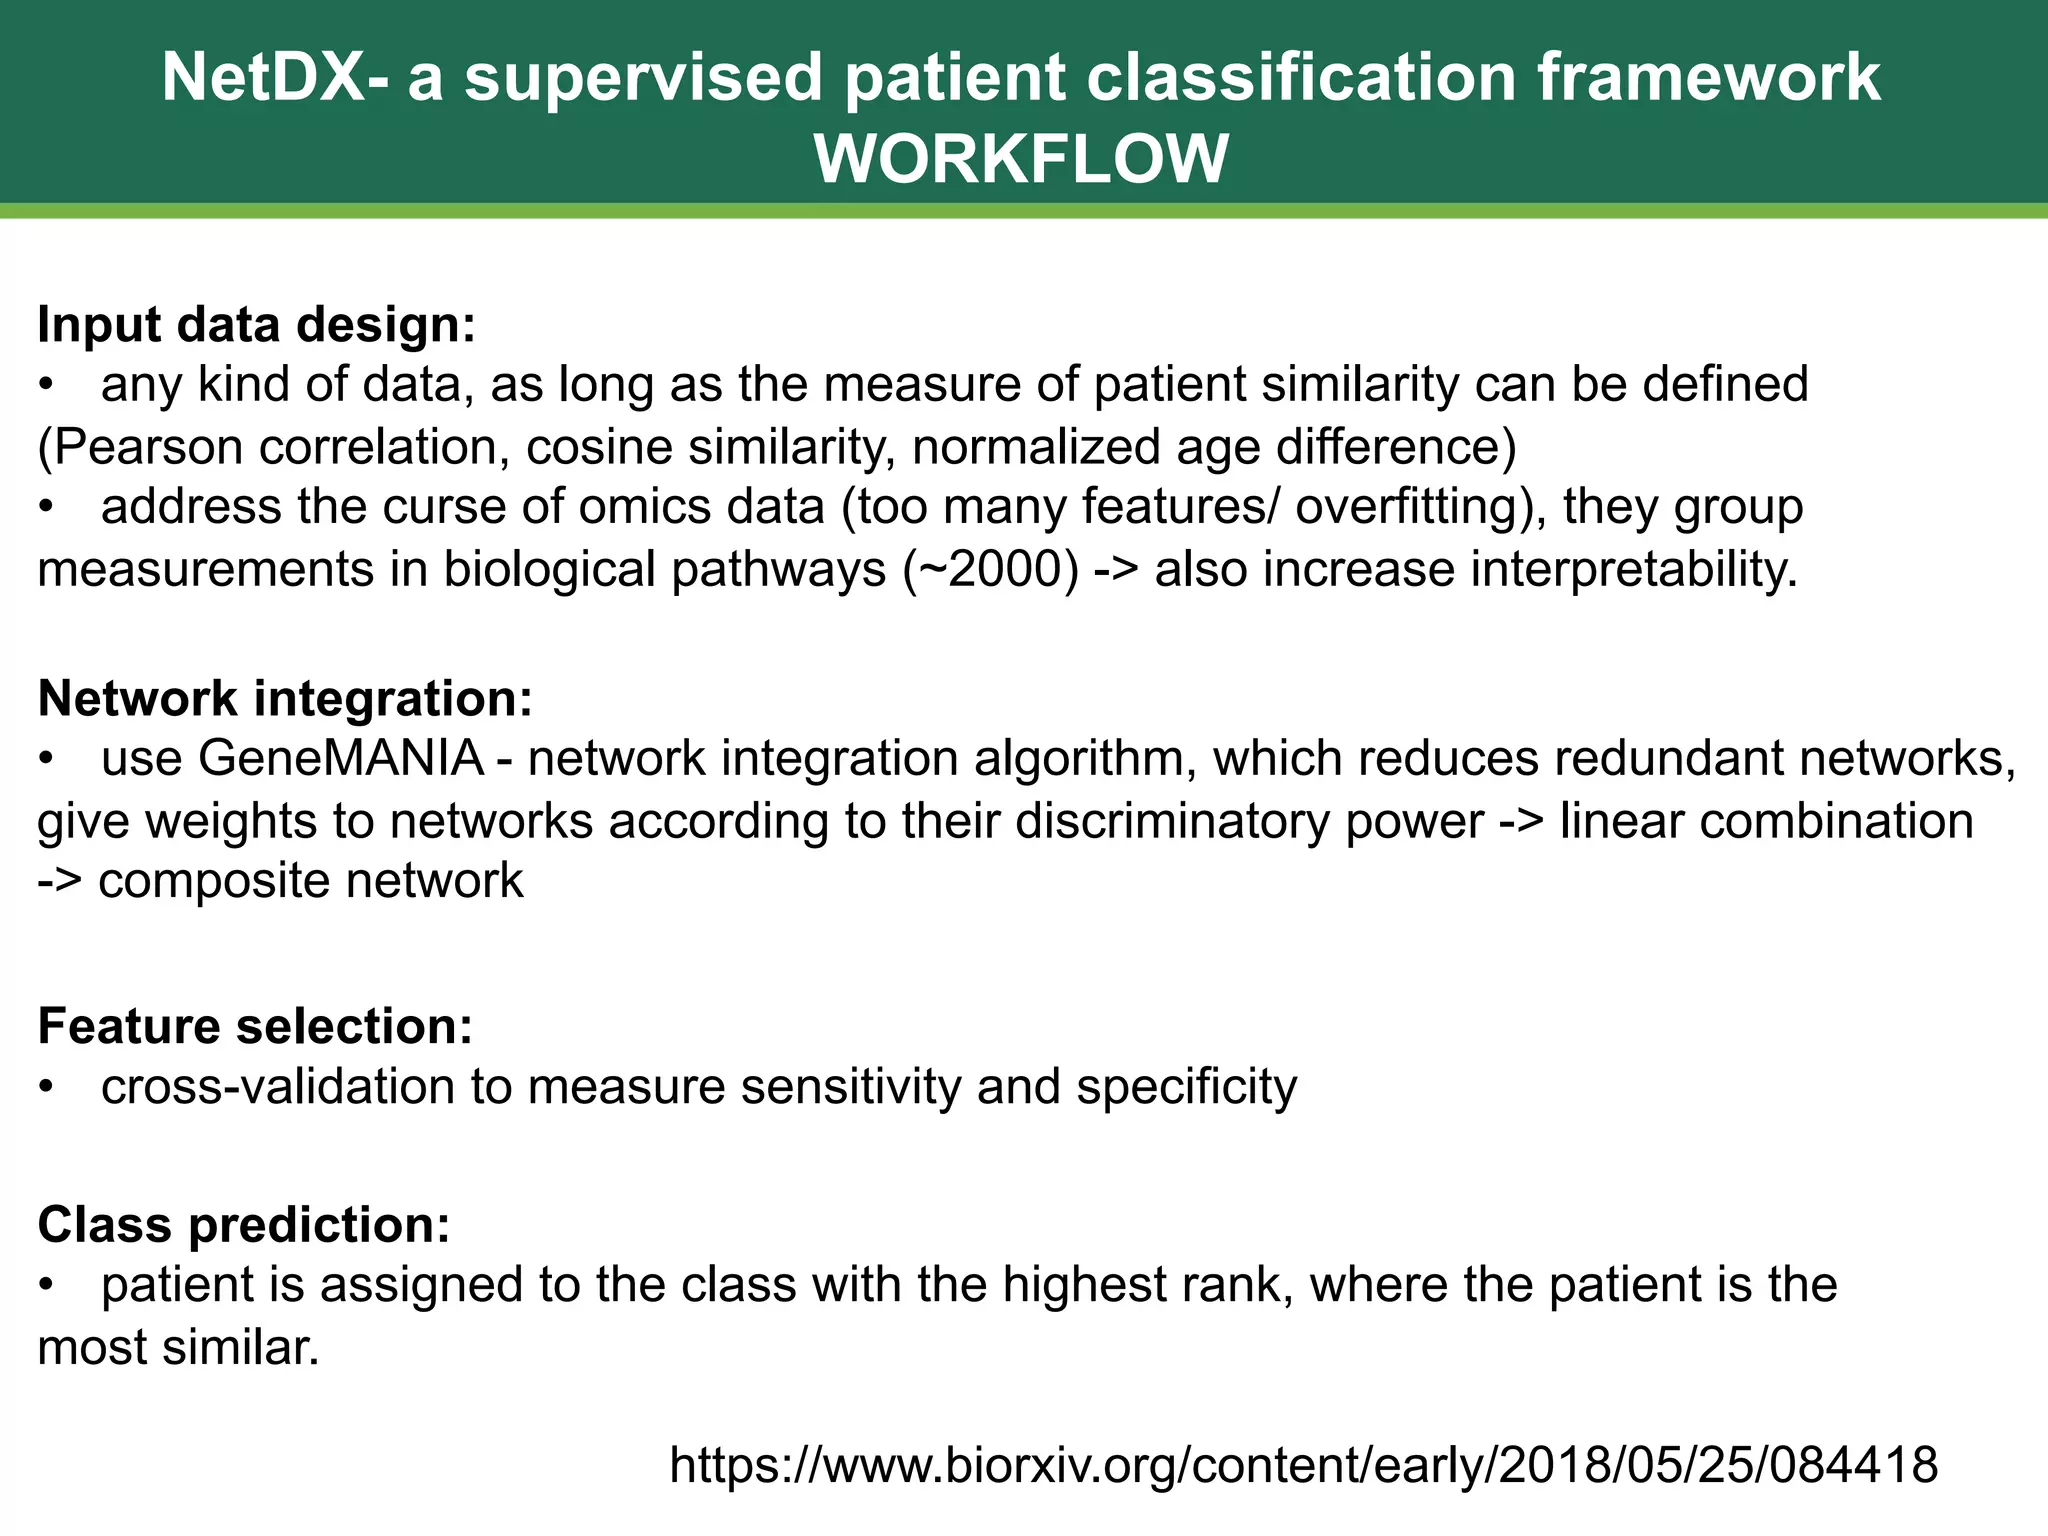
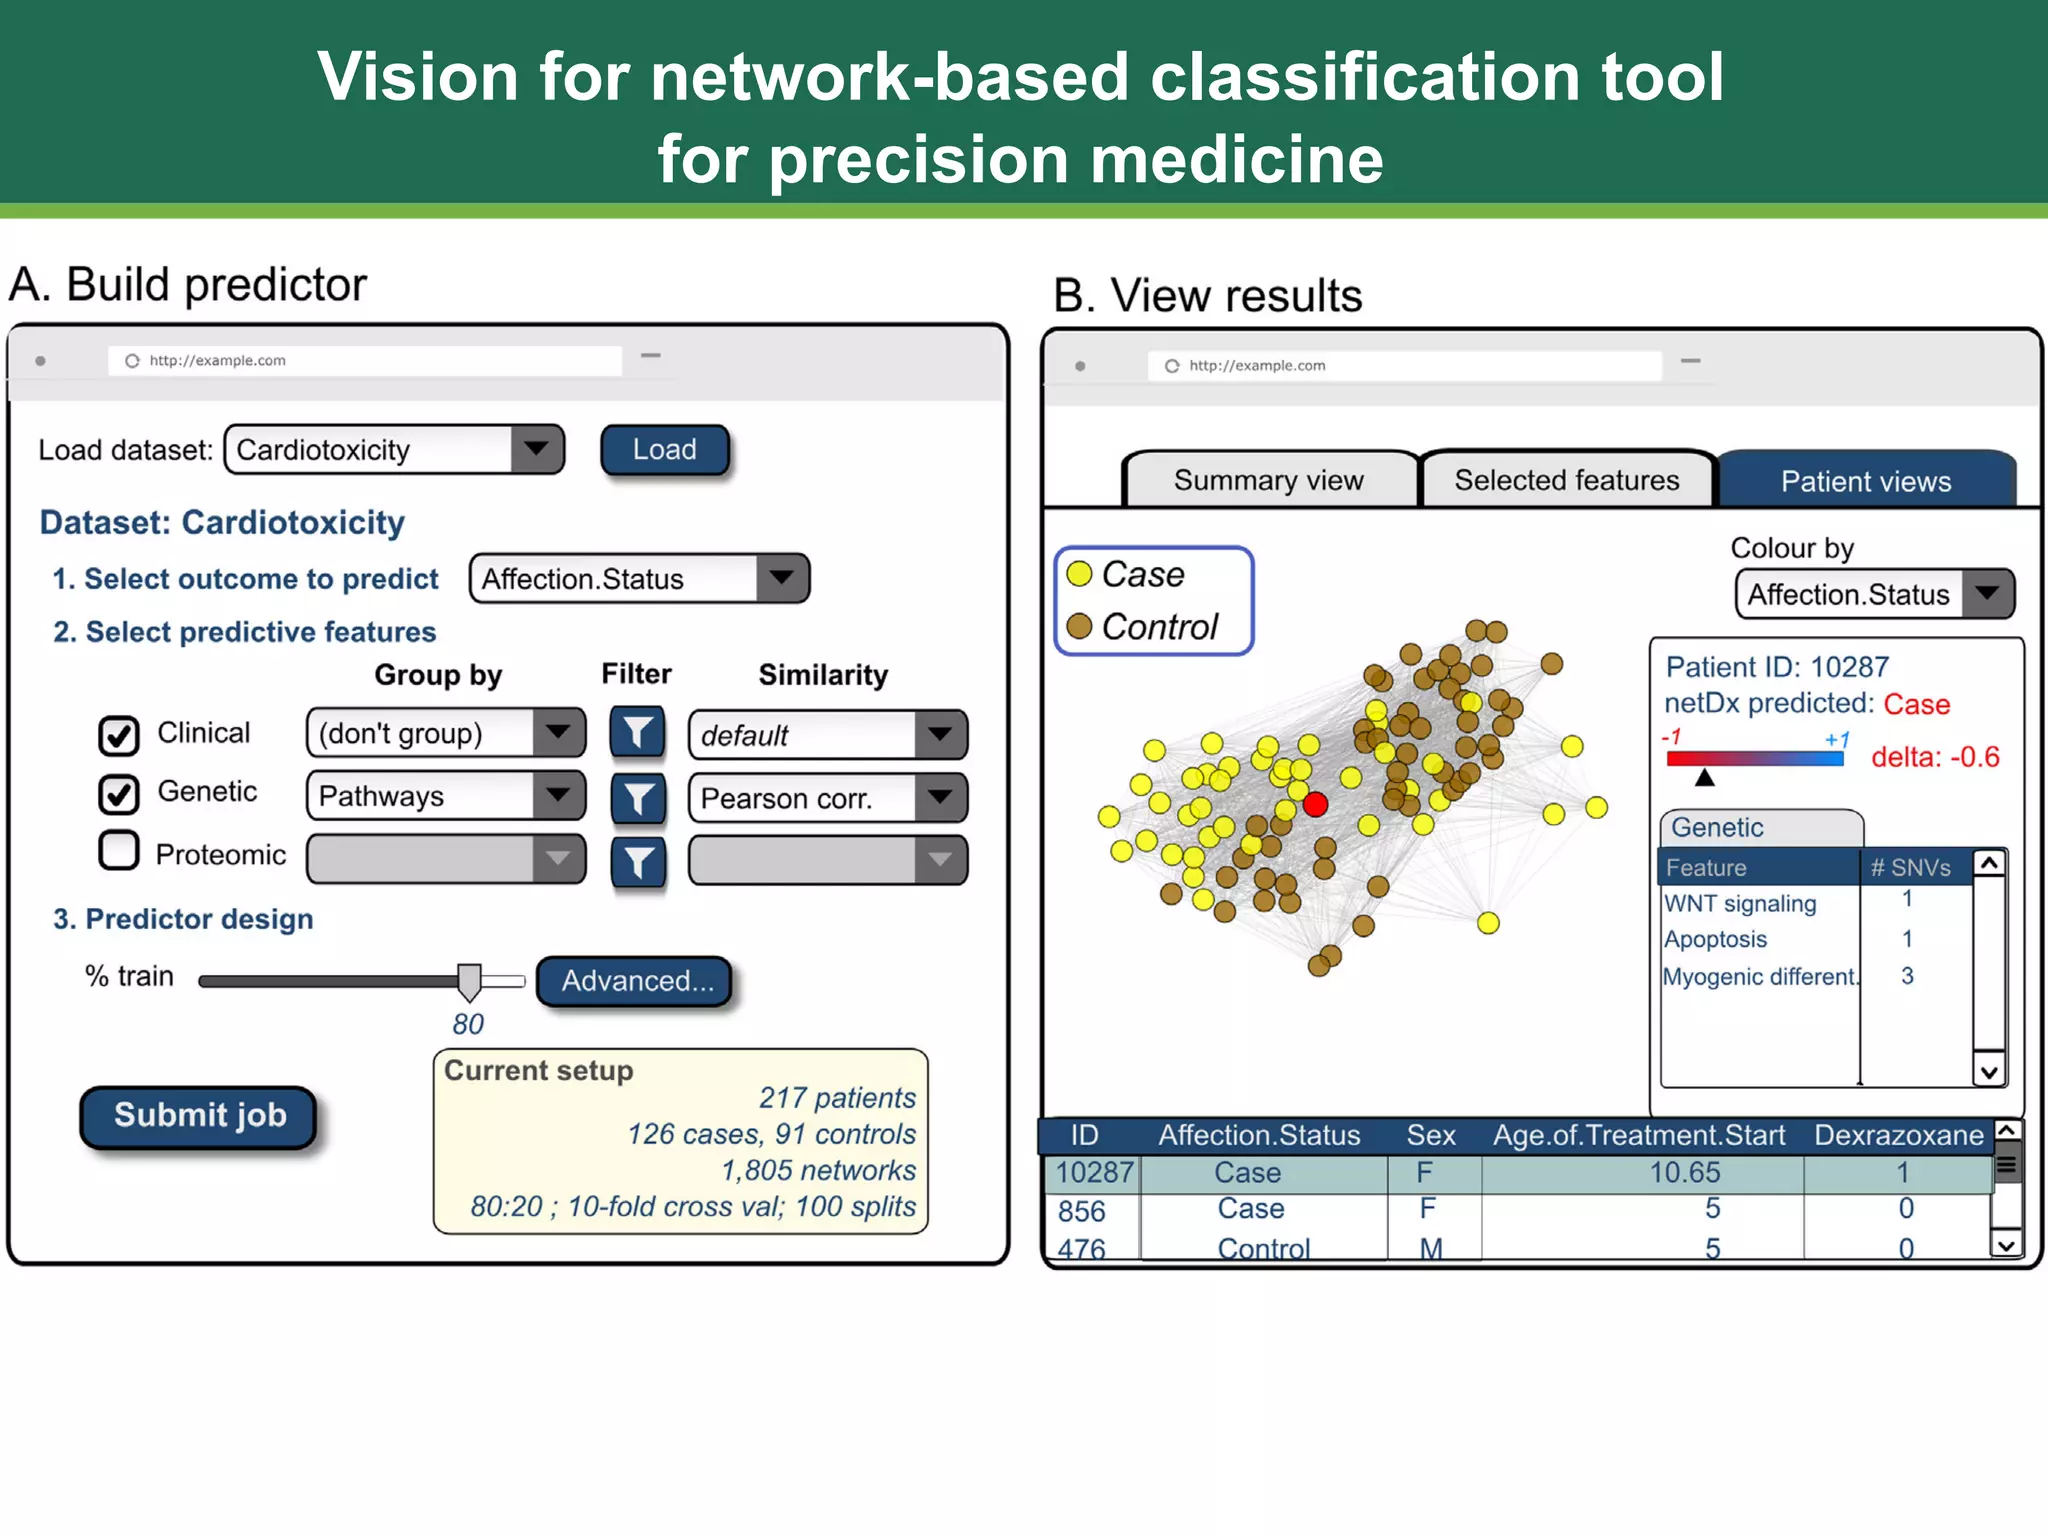
Branch: An interactive, web-based tool for building decision tree classifiersBenjamin Good
A crucial task in modern biology is the prediction of complex phenotypes, such as breast cancer prognosis, from genome-wide measurements. Machine learning algorithms can sometimes infer predictive patterns, but there is rarely enough data to train and test them effectively and the patterns that they identify are often expressed in forms (e.g. support vector machines, neural networks, random forests composed of 10s of thousands of trees) that are highly difficult to understand. In addition, it is generally unclear how to include prior knowledge in the course of their construction.
Decision trees provide an intuitive visual form that can capture complex interactions between multiple variables. Effective methods exist for inferring decision trees automatically but it has been shown that these techniques can be improved upon via the manual interventions of experts. Here, we introduce Branch, a new Web-based tool for the interactive construction of decision trees from genomic datasets. Branch offers the ability to: (1) upload and share datasets intended for classification tasks (in progress), (2) construct decision trees by manually selecting features such as genes for a gene expression dataset, (3) collaboratively edit decision trees, (4) create feature functions that aggregate content from multiple independent features into single decision nodes (e.g. pathways) and (5) evaluate decision tree classifiers in terms of precision and recall. The tool is optimized for genomic use cases through the inclusion of gene and pathway-based search functions.
Branch enables expert biologists to easily engage directly with high-throughput datasets without the need for a team of bioinformaticians. The tree building process allows researchers to rapidly test hypotheses about interactions between biological variables and phenotypes in ways that would otherwise require extensive computational sophistication. In so doing, this tool can both inform biological research and help to produce more accurate, more meaningful classifiers.
A prototype of Branch is available at http://biobranch.org/
A Tenyu et al, ChainRank, a chain prioritisation method for contextualisation of biological networks, BMC Bioinformatics 2016 17:17, DOI: 10.1186/s12859-015-0864-x
Deep learning based multi-omics integration, a surveySOYEON KIM
1. Unsupervised feature construction and knowledge extraction from genome-wide assays of breast cancer with denoising autoencoders, Pacific Symposium on Biocomputing, 2015
2. A deep learning approach for cancer detection and relevant gene identification, Pacific Symposium on Biocomputing, 2016
3. Deep Learning based multi-omics integrationrobustly predicts survival in liver cancer, preprint, 2017
A survey of heterogeneous information network analysisSOYEON KIM
A Survey of Heterogeneous Information Network Analysis
Chuan Shi, Member, IEEE,
Yitong Li, Jiawei Zhang, Yizhou Sun, Member, IEEE,
and Philip S. Yu, Fellow, IEEE
IEEE TRANSACTIONS ON KNOWLEDGE AND DATA ENGINEERING, 2015
Robust Pathway-based Multi-Omics Data Integration using Directed Random Walk ...SOYEON KIM
17th Annual International Conference on Critical Assessment of Massive Data Analysis (CAMDA 2018)
Cancer Data Integration Challenge (http://camda.info/)
Dr. Dennis Wang discusses possible ways to enable ML methods to be more powerful for discovery and to reduce ambiguity within translational medicine, allowing data-informed decision-making to deliver the next generation of diagnostics and therapeutics to patients quicker, at lowered costs, and at scale.
The talk by Dr. Dennis Wang was followed by a panel discussion with Mr. Albert Wang, M. Eng., Head, IT Business Partner, Translational Research & Technologies, Bristol-Myers Squibb.
This presentation focuses on the networking requirements using open source to treat diseases through cell-based analysis at the molecular level. Transporting this knowledge across devices and centers requires a whole new structure and networking. Terabits per second with high-availability and guaranteed delivery is required to meet the needs. Shared knowledge is the critical for real-time analysis. This will discuss data flows, open networking, and databases that are all open source and have been optimized for this problem.
Technology R&D Theme 2: From Descriptive to Predictive NetworksAlexander Pico
National Resource for Networks Biology's TR&D Theme 2: Genomics is mapping complex data about human biology and promises major medical advances. However, the routine use of genomics data in medical research is in its infancy, due mainly to the challenges of working with highly complex “big data”. In this theme, we will use network information to help organize, analyze and integrate these data into models that can be used to make clinically relevant diagnoses and predictions about an individual.
The goal of this project is to find the best tool for predicting the life expectancy of people with Hepatitis B. Different Machine Learning methods have been completely studied and various Machine Learning methods have been carried out by different experimenters. Hepatitis B is a worldwide disease with a high mortality rate. Different methods have been used by different researchers to predict the life expectancy of Hepatitis B patients. The Machine Learning models and algorithms such as the Classification model, Logistic Regression model, Recursive Feature Elimination Algorithm, Cirrhosis Mortality model, Extreme Gradient Boosting, Random Forest, Decision Tree have been utilized by different researchers to predict the life expectancy of Hepatitis B patients. Some algorithms and models showed very interesting and proving results whereas some were not that good. Area Under Curve analysis was used to assess the estimation of various models. The AUROC value of the PSO model was minimal, while the ADT model had the highest accuracy. XGBoost showed appropriate predictive performance. All other models showed good calibration.
Jessica Rudd, PhD Student, Analytics and Data Science, Kennesaw State Univers...MLconf
Application of Support Vector Machine Modeling and Graph Theory Metrics for Disease Classification:
Disease classification is a crucial element of biomedical research. Recent studies have demonstrated that machine learning techniques, such as Support Vector Machine (SVM) modeling, produce similar or improved predictive capabilities in comparison to the traditional method of Logistic Regression. In addition, it has been found that social network metrics can provide useful predictive information for disease modeling. In this study, we combine simulated social network metrics with SVM to predict diabetes in a sample of data from the Behavioral Risk Factor Surveillance System. In this dataset, Logistic Regression outperformed SVM with ROC index of 81.8 and 81.7 for models with and without graph metrics, respectively. SVM with a polynomial kernel had ROC index of 72.9 and 75.6 for models with and without graph metrics, respectively. Although this did not perform as well as Logistic Regression, the results are consistent with previous studies utilizing SVM to classify diabetes.
Using KnetMiner to search and visualise the knowledge network of genes involved in neurodegenerative diseases such as Alzheimer, Parkinson and Huntington.
Forum on Personalized Medicine: Challenges for the next decadeJoaquin Dopazo
Bioinformatics and Big Data in the era of Personalized Medicine
10th Anniversary Instituto Roche Forum on Personalized Medicine: Challenges for the next decade.
Santiago de Compostela (Spain), September 25th 2014
Prognosis of Cardiac Disease using Data Mining Techniques A Comprehensive Surveyijtsrd
The Healthcare exchange generally clinical diagnosis is ended commonly by doctor's knowledge and practice. Computer Aided Decision Support System plays a major task in the medical field. Data mining provides the methodology and technology to modify these rises of data into valuable data for decision making. By utilizing data mining techniques it requires less time for the prediction of the diseases with more accuracy. Among the expanding research on coronary diseases predicting system, it has happened significant to classifications the exploration results and gives readers with a layout of the current coronary diseases forecast strategies in every discussion. Data mining tools can respond to exchange addresses that expectedly being used much time over riding to decide. In this paper we study different papers in which at least one algorithm of data mining used for the prediction of coronary diseases. As of the study it is observed that Naïve Bayes Technique increase the accuracy of the coronary diseases prediction system. The commonly used techniques for Heart Disease Prediction and their complexities are outlined in this paper. D. Haripriya | Dr. M. Lovelin Ponn Felciah "Prognosis of Cardiac Disease using Data Mining Techniques: A Comprehensive Survey" Published in International Journal of Trend in Scientific Research and Development (ijtsrd), ISSN: 2456-6470, Volume-3 | Issue-5 , August 2019, URL: https://www.ijtsrd.com/papers/ijtsrd26605.pdfPaper URL: https://www.ijtsrd.com/computer-science/data-miining/26605/prognosis-of-cardiac-disease-using-data-mining-techniques-a-comprehensive-survey/d-haripriya
The Uneven Future of Evidence-Based MedicineIda Sim
An Apple ResearchKit study enrolled 22,000 people in five days. A
study claims that Twitter can be used to identify depressed patients. A computer program crunches genomic data, the published literature, and electronic health record data to guide cancer treatment. The pace, the data sources, and the methods for generating medical evidence are changing radically. What will — what should — evidence-based medicine look like in a faster, personalized, data-dense tomorrow?
- Presented as the 3rd Annual Cochrane Lecture, October 2015 in Vienna, Austria.
Network embedding in biomedical data scienceArindam Ghosh
Excerpts from the paper:
What is it?
Network embedding aims at converting the network into a low-dimensional space while structural information of the network is preserved.
In this way, nodes and/or edges of the network can be represented as compacted yet informative vectors in the embedding space.
Advantages:
Typical non-network-based machine learning methods such as linear regression, Support Vector Machine (SVM) and decision forest, which have been demonstrated to be effective and efficient as the state-of-the-art techniques, can be applied to such vectors.
Current status:
Efforts of applying network embedding to improve biomedical data analysis are already planned or underway.
Difficulties:
The biomedical networks are sparse, noisy, incomplete, heterogeneous and usually consist of biomedical text and other domain knowledge. It makes embedding tasks more complicated than other application fields.
Summary: ENViz performs enrichment analysis for pathways and gene ontology (GO) terms in matched datasets of multiple data types (e.g. gene expression and metabolites or miRNA), then visualizes results as a Cytoscape network that can be navigated to show data overlaid on pathways and GO DAGs.
Background: Modern genomic, metabolomics, and proteomic assays produce multiplexed measurements that characterize molecular composition and biological activity from complimentary angles. Integrative analysis of such measurements remains a challenge to life science and biomedical researchers. We present an enrichment network approach to jointly analyzing two types of sample matched datasets and systematic annotations, implemented as a plugin to the Cytoscape [1] network biology software platform.
Approach: ENViz analyses a primary dataset (e.g. gene expression) with respect to a ‘pivot’ dataset (e.g. miRNA expression, metabolomics or proteomics measurements) and primary data annotation (e.g. pathway or GO). For each pivot entity, we rank elements of the primary data based on the correlation to the pivot across all samples, and compute statistical enrichment of annotation sets in the top of this ranked list based on minimum hypergeometric statistics [2]. Significant results are represented as an enrichment network - a bipartite graph with nodes corresponding to pivot and annotation entities, and edges corresponding to pivot-annotation pairs with statistical enrichmentscores above the user defined threshold. Correlations of primary data and pivot data are visually overlaid on biological pathways for significant pivot-annotation pairs using the WikiPathways resource [3], and on gene ontology terms. Edges of the enrichment network may point to functionally relevant mechanisms. In [4], a significant association between miR-19a and the cell-cycle module was substantiated as an association to proliferation, validated using a high-throughput transfection assay. The figures below show a pathway enrichment network, with pathway nodes green and miRNAs gray (left), network view of the edge between Inflammatory Response Pathway and mir-337-5p (center), and GO enrichment network with red areas indicating high enrichment for immune response and metabolic processes (right).
Early detection of cancer is very important to cure cancers because when the tumor burden is small and localized, they can be surgically removed. This paper describes a new strategy for early cancer detection, aiming at screening multiple different cancers within the general population using blood based test, both the protein component as well as the circulating DNA.
Presented a fantastic cutting-edge paper about using deep learning approach to learn from EHR (electronic health record) data in a clinical informatics journal club at UAB, October 2018.
League of Legends (LoL) is one of the most popular online video games developed by Riot Games in 2009. Since its release, LoL quickly gained popularity and became the most played game in North America and Europe in 2012 by total hours of play. LoL is a 3D multiplayer online battle arena game, with 3 different battlegrounds (also known as Field of Justice), namely the Summoner’s Rift, the Twisted Treeline, and the Howling Abyss. For most players, the Summoner’s Rift is the most common choice of field to play.
In LOL, each player can summon a champion with a set of unique abilities to fight against another team of players, or in other circumstances, computer-generated champions. The objective to win the game is to destroy the other team’s Nexus, which is located at the heart of each team’s base and protected by defensive structures called turrets. Periodically, Nexus creates weak computer-generated characters called minions, who match towards the opponent’s base to attack their structures.
In this project, we sought out to analyze the LOL dataset to gain more insights into (1) players' performance, (2) champions performance. We also investigated certain aspects of the game such as (3) minion killing, (4) buff duration and (5) ward positions to see if they affect winning.
I presented a Science paper about how gut microbiome composition may affect response to immunotherapy in an Immunology Journal Club at UAB on November 15th, 2017.
Earliest Galaxies in the JADES Origins Field: Luminosity Function and Cosmic ...Sérgio Sacani
We characterize the earliest galaxy population in the JADES Origins Field (JOF), the deepest
imaging field observed with JWST. We make use of the ancillary Hubble optical images (5 filters
spanning 0.4−0.9µm) and novel JWST images with 14 filters spanning 0.8−5µm, including 7 mediumband filters, and reaching total exposure times of up to 46 hours per filter. We combine all our data
at > 2.3µm to construct an ultradeep image, reaching as deep as ≈ 31.4 AB mag in the stack and
30.3-31.0 AB mag (5σ, r = 0.1” circular aperture) in individual filters. We measure photometric
redshifts and use robust selection criteria to identify a sample of eight galaxy candidates at redshifts
z = 11.5 − 15. These objects show compact half-light radii of R1/2 ∼ 50 − 200pc, stellar masses of
M⋆ ∼ 107−108M⊙, and star-formation rates of SFR ∼ 0.1−1 M⊙ yr−1
. Our search finds no candidates
at 15 < z < 20, placing upper limits at these redshifts. We develop a forward modeling approach to
infer the properties of the evolving luminosity function without binning in redshift or luminosity that
marginalizes over the photometric redshift uncertainty of our candidate galaxies and incorporates the
impact of non-detections. We find a z = 12 luminosity function in good agreement with prior results,
and that the luminosity function normalization and UV luminosity density decline by a factor of ∼ 2.5
from z = 12 to z = 14. We discuss the possible implications of our results in the context of theoretical
models for evolution of the dark matter halo mass function.
(May 29th, 2024) Advancements in Intravital Microscopy- Insights for Preclini...Scintica Instrumentation
Intravital microscopy (IVM) is a powerful tool utilized to study cellular behavior over time and space in vivo. Much of our understanding of cell biology has been accomplished using various in vitro and ex vivo methods; however, these studies do not necessarily reflect the natural dynamics of biological processes. Unlike traditional cell culture or fixed tissue imaging, IVM allows for the ultra-fast high-resolution imaging of cellular processes over time and space and were studied in its natural environment. Real-time visualization of biological processes in the context of an intact organism helps maintain physiological relevance and provide insights into the progression of disease, response to treatments or developmental processes.
In this webinar we give an overview of advanced applications of the IVM system in preclinical research. IVIM technology is a provider of all-in-one intravital microscopy systems and solutions optimized for in vivo imaging of live animal models at sub-micron resolution. The system’s unique features and user-friendly software enables researchers to probe fast dynamic biological processes such as immune cell tracking, cell-cell interaction as well as vascularization and tumor metastasis with exceptional detail. This webinar will also give an overview of IVM being utilized in drug development, offering a view into the intricate interaction between drugs/nanoparticles and tissues in vivo and allows for the evaluation of therapeutic intervention in a variety of tissues and organs. This interdisciplinary collaboration continues to drive the advancements of novel therapeutic strategies.
Nutraceutical market, scope and growth: Herbal drug technologyLokesh Patil
As consumer awareness of health and wellness rises, the nutraceutical market—which includes goods like functional meals, drinks, and dietary supplements that provide health advantages beyond basic nutrition—is growing significantly. As healthcare expenses rise, the population ages, and people want natural and preventative health solutions more and more, this industry is increasing quickly. Further driving market expansion are product formulation innovations and the use of cutting-edge technology for customized nutrition. With its worldwide reach, the nutraceutical industry is expected to keep growing and provide significant chances for research and investment in a number of categories, including vitamins, minerals, probiotics, and herbal supplements.
Deep Behavioral Phenotyping in Systems Neuroscience for Functional Atlasing a...Ana Luísa Pinho
Functional Magnetic Resonance Imaging (fMRI) provides means to characterize brain activations in response to behavior. However, cognitive neuroscience has been limited to group-level effects referring to the performance of specific tasks. To obtain the functional profile of elementary cognitive mechanisms, the combination of brain responses to many tasks is required. Yet, to date, both structural atlases and parcellation-based activations do not fully account for cognitive function and still present several limitations. Further, they do not adapt overall to individual characteristics. In this talk, I will give an account of deep-behavioral phenotyping strategies, namely data-driven methods in large task-fMRI datasets, to optimize functional brain-data collection and improve inference of effects-of-interest related to mental processes. Key to this approach is the employment of fast multi-functional paradigms rich on features that can be well parametrized and, consequently, facilitate the creation of psycho-physiological constructs to be modelled with imaging data. Particular emphasis will be given to music stimuli when studying high-order cognitive mechanisms, due to their ecological nature and quality to enable complex behavior compounded by discrete entities. I will also discuss how deep-behavioral phenotyping and individualized models applied to neuroimaging data can better account for the subject-specific organization of domain-general cognitive systems in the human brain. Finally, the accumulation of functional brain signatures brings the possibility to clarify relationships among tasks and create a univocal link between brain systems and mental functions through: (1) the development of ontologies proposing an organization of cognitive processes; and (2) brain-network taxonomies describing functional specialization. To this end, tools to improve commensurability in cognitive science are necessary, such as public repositories, ontology-based platforms and automated meta-analysis tools. I will thus discuss some brain-atlasing resources currently under development, and their applicability in cognitive as well as clinical neuroscience.
Comparing Evolved Extractive Text Summary Scores of Bidirectional Encoder Rep...University of Maribor
Slides from:
11th International Conference on Electrical, Electronics and Computer Engineering (IcETRAN), Niš, 3-6 June 2024
Track: Artificial Intelligence
https://www.etran.rs/2024/en/home-english/
A brief information about the SCOP protein database used in bioinformatics.
The Structural Classification of Proteins (SCOP) database is a comprehensive and authoritative resource for the structural and evolutionary relationships of proteins. It provides a detailed and curated classification of protein structures, grouping them into families, superfamilies, and folds based on their structural and sequence similarities.
Richard's aventures in two entangled wonderlandsRichard Gill
Since the loophole-free Bell experiments of 2020 and the Nobel prizes in physics of 2022, critics of Bell's work have retreated to the fortress of super-determinism. Now, super-determinism is a derogatory word - it just means "determinism". Palmer, Hance and Hossenfelder argue that quantum mechanics and determinism are not incompatible, using a sophisticated mathematical construction based on a subtle thinning of allowed states and measurements in quantum mechanics, such that what is left appears to make Bell's argument fail, without altering the empirical predictions of quantum mechanics. I think however that it is a smoke screen, and the slogan "lost in math" comes to my mind. I will discuss some other recent disproofs of Bell's theorem using the language of causality based on causal graphs. Causal thinking is also central to law and justice. I will mention surprising connections to my work on serial killer nurse cases, in particular the Dutch case of Lucia de Berk and the current UK case of Lucy Letby.
Multi-source connectivity as the driver of solar wind variability in the heli...Sérgio Sacani
The ambient solar wind that flls the heliosphere originates from multiple
sources in the solar corona and is highly structured. It is often described
as high-speed, relatively homogeneous, plasma streams from coronal
holes and slow-speed, highly variable, streams whose source regions are
under debate. A key goal of ESA/NASA’s Solar Orbiter mission is to identify
solar wind sources and understand what drives the complexity seen in the
heliosphere. By combining magnetic feld modelling and spectroscopic
techniques with high-resolution observations and measurements, we show
that the solar wind variability detected in situ by Solar Orbiter in March
2022 is driven by spatio-temporal changes in the magnetic connectivity to
multiple sources in the solar atmosphere. The magnetic feld footpoints
connected to the spacecraft moved from the boundaries of a coronal hole
to one active region (12961) and then across to another region (12957). This
is refected in the in situ measurements, which show the transition from fast
to highly Alfvénic then to slow solar wind that is disrupted by the arrival of
a coronal mass ejection. Our results describe solar wind variability at 0.5 au
but are applicable to near-Earth observatories.
Cancer cell metabolism: special Reference to Lactate PathwayAADYARAJPANDEY1
Normal Cell Metabolism:
Cellular respiration describes the series of steps that cells use to break down sugar and other chemicals to get the energy we need to function.
Energy is stored in the bonds of glucose and when glucose is broken down, much of that energy is released.
Cell utilize energy in the form of ATP.
The first step of respiration is called glycolysis. In a series of steps, glycolysis breaks glucose into two smaller molecules - a chemical called pyruvate. A small amount of ATP is formed during this process.
Most healthy cells continue the breakdown in a second process, called the Kreb's cycle. The Kreb's cycle allows cells to “burn” the pyruvates made in glycolysis to get more ATP.
The last step in the breakdown of glucose is called oxidative phosphorylation (Ox-Phos).
It takes place in specialized cell structures called mitochondria. This process produces a large amount of ATP. Importantly, cells need oxygen to complete oxidative phosphorylation.
If a cell completes only glycolysis, only 2 molecules of ATP are made per glucose. However, if the cell completes the entire respiration process (glycolysis - Kreb's - oxidative phosphorylation), about 36 molecules of ATP are created, giving it much more energy to use.
IN CANCER CELL:
Unlike healthy cells that "burn" the entire molecule of sugar to capture a large amount of energy as ATP, cancer cells are wasteful.
Cancer cells only partially break down sugar molecules. They overuse the first step of respiration, glycolysis. They frequently do not complete the second step, oxidative phosphorylation.
This results in only 2 molecules of ATP per each glucose molecule instead of the 36 or so ATPs healthy cells gain. As a result, cancer cells need to use a lot more sugar molecules to get enough energy to survive.
introduction to WARBERG PHENOMENA:
WARBURG EFFECT Usually, cancer cells are highly glycolytic (glucose addiction) and take up more glucose than do normal cells from outside.
Otto Heinrich Warburg (; 8 October 1883 – 1 August 1970) In 1931 was awarded the Nobel Prize in Physiology for his "discovery of the nature and mode of action of the respiratory enzyme.
WARNBURG EFFECT : cancer cells under aerobic (well-oxygenated) conditions to metabolize glucose to lactate (aerobic glycolysis) is known as the Warburg effect. Warburg made the observation that tumor slices consume glucose and secrete lactate at a higher rate than normal tissues.
Cancer cell metabolism: special Reference to Lactate Pathway
PSN for Precision Medicine
1. Patient Similarity Networks for Precision Medicine
Thi Nguyen, Ph.D. Candidate
Graduate Biomedical Sciences | Immunology Theme
University of Alabama at Birmingham (UAB)
kimthi@uab.edu
Clinical Informatics Journal Club
October 233d, 2018
2. Outline
• Current landscape in building a predictive risk model
• Patient similarity network (PSN) – emerging paradigm for clinical prediction
• Advantages of PSN
• Examples of 2 PSN: Similarity network Fusion and netDx
• Challenges of PSN analytics
• Vision for PSN-based tool for future clinic
3. Disease risk calculator
http://www.cvriskcalculator.com/
• ASCVD calculator = 10-year risk of heart disease/stroke
• 13 pieces of information: gender, age, blood lipid levels,
blood pressure, history.
• result of 50 years development/ refinement
• continue to adjust
Risk calculator = set of risk factors -> calculate disease risks to help monitoring,
diagnosis and treatment.
4. Fig. 1. Developing risk calculators
Ideal model:
• accurate
• generalizable
• reasonable time
• interpretable by clinicians
7. predictive risk models – current needs
• Integrate diverse data types (genomics, metabolomics, imaging, EHR ...)
• Interpretable
• Handle sparse/ missing data
• Maintain patient private information
• Scale up : keep pace with the scale and complexity of the data
8. Network science
• New scientific discipline, broadly interdisciplinary approach
to study complex systems
• Developed its formalism from graph theory and uses statistical
physics as conceptual framework.
• Key concept: Regardless of the domain knowledges (computer,
social, biological), all networks are driven by the same fundamental
organizing principles.
• Common set of mathematical tools to explore these systems.
http://networksciencebook.com/
by A.-L. Barabási.
9. Why network science for new predictive risk models?
• Handle heterogeneous data
• missing data is naturally handled
• easy visualization : when presented as network, grouping/ decision boundary
can be visualized
• Intuitive: Analogous to clinical diagnosis: Physicians relates a patient’s case to
previous patients they have seen : mental database
• PSN doesn’t use direct patient data -> patients privacy -> easier to scale up
• Many existing methods in network sciences allowing to integrate data = fuse
networks.
• NetDX : make use of biological pathway –based feature to improve accuracy
and generalization + increase interpretability of genome data.
10. Patient similarity networks
• each node = individual
• edge = pairwise similarity for a given feature
• Labelled patients can be grouped (clustering/ unsupervised classification) and
patient with unknown status can be assigned to a group based on their
similarity to a particular group.
• each feature (=view) is represented as a network of pairwise patient similarities
• views can be integrated/fused to identify subgroups / predict outcome.
11. Similarity Network Fusion
“Similarity network fusion for aggregating data types on a genomic scale.” Nature Methods 2014
1. Construct similarity network for each data type
2. Fuse these networks into a single network using nonlinear combination method
• Data types: mRNA, DNA methylation and miRNA
• Single value decomposition -> cosine similarity -> fuse network by iterative boosting
• This method has been applied to subtype medulloblastoma + pancreatic ductal
adenocarcinoma tumors + subtypes of diabetes.
12. Similarity Network Fusion
“Similarity network fusion for aggregating data types on a genomic scale.” Nature Methods 2014
node = patient
node size = survival
edge thickness = similarity
mRNA
miRNA
DNA meth SNF-combined
n = 215 patients with GBM
13. NetDX- a supervised patient classification framework
WORKFLOW
https://www.biorxiv.org/content/early/2018/05/25/084418
14. NetDX- a supervised patient classification framework
WORKFLOW
https://www.biorxiv.org/content/early/2018/05/25/084418
Network integration:
• use GeneMANIA - network integration algorithm, which reduces redundant networks,
give weights to networks according to their discriminatory power -> linear combination
-> composite network
Input data design:
• any kind of data, as long as the measure of patient similarity can be defined
(Pearson correlation, cosine similarity, normalized age difference)
• address the curse of omics data (too many features/ overfitting), they group
measurements in biological pathways (~2000) -> also increase interpretability.
Feature selection:
• cross-validation to measure sensitivity and specificity
Class prediction:
• patient is assigned to the class with the highest rank, where the patient is the
most similar.
15. NetDX to predict ependymoma suptypes
• microarray data + clinical data
• Pearson correlation = similarity
• regression to correct batch effects
• Lasso regression in cross validation to
prefilter genes
pathway-based design:
• genes were group into 2118 networks , one per pathway
• pathway info were aggregated from HumanCyc, IOB’s NetPath, Reactome, NCI
curated pathways, mSigDB and Panther.
16. Challenges for PSN analytics
• large data sizes (thousands of genomes)
• improve feature selections
• improve signal-to-noise ratio automatically
• characterize patient heterogeneity (disease subtypes)
• make best use of complex genomics layers (tissue-specific
variants)
• tuning parameters
• build on prior knowledge/ data, e.g. known gene-gene
interaction, epigenetic information.
18. Conclusions
• Patient Similarity Network is an emerging method used to build predictive risk model
• Many advantages compared to other approaches: integrate heterogeneous data types,
tolerate missing data, maintaining patients privacy, and have good interpretability.
• Since it is a new paradigm, there are many challenges to implement
• Similarity network Fusion and NetDX are two frameworks that implemented PSN with
success
• Opportunities
19. Questions/ Thoughts/ Comments
• Can pairwise comparison capture all the complexity of gene expression in each
patient? Is it a valid question for PSN?
• To what extent should we reduce the dimensions to make sense of the data without
stripping it out of its important nuances?
• Does combining the networks (fusing them) smooth out/ preserve the heterogeneity
underlying the structure of each type of data?
• Does the PSN actually make the network/ grouping similar to the way a clinician
would do?
• Would there be data types that are not compatible to be integrated?