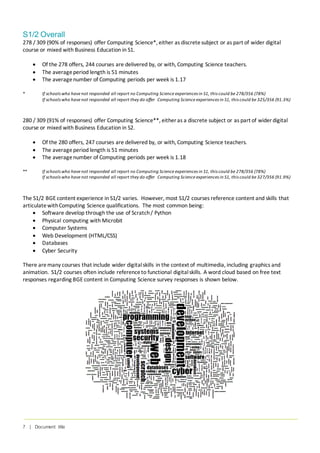
The document provides an overview of Computing Science provision in Scottish secondary schools based on a survey of 356 schools. Key findings include:
- 86.8% of schools responded to the survey, with 36 schools reporting having no Computing Science teachers. Many of these schools are in very remote rural areas.
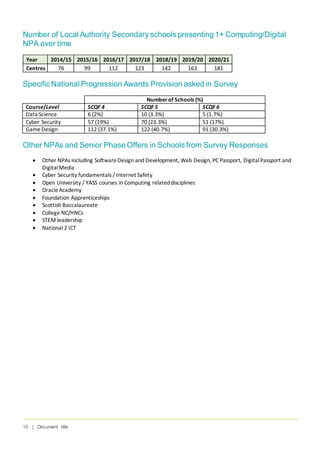
- Around 90% of schools offer some Computing Science in S1/S2, most commonly focusing on programming, web development, and computer systems.
- Over 80% of schools offer National 4/5 Computing Science, while 38.3% offer Advanced Higher.
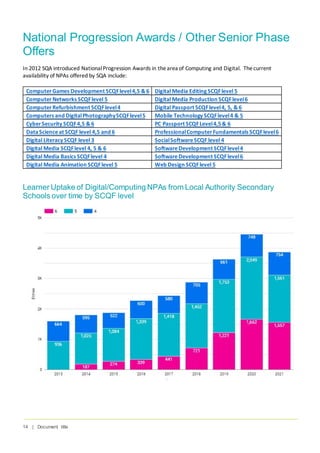
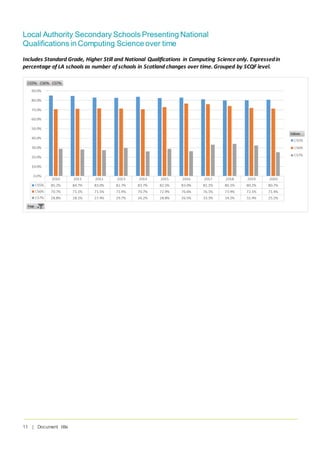
- Presentations for Computing Science qualifications have declined since 2010, particularly at lower levels.
- The content offered in Computing Science qualifications


![12 | Document title
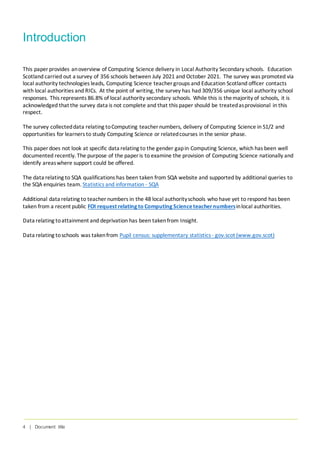
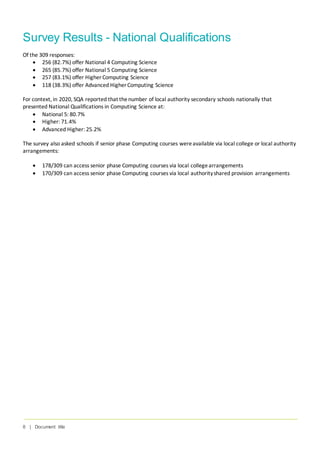
Computing Science National Qualifications
Curriculum Content Offer Over Time
The course content of Computing Science qualifications over time has changed significantly. Particularlyat SCQF
levels 3 and 4. Thehistoric courses at these levels did not have thesame focus as current qualifications. Much of
the content was applications and systems based. As the qualifications developed, much of this content was
removed and replaced with softwaredesign and development and web development.
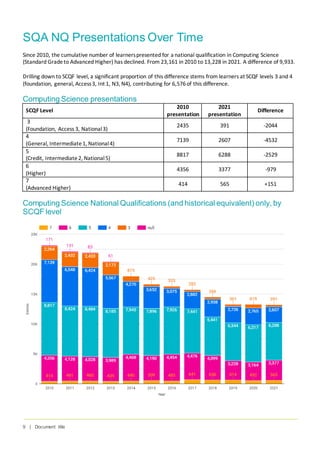
When theHigher Still course Information Systems was available, a number of schools opted for this as their S5/6
Level 6 offer as a progression from Standard GradeComputing. As a result of the discontinuation of Standard
Gradeand Information Systems, schools had to changetheir offer to theNational Qualification Computing
Science route. This may have had an effect on uptake. InformationSystems as a course also had a higher uptake
of femalelearners (average30-34%) compared to Computing.
Summary of the content changes over time for different Computing Science courses at levels 4-6 can be seen in
the following tables.
SCQF Level 4
Standard Grade ComputingStudies(General) Intermediate1 ComputingStudies
Computer Applications(60 hours);
Computer Systems(20hours);
Computer Programming(40hours);
ProjectWork (30hours);
Flexibility (10hours)
Computer Application Software(40 hours);
Computer Systems (40 hours);
Optional Unit
[SoftwareDevelopment;InformationSystems;The
Internet] (40 hours)
2004 Update
2006 Update Computer Applications(40 hours);
MultimediaApplications(40hours);
Optional Unit
[Computers and theInternet;Information and theInternet]
(40 hours)
Computer Applications(60 hours);
Computer Systems(20hours);
Computer Programming(40hours);
ProjectWork (30hours);
Flexibility (10hours)
2014 National4 ComputingScienceCourse Specification
SoftwareDesign and Development;
Information SystemsDesign and Development
Added ValueUnit](https://image.slidesharecdn.com/nih314-computing-science-in-la-secondary-schools-20202021-220211122938/85/Computing-Science-in-Local-Authority-secondary-schools-12-320.jpg)
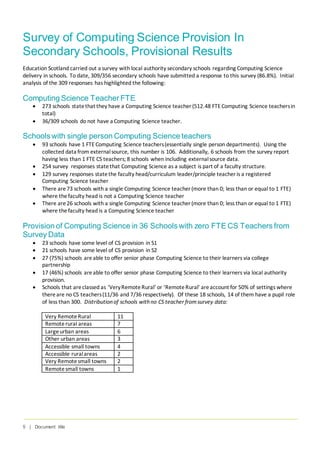
![13 | Document title
SCQF Level 5
Standard Grade ComputingStudies
(Credit)
Intermediate2 Computing Intermediate2 Information
Systems
1999 Arrangements
Computer Applications(60 hours);
Computer Systems(20hours);
Computer Programming(40hours);
ProjectWork (30hours);
Flexibility (10hours)
Computer Systems - includingapplications
(40 hours);
SoftwareDevelopment(40 hours);
ComputingProject(40hours);
DatabaseSystems(40hours);
Information Organisation (40
hours);
Optional Unit[Computer
Application Software;Expert
Systems;Hypermedia] (40hours)
2006 update
Computer Applications(60 hours);
Computer Systems(20hours);
Computer Programming(40hours);
ProjectWork (30hours);
Flexibility (10hours)
Computer Systems (40 hours);
SoftwareDevelopment(40 hours);
Optional Unit[ArtificialIntelligence;
Computer Networking;Multimedia
Technology] (40hours)
UsingInformation (40hours);
DatabaseSystems(40hours);
Optional Unit[ExpertSystems;
Applied Multimedia;TheInternet]
40 hours)
2013 END 2014 END
2014 National5 ComputingScienceCourse Specification
SoftwareDesign and Development;
Information SystemsDesign and Development
2017 Update
SoftwareDesign and Development;
DatabaseDesignandDevelopment;
Web Design and Development;
Computer Systems
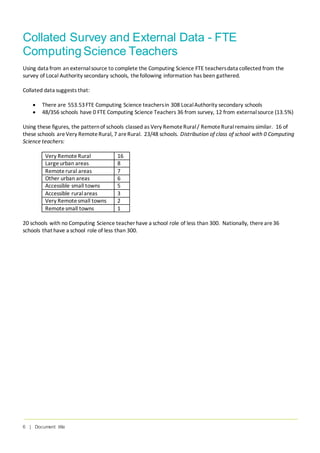
SCQF Level 6
Higher Computing Higher InformationSystems
Computer Systems (40 hours);
SoftwareDevelopment(40 hours);
Optional Unit
[Artificial Intelligence;Computer Programming;Computer
Networking;MultimediaTechnology] (40 hours)
DatabaseSystems(40hours);
Information Organisation (40 hours);
Optional Unit
[Computer ApplicationSoftware;ExpertSystems;
Hypermedia] (40hours)
2006 Update
Computer Systems (40 hours);
SoftwareDevelopment(40 hours);
Optional Unit
[Artificial Intelligence;Computer Networking;Multimedia
Technology] (40hours)
UsingInformation (40hours);
Relational DatabaseSystems (40hours);
Optional Unit
[ExpertSystems;Applied Multimedia;TheInternet] 40
hours)
2014 END
2014 HigherComputingScience CourseSpecification
SoftwareDesign and Development;
Information SystemsDesign and Development
2018 Update
SoftwareDesign and Development;
DatabaseDesignandDevelopment;
Web Design and Development;
Computer Systems](https://image.slidesharecdn.com/nih314-computing-science-in-la-secondary-schools-20202021-220211122938/85/Computing-Science-in-Local-Authority-secondary-schools-13-320.jpg)