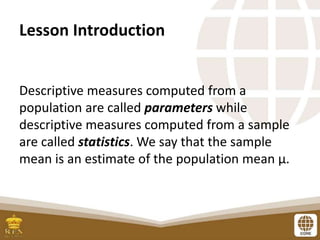
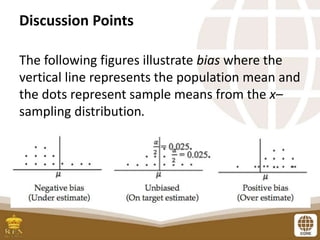
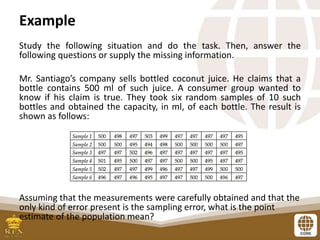
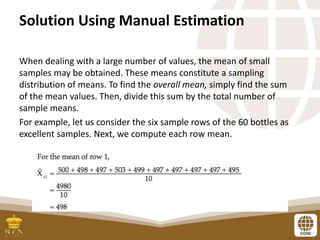
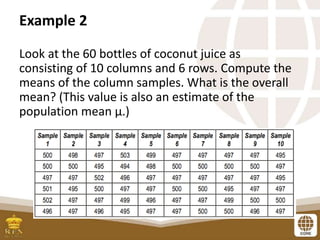
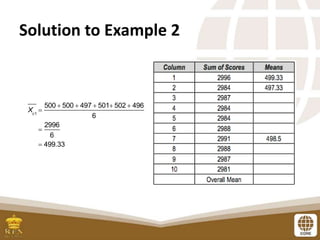
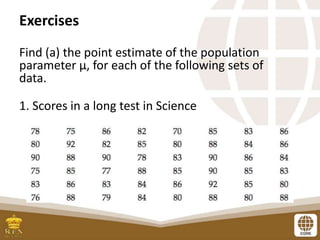
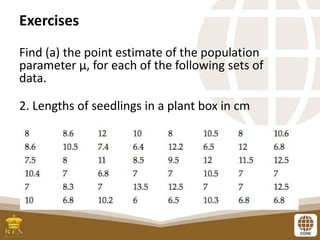
COMPUTING THE POINT ESTIMATE
OF A POPULATION MEAN
Lesson Objectives
At the end of this lesson, you are expected to:
• understand the concept of estimation;
• distinguish between point estimate and
interval estimate; and
• find the point estimates of population means
and proportions.
Pre-Assessment
Pre-Assessment (continuation)
Lesson Introduction
Descriptive measures computed from a
population are called parameters while
descriptive measures computed from a sample
are called statistics. We say that the sample
mean is an estimate of the population mean μ.
Discussion Points
• An estimate is a value or a range of values that
approximate a parameter. It is based on
sample statistics computed from sample data.
• Estimation is the process of determining
parameter values.
Illustrative Example
The mean of the sample is an estimate of the population
parameter μ, the “true” average time it takes to be served in
the restaurant. The number is used to describe a particular
characteristic, wait time, of the population.
Discussion Points
• A point estimate is a specific numerical value
of a population parameter. The sample mean
x– is the best point estimate of the
population mean.
• An interval estimate is a range of values that
may contain the parameter of a population.
Discussion Points
A good estimator has the following properties:
• When the mean of a sample statistic from a
large number of different random samples
equals the true population parameter, then
the sample statistic is an unbiased estimate
of the population parameter.
• Across the many repeated samples, the
estimates are not very far from the true
parameter value.
Discussion Points
The following figures illustrate bias where the
vertical line represents the population mean and
the dots represent sample means from the x–
sampling distribution.
Example
Study the following situation and do the task. Then, answer the
following questions or supply the missing information.
Mr. Santiago’s company sells bottled coconut juice. He claims that a
bottle contains 500 ml of such juice. A consumer group wanted to
know if his claim is true. They took six random samples of 10 such
bottles and obtained the capacity, in ml, of each bottle. The result is
shown as follows:
Assuming that the measurements were carefully obtained and that the
only kind of error present is the sampling error, what is the point
estimate of the population mean?
Solution Using Excel
1. Encode the data in the cells proceeding from cell A1 to cell A10.
2. Select the data.
3. Click the insert function fx. The Insert Function dialog will box
appear.
4. In the Insert Function dialog box, click the arrow to select a
category. A drop window will appear. In this window, click
Statistical.
5. In the Insert Function dialog box, there is another window
labeled Select a function. Click AVERAGE. At the bottom of the
box, click OK.
6. Another dialog box will appear. This is the Function Arguments
box. There are two smaller windows in the box labeled Number
1 and Number 2. In the window Number 1, write A1:A10. The
computer reads the numbers encoded in Column A Row 1,
Column A Row 2, and so on to Column A Row 10.
Steps Using Excel
7. Copy the Formula result in the dialog box. For the encoded data
of sample 1, the result is 498. Then click OK.
8. Repeat the procedure for the other samples.
9. Compute the mean of the means also called overall means. This
is the point estimate of μ.
Solution Using Manual Estimation
When dealing with a large number of values, the mean of small
samples may be obtained. These means constitute a sampling
distribution of means. To find the overall mean, simply find the sum
of the mean values. Then, divide this sum by the total number of
sample means.
For example, let us consider the six sample rows of the 60 bottles as
excellent samples. Next, we compute each row mean.
Example 2
Look at the 60 bottles of coconut juice as
consisting of 10 columns and 6 rows. Compute the
means of the column samples. What is the overall
mean? (This value is also an estimate of the
population mean μ.)
Solution to Example 2
Xc1

500  500  497  501 502  496
6

2996
6
 499.33
Exercises
Find (a) the point estimate of the population
parameter μ, for each of the following sets of
data.
1. Scores in a long test in Science
Exercises
Find (a) the point estimate of the population
parameter μ, for each of the following sets of
data.
2. Lengths of seedlings in a plant box in cm
Summary
• An estimate is a value or a range of values
that approximate a parameter. It is based on
sample statistics computed from sample
data.
• Estimation is the process of determining
parameter values.
Summary
When dealing with a large number of values, the
mean of small samples may be obtained.
These means constitute a sampling distribution
of means.
To find the overall mean, simply find the sum of
the mean values. Then, divide this sum by the
total number of sample means.

PSUnit_IV_Lesson_1_Computing_the_Point_Estimate_of_a_Population_Mean.pptx

  • 1.
    COMPUTING THE POINTESTIMATE OF A POPULATION MEAN
  • 2.
    Lesson Objectives At theend of this lesson, you are expected to: • understand the concept of estimation; • distinguish between point estimate and interval estimate; and • find the point estimates of population means and proportions.
  • 3.
  • 4.
  • 5.
    Lesson Introduction Descriptive measurescomputed from a population are called parameters while descriptive measures computed from a sample are called statistics. We say that the sample mean is an estimate of the population mean μ.
  • 6.
    Discussion Points • Anestimate is a value or a range of values that approximate a parameter. It is based on sample statistics computed from sample data. • Estimation is the process of determining parameter values.
  • 7.
    Illustrative Example The meanof the sample is an estimate of the population parameter μ, the “true” average time it takes to be served in the restaurant. The number is used to describe a particular characteristic, wait time, of the population.
  • 8.
    Discussion Points • Apoint estimate is a specific numerical value of a population parameter. The sample mean x– is the best point estimate of the population mean. • An interval estimate is a range of values that may contain the parameter of a population.
  • 9.
    Discussion Points A goodestimator has the following properties: • When the mean of a sample statistic from a large number of different random samples equals the true population parameter, then the sample statistic is an unbiased estimate of the population parameter. • Across the many repeated samples, the estimates are not very far from the true parameter value.
  • 10.
    Discussion Points The followingfigures illustrate bias where the vertical line represents the population mean and the dots represent sample means from the x– sampling distribution.
  • 11.
    Example Study the followingsituation and do the task. Then, answer the following questions or supply the missing information. Mr. Santiago’s company sells bottled coconut juice. He claims that a bottle contains 500 ml of such juice. A consumer group wanted to know if his claim is true. They took six random samples of 10 such bottles and obtained the capacity, in ml, of each bottle. The result is shown as follows: Assuming that the measurements were carefully obtained and that the only kind of error present is the sampling error, what is the point estimate of the population mean?
  • 12.
    Solution Using Excel 1.Encode the data in the cells proceeding from cell A1 to cell A10. 2. Select the data. 3. Click the insert function fx. The Insert Function dialog will box appear. 4. In the Insert Function dialog box, click the arrow to select a category. A drop window will appear. In this window, click Statistical. 5. In the Insert Function dialog box, there is another window labeled Select a function. Click AVERAGE. At the bottom of the box, click OK. 6. Another dialog box will appear. This is the Function Arguments box. There are two smaller windows in the box labeled Number 1 and Number 2. In the window Number 1, write A1:A10. The computer reads the numbers encoded in Column A Row 1, Column A Row 2, and so on to Column A Row 10.
  • 13.
    Steps Using Excel 7.Copy the Formula result in the dialog box. For the encoded data of sample 1, the result is 498. Then click OK. 8. Repeat the procedure for the other samples. 9. Compute the mean of the means also called overall means. This is the point estimate of μ.
  • 14.
    Solution Using ManualEstimation When dealing with a large number of values, the mean of small samples may be obtained. These means constitute a sampling distribution of means. To find the overall mean, simply find the sum of the mean values. Then, divide this sum by the total number of sample means. For example, let us consider the six sample rows of the 60 bottles as excellent samples. Next, we compute each row mean.
  • 15.
    Example 2 Look atthe 60 bottles of coconut juice as consisting of 10 columns and 6 rows. Compute the means of the column samples. What is the overall mean? (This value is also an estimate of the population mean μ.)
  • 16.
    Solution to Example2 Xc1  500  500  497  501 502  496 6  2996 6  499.33
  • 17.
    Exercises Find (a) thepoint estimate of the population parameter μ, for each of the following sets of data. 1. Scores in a long test in Science
  • 18.
    Exercises Find (a) thepoint estimate of the population parameter μ, for each of the following sets of data. 2. Lengths of seedlings in a plant box in cm
  • 19.
    Summary • An estimateis a value or a range of values that approximate a parameter. It is based on sample statistics computed from sample data. • Estimation is the process of determining parameter values.
  • 20.
    Summary When dealing witha large number of values, the mean of small samples may be obtained. These means constitute a sampling distribution of means. To find the overall mean, simply find the sum of the mean values. Then, divide this sum by the total number of sample means.