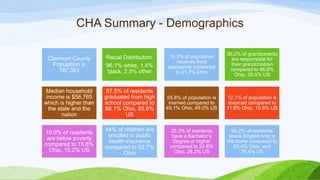
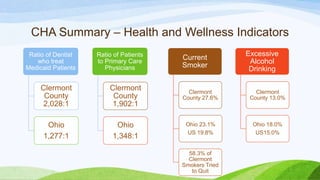
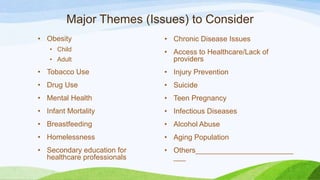
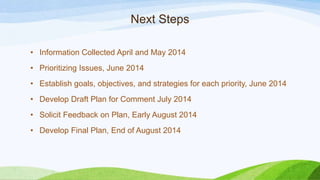
Community Health
Improvement Plan
Planning Presentation 2014
Julianne Nesbit, Health Commissioner
Objectives
• Summary of Community Health Assessment
(CHA)/Feedback
• Community Themes and Strengths Assessment
• Community Health Improvement Plan (CHIP)
Priority Issues and Strategies
CHA/CHIP Committee Participants
• Nursing Homes
• Boys and Girls Club
• Child Focus, Inc.
• Clermont County Board of Commissioners
• Clermont County Developmental Disabilities
• Clermont County Board of Health
• Clermont County Chamber of Commerce
• Clermont County Community Services
• Clermont County Coroner’s Office
• Clermont County Department of Job and Family
Services
• Clermont County Educational Service Center
• Clermont County Emergency Management Agency
• Clermont County Fire/EMS Association
• Clermont County Health District
• Clermont County Mental Health and Recovery
Board
• Clermont County Office of Environmental Quality
• Clermont County Park District
• Clermont County Senior Services
• Clermont County Sherriff and Police Chief’s
Association
• Clermont YMCA
• Clermont Recovery Center
• Clermont Transportation Connection
• Mercy Hospital Clermont
• Ohio State University Extension Office
• United Way of Greater Cincinnati
• University of Cincinnati, College of Nursing and
Health, East Campus
• YWCA of Greater Cincinnati – Eastern Area
CHA Summary - Demographics
16.3% of population
receives food
assistance compared
to 21.7% Ohio
36.2% of grandparents
are responsible for
their grandchildren
compared to 46.6%
Ohio, 39.5% US
55.8% of population is
married compared to
49.1% Ohio, 49.0% US
12.1% of population is
divorced compared to
11.9% Ohio, 10.8% US
25.3% of residents
have a Bachelor’s
Degree or higher
compared to 24.6%
Ohio, 28.2% US
96.2% of residents
speak English only in
the home compared to
93.4% Ohio, and
79.4% US
Clermont County
Population is
197,363
Racial Distribution:
96.1% white, 1.4%
black, 2.3% other
Median household
income is $58,765
which is higher than
the state and the
nation
87.5% of residents
graduated from high
school compared to
88.1% Ohio, 85.6%
US
10.0% of residents
are below poverty
compared to 15.8%
Ohio, 15.2% US
44% of children are
enrolled in public
health insurance
compared to 52.7%
Ohio
CHA Summary – Health and Wellness Indicators
Ratio of Dentist
who treat
Medicaid Patients
Clermont
County
2,028:1
Ohio
1,277:1
Ratio of Patients
to Primary Care
Physicians
Clermont
County
1,902:1
Ohio
1,348:1
Current
Smoker
Clermont
County 27.6%
Ohio 23.1%
US 19.8%
58.3% of
Clermont
Smokers Tried
to Quit
Excessive
Alcohol
Drinking
Clermont
County 13.0%
Ohio 18.0%
US15.0%
CHA Summary – Health and Wellness Indicators
continued
0
5
10
15
20
25
30
35
40
Underweight Normal Weight Overweight Obese
Adult Body Mass Index
Clermont County Ohio US
CHA Summary – Health and Wellness Indicators
continued
Only 27.3% of
adults participate in
moderate physical
activity three times
a week
Clermont County
Average Seatbelt
use 2008-2012
77.1%
54% of
adults report
not getting
enough
exercise
Reasons for Not Enough Exercise
Lack of Time Lack of Motivation
Physical Limitations Other
Lack of Access Safety Concerns
CHA Summary – Maternal and Child Health
Indicators
Infant Mortality
Rate
Clermont
County
6.1
Ohio
7.7
Smoking
During
Pregnancy
Clermont
County
22.2%
Ohio
17.8%
Teen
Pregnancy
Rate
Clermont
County
23.0
Ohio
29.0
First Trimester
Prenatal Care
Clermont
County
81.4%
Ohio
73.0%
CHA Summary – Maternal and Child Health
Indicators continued
Clermont
County Third
Grade Children
Overweight/
Obese
37.2%, 34.7%
Ohio, 35.5% US
Infants Breastfed at
least 6 months:
Clermont County
12.7%, Ohio
14.9%, US 25.1%
Clermont County
children that participate
in at least 1 hour of
physical activity 6-7
days a week, 56.1%
Clermont County
children that watch 3
or more hours of TV
on school
days, 23.1%
CHA Summary – Social Health Indicators
Drug Poisoning Rates
per 100,000
Clermont
County
Ohio
Deaths 2009-2010 20 13
Hospitalizations 2010 44 22
Emergency Department
Visits 2010
75 64
0
10
20
30
40
50
60
2006 2007 2008 2009 2010 2011 2012
NumberofDeaths
Drug Related Deaths by Intent
Clermont County, 2006-2012
Suicide
Accidental
CHA Summary – Social Health Indicators
continued
• Clermont County
5.98
• Ohio 4.53
Rate of
Children in
Placement
• Clermont County
has fewer cases of
physical abuse
(25%) and neglect
(21%) than Ohio
(27% & 30%)
Child Abuse
and Neglect
• Clermont County
has more families
in need of services
(39%) than Ohio
(19%)
Families in
Need
CHA Summary – Death and Illness Indicators
Chronic Disease
Indicators 2009
Clermont
County (OH-
KY-IN MSA)
Ohio US
Diabetes 7.9% 10.1% 8.3%
Asthma 13.0% 15.0% 13.5%
Heart Attack 5.5% 5.4% 4.2%
Hypertension 29.3% 31.7% 28.7%
High Cholesterol 37.4% 39.6% 37.5%
Arthritis 27.5% 30.8% 26.0%
Stroke 2.8% 3.1% 2.4%
Angina/Coronary Heart
Disease
4.2% 4.2% 3.8%
Leading Causes of
Death 2010 - Rates
Clermont
County
Ohio
Heart Disease 161.3 191.7
Cancer 185.6 187.3
Chronic Lower
Respiratory Disease
57.4 50.4
Stroke 53.6 42.4
Accident 49.8 41.6
Alzheimer's Disease 29.3 29.7
CHA Summary –
Death and Illness
Indicators
Incidence of Selected
Infectious Diseases
Clermont
County
Rate
Ohio
Rate
Sexually Transmitted Infections, 2012
Chlamydia 240.2 462
Gonorrhea 40.5 143.5
Syphilis 3 9.9
Prevalence HIV/AIDS
Persons living with HIV diagnosis 35 155.3
Vaccine Preventable Diseases, 2011
Influenza-Associated Hospitalization 12.1 20.9
Meningococcal Disease 0 0.2
Mumps 0 0.1
Pertussis 6 6
Varicella 9 9
Enteric Diseases, 2011
Campylobacteriosis 7 10.3
Cryptosporidiosis 25.1 9.6
Escherichia coli (STEC) 2.5 1.6
Giardiasis 10 6.8
Salmonellosis 8 10.2
Shigellosis 8 2.9
Tuberculosis, 2012
Tuberculosis 1 1.3
CHA Summary – Environmental Health
Indicators
Recreational Sites in Clermont County
70%
24%
5% 1%
0%
0%
Air Quality Index (Ozone)
Clermont County
Days AQ Good
Days AQ Moderate
Days AQ Unhealthy for
Sensitive Groups
Days AQ was Unhealthy
Days AQ Very Unhealth
Days AQ Hazardous
Community Strengths and
Themes Assessment
Senior Living Facilities
(subsidized)
• Lytle Trace, Williamsburg
• The Crossing of Amelia
• Steamboat Trails, New Richmond
• O’Bannon Terrace, Goshen
• Summerside Woods, Cincinnati
• Garrison Place, Felicity
• Dimmitt Woods, Batavia
• AHEPA 127, Milford
• Amanda Acres, Amelia
• Bethel Woods
• Chaucer Square, Amelia
• Felicity Apt
• Owensville Commons
• SEM Villa , Milford
• St. Marks, Milford
• Tabaleen Cove, Milford
• Thompson Meadows, Amelia
Nursing Homes
Organization City
Angels Home Health New Richmond
Optioncare Milford
Eastgate Health Care Center Cincinnati
SEM Haven Milford
Sunrise Manor & Convalescent
Center Inc
Amelia
Mellonridge Rest Home Goshen
Quehl Residential Home Milford
MRDD Group Home Milford
Eastgate Retirement Village Cincinnati
Dobbins Nursing Home New Richmond
Batavia Nursing Care Center Batavia
Arborview Williamsburg
Arbors at Milford Milford
Urgent Care
Mercy Health Solutions Summerside
Bethel Internal Medicine
and Pediatrics
Bethel
Doctors Urgent Care Milford
Eastside Urgent Care Cincinnati
Local Farmers' Markets
• Batavia Market
• Goshen Farmstand
• Milford Market
• Mt. Carmel Market
• Wilfert’s Farm Amelia
• Wilfert’s Farmstand Amelia
• Wilfert's Farmstand Withamsville Area
• Wilfert's Farmstand Mt. Carmel Area
Faith Based Organizations
Quality of Life
Schools
Community
Participation
Economic
Opportunity
Recreation
Health
Care
System
Safe
Place
to Live
Networks
of Support
Consider each supporting factor on a scale of 1-5 (1 – Very Poor, 2 – Poor, 3 –
Fair, 4 – Good, 5 – Very Good) and then consider overall quality of life.
Consider access, cost,
availability, quality,
options in healthcare
Consider locally owned
businesses , jobs with career
growth, job training, higher
education, affordable housing,
reasonable commute
Consider neighbors,
support groups, faith
based community
Consider residents involvement
in community events, volunteers
Consider safety at home, workplace,
school, playground, parks, mall
What are the Major Themes (Issues)?
Major Themes (Issues) to Consider
• Obesity
• Child
• Adult
• Tobacco Use
• Drug Use
• Mental Health
• Infant Mortality
• Breastfeeding
• Homelessness
• Secondary education for
healthcare professionals
• Chronic Disease Issues
• Access to Healthcare/Lack of
providers
• Injury Prevention
• Suicide
• Teen Pregnancy
• Infectious Diseases
• Alcohol Abuse
• Aging Population
• Others________________________
___
Suggestions/Strategies
Next Steps
• Information Collected April and May 2014
• Prioritizing Issues, June 2014
• Establish goals, objectives, and strategies for each priority, June 2014
• Develop Draft Plan for Comment July 2014
• Solicit Feedback on Plan, Early August 2014
• Develop Final Plan, End of August 2014
How You Can Continue to Participate
• Information is posted on Health District website at
www.clermonthealthdistrict.org
• Notifications will be made through press releases and social media
(Facebook)
• Contact the Health District directly at:
• 513-732-7499
• cchealth@clermontcountyohio.gov

Community Health Improvement Plan

  • 1.
    Community Health Improvement Plan PlanningPresentation 2014 Julianne Nesbit, Health Commissioner
  • 2.
    Objectives • Summary ofCommunity Health Assessment (CHA)/Feedback • Community Themes and Strengths Assessment • Community Health Improvement Plan (CHIP) Priority Issues and Strategies
  • 3.
    CHA/CHIP Committee Participants •Nursing Homes • Boys and Girls Club • Child Focus, Inc. • Clermont County Board of Commissioners • Clermont County Developmental Disabilities • Clermont County Board of Health • Clermont County Chamber of Commerce • Clermont County Community Services • Clermont County Coroner’s Office • Clermont County Department of Job and Family Services • Clermont County Educational Service Center • Clermont County Emergency Management Agency • Clermont County Fire/EMS Association • Clermont County Health District • Clermont County Mental Health and Recovery Board • Clermont County Office of Environmental Quality • Clermont County Park District • Clermont County Senior Services • Clermont County Sherriff and Police Chief’s Association • Clermont YMCA • Clermont Recovery Center • Clermont Transportation Connection • Mercy Hospital Clermont • Ohio State University Extension Office • United Way of Greater Cincinnati • University of Cincinnati, College of Nursing and Health, East Campus • YWCA of Greater Cincinnati – Eastern Area
  • 4.
    CHA Summary -Demographics 16.3% of population receives food assistance compared to 21.7% Ohio 36.2% of grandparents are responsible for their grandchildren compared to 46.6% Ohio, 39.5% US 55.8% of population is married compared to 49.1% Ohio, 49.0% US 12.1% of population is divorced compared to 11.9% Ohio, 10.8% US 25.3% of residents have a Bachelor’s Degree or higher compared to 24.6% Ohio, 28.2% US 96.2% of residents speak English only in the home compared to 93.4% Ohio, and 79.4% US Clermont County Population is 197,363 Racial Distribution: 96.1% white, 1.4% black, 2.3% other Median household income is $58,765 which is higher than the state and the nation 87.5% of residents graduated from high school compared to 88.1% Ohio, 85.6% US 10.0% of residents are below poverty compared to 15.8% Ohio, 15.2% US 44% of children are enrolled in public health insurance compared to 52.7% Ohio
  • 5.
    CHA Summary –Health and Wellness Indicators Ratio of Dentist who treat Medicaid Patients Clermont County 2,028:1 Ohio 1,277:1 Ratio of Patients to Primary Care Physicians Clermont County 1,902:1 Ohio 1,348:1 Current Smoker Clermont County 27.6% Ohio 23.1% US 19.8% 58.3% of Clermont Smokers Tried to Quit Excessive Alcohol Drinking Clermont County 13.0% Ohio 18.0% US15.0%
  • 6.
    CHA Summary –Health and Wellness Indicators continued 0 5 10 15 20 25 30 35 40 Underweight Normal Weight Overweight Obese Adult Body Mass Index Clermont County Ohio US
  • 7.
    CHA Summary –Health and Wellness Indicators continued Only 27.3% of adults participate in moderate physical activity three times a week Clermont County Average Seatbelt use 2008-2012 77.1% 54% of adults report not getting enough exercise Reasons for Not Enough Exercise Lack of Time Lack of Motivation Physical Limitations Other Lack of Access Safety Concerns
  • 8.
    CHA Summary –Maternal and Child Health Indicators Infant Mortality Rate Clermont County 6.1 Ohio 7.7 Smoking During Pregnancy Clermont County 22.2% Ohio 17.8% Teen Pregnancy Rate Clermont County 23.0 Ohio 29.0 First Trimester Prenatal Care Clermont County 81.4% Ohio 73.0%
  • 9.
    CHA Summary –Maternal and Child Health Indicators continued Clermont County Third Grade Children Overweight/ Obese 37.2%, 34.7% Ohio, 35.5% US Infants Breastfed at least 6 months: Clermont County 12.7%, Ohio 14.9%, US 25.1% Clermont County children that participate in at least 1 hour of physical activity 6-7 days a week, 56.1% Clermont County children that watch 3 or more hours of TV on school days, 23.1%
  • 10.
    CHA Summary –Social Health Indicators Drug Poisoning Rates per 100,000 Clermont County Ohio Deaths 2009-2010 20 13 Hospitalizations 2010 44 22 Emergency Department Visits 2010 75 64 0 10 20 30 40 50 60 2006 2007 2008 2009 2010 2011 2012 NumberofDeaths Drug Related Deaths by Intent Clermont County, 2006-2012 Suicide Accidental
  • 11.
    CHA Summary –Social Health Indicators continued • Clermont County 5.98 • Ohio 4.53 Rate of Children in Placement • Clermont County has fewer cases of physical abuse (25%) and neglect (21%) than Ohio (27% & 30%) Child Abuse and Neglect • Clermont County has more families in need of services (39%) than Ohio (19%) Families in Need
  • 12.
    CHA Summary –Death and Illness Indicators Chronic Disease Indicators 2009 Clermont County (OH- KY-IN MSA) Ohio US Diabetes 7.9% 10.1% 8.3% Asthma 13.0% 15.0% 13.5% Heart Attack 5.5% 5.4% 4.2% Hypertension 29.3% 31.7% 28.7% High Cholesterol 37.4% 39.6% 37.5% Arthritis 27.5% 30.8% 26.0% Stroke 2.8% 3.1% 2.4% Angina/Coronary Heart Disease 4.2% 4.2% 3.8% Leading Causes of Death 2010 - Rates Clermont County Ohio Heart Disease 161.3 191.7 Cancer 185.6 187.3 Chronic Lower Respiratory Disease 57.4 50.4 Stroke 53.6 42.4 Accident 49.8 41.6 Alzheimer's Disease 29.3 29.7
  • 13.
    CHA Summary – Deathand Illness Indicators Incidence of Selected Infectious Diseases Clermont County Rate Ohio Rate Sexually Transmitted Infections, 2012 Chlamydia 240.2 462 Gonorrhea 40.5 143.5 Syphilis 3 9.9 Prevalence HIV/AIDS Persons living with HIV diagnosis 35 155.3 Vaccine Preventable Diseases, 2011 Influenza-Associated Hospitalization 12.1 20.9 Meningococcal Disease 0 0.2 Mumps 0 0.1 Pertussis 6 6 Varicella 9 9 Enteric Diseases, 2011 Campylobacteriosis 7 10.3 Cryptosporidiosis 25.1 9.6 Escherichia coli (STEC) 2.5 1.6 Giardiasis 10 6.8 Salmonellosis 8 10.2 Shigellosis 8 2.9 Tuberculosis, 2012 Tuberculosis 1 1.3
  • 14.
    CHA Summary –Environmental Health Indicators Recreational Sites in Clermont County 70% 24% 5% 1% 0% 0% Air Quality Index (Ozone) Clermont County Days AQ Good Days AQ Moderate Days AQ Unhealthy for Sensitive Groups Days AQ was Unhealthy Days AQ Very Unhealth Days AQ Hazardous
  • 15.
  • 16.
    Senior Living Facilities (subsidized) •Lytle Trace, Williamsburg • The Crossing of Amelia • Steamboat Trails, New Richmond • O’Bannon Terrace, Goshen • Summerside Woods, Cincinnati • Garrison Place, Felicity • Dimmitt Woods, Batavia • AHEPA 127, Milford • Amanda Acres, Amelia • Bethel Woods • Chaucer Square, Amelia • Felicity Apt • Owensville Commons • SEM Villa , Milford • St. Marks, Milford • Tabaleen Cove, Milford • Thompson Meadows, Amelia Nursing Homes Organization City Angels Home Health New Richmond Optioncare Milford Eastgate Health Care Center Cincinnati SEM Haven Milford Sunrise Manor & Convalescent Center Inc Amelia Mellonridge Rest Home Goshen Quehl Residential Home Milford MRDD Group Home Milford MRDD Group Home Milford Eastgate Retirement Village Cincinnati Dobbins Nursing Home New Richmond Batavia Nursing Care Center Batavia Arborview Williamsburg Arbors at Milford Milford Urgent Care Mercy Health Solutions Summerside Bethel Internal Medicine and Pediatrics Bethel Doctors Urgent Care Milford Eastside Urgent Care Cincinnati Local Farmers' Markets • Batavia Market • Goshen Farmstand • Milford Market • Mt. Carmel Market • Wilfert’s Farm Amelia • Wilfert’s Farmstand Amelia • Wilfert's Farmstand Withamsville Area • Wilfert's Farmstand Mt. Carmel Area Faith Based Organizations
  • 17.
    Quality of Life Schools Community Participation Economic Opportunity Recreation Health Care System Safe Place toLive Networks of Support Consider each supporting factor on a scale of 1-5 (1 – Very Poor, 2 – Poor, 3 – Fair, 4 – Good, 5 – Very Good) and then consider overall quality of life. Consider access, cost, availability, quality, options in healthcare Consider locally owned businesses , jobs with career growth, job training, higher education, affordable housing, reasonable commute Consider neighbors, support groups, faith based community Consider residents involvement in community events, volunteers Consider safety at home, workplace, school, playground, parks, mall
  • 18.
    What are theMajor Themes (Issues)?
  • 19.
    Major Themes (Issues)to Consider • Obesity • Child • Adult • Tobacco Use • Drug Use • Mental Health • Infant Mortality • Breastfeeding • Homelessness • Secondary education for healthcare professionals • Chronic Disease Issues • Access to Healthcare/Lack of providers • Injury Prevention • Suicide • Teen Pregnancy • Infectious Diseases • Alcohol Abuse • Aging Population • Others________________________ ___
  • 20.
  • 21.
    Next Steps • InformationCollected April and May 2014 • Prioritizing Issues, June 2014 • Establish goals, objectives, and strategies for each priority, June 2014 • Develop Draft Plan for Comment July 2014 • Solicit Feedback on Plan, Early August 2014 • Develop Final Plan, End of August 2014
  • 22.
    How You CanContinue to Participate • Information is posted on Health District website at www.clermonthealthdistrict.org • Notifications will be made through press releases and social media (Facebook) • Contact the Health District directly at: • 513-732-7499 • cchealth@clermontcountyohio.gov