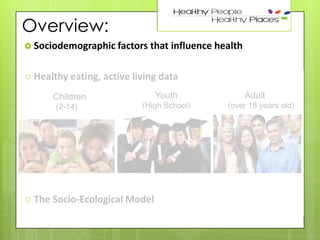
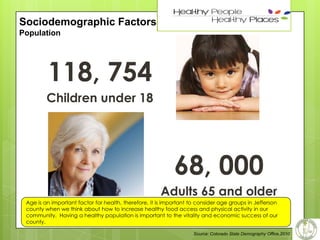
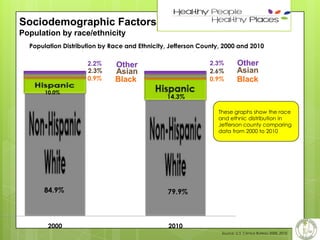
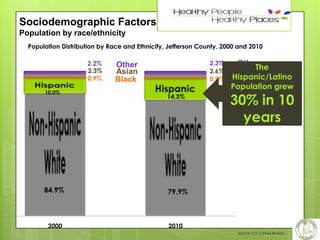
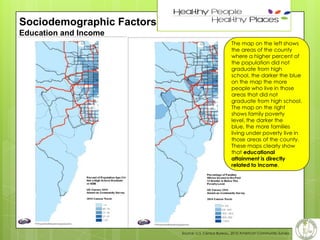
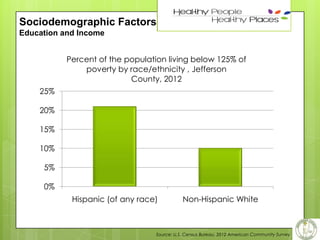
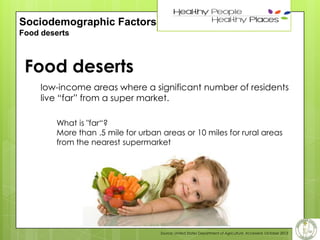
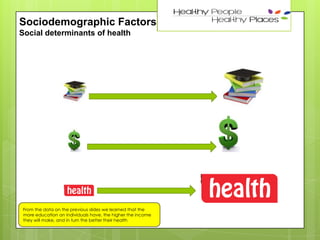
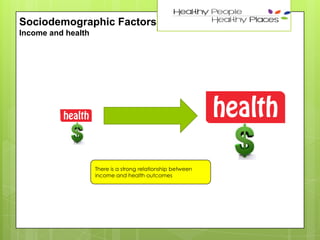
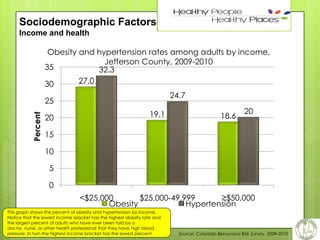
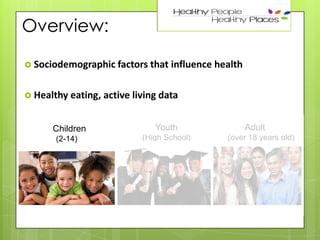
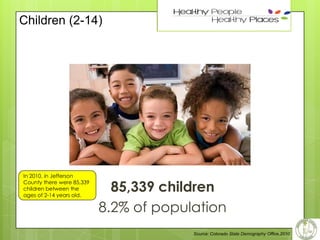
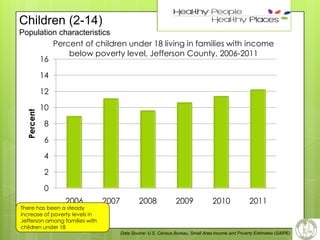
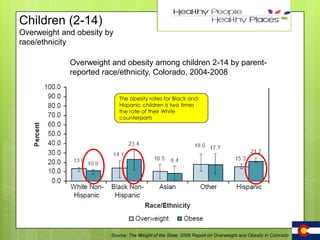
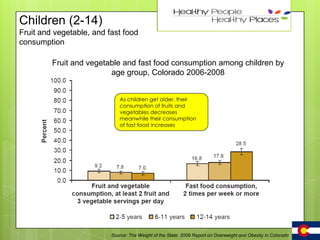
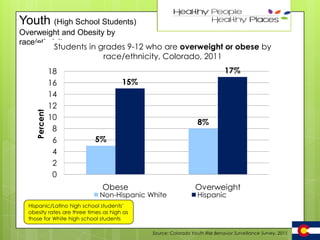
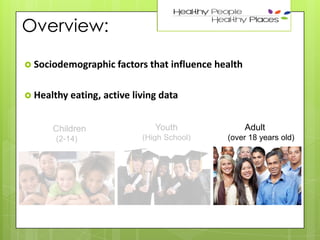
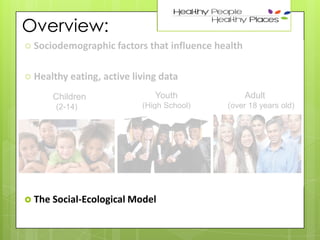
www.healthypeoplehealthyplacesjeffco.com
Community Health Improvement plan
Work Groups
October 22, 2013

Ana Marin
Epidemiologist
Jefferson County Public Health
1
2

The objectives of this presentation are:
• To give an overview of the
demographic trends in Jefferson
County
• Present healthy eating, active living
data and their relationship with
obesity and chronic disease
• The data will be broken into three
groups, adults, youth, and children
• Finally, discuss how the SocialEcological Model can help address
the increase in obesity by improving
healthy food access and physical
activity
Overview:
 Sociodemographic factors that
 Healthy eating,

active living data
Youth

Children
(2-14)

influence health

(High School)

 The Socio-Ecological Model

Adult
(over 18 years old)
4

Sociodemographic Factors
Population

Population

population:
534,543

th

Highest county population

45th fastest growth rate
(out of 63 counties)

Source: U.S. Census Bureau
5

Sociodemographic Factors
Population

2010

2000

90 years & over

Males

Females

85 to 89 years
80 to 84 years
75 to 79 years
70 to 74 years
65 to 69 years

These population
pyramids show the
changes in
population over the
ten year period in
Jefferson County
from 2000 to 2010 by
age groups and
gender

60 to 64 years
55 to 59 years

Age group

50 to 54 years
45 to 49 years
40 to 44 years
35 to 39 years
30 to 34 years
25 to 29 years
20 to 24 years
15 to 19 years

10 to 14 years
5 to 9 years
Under 5 years
5

4

3

2

1

0

1

2

3

4

5

Percentage in age group from total population
Source: U.S. Census Bureau
6

Sociodemographic Factors
Population

118, 754
Children under 18

68, 000
Adults 65 and older
Age is an important factor for health, therefore, it is important to consider age groups in Jefferson
county when we think about how to increase healthy food access and physical activity in our
community. Having a healthy population is important to the vitality and economic success of our
county.
Source: Colorado State Demography Office,2010
7

Sociodemographic Factors
Population by race/ethnicity
Population Distributionor Latino
by Race andHispanic BlackJefferson County, 2000 and 2010
Ethnicity,
Hispanic
Non
Non Hispanic Asian
Other

Population Distribution by Race and Ethnicity, Jefferson County, 2000 and 2010

Non Hispanic White

2.2%
2.3%
0.9%
10.0%

2.3%
2.6%
0.9%

Other
Asian
Black

Other
Asian
Black

14.3%
These graphs show the race
and ethnic distribution in
Jefferson county comparing
data from 2000 to 2010

84.9%

2000

79.9%

2010
Source: U.S. Census Bureau 2000, 2010
8

Sociodemographic Factors
Population by race/ethnicity
Population Distribution by Race and Ethnicity, Jefferson County, 2000 and 2010
Non Hispanic Asian
Other

Non Hispanic White
Hispanic or Latino
Non Hispanic
Population Distribution by Race and Ethnicity, Jefferson County, 2000 and 2010 Black

2.2%
2.3%
0.9%
10.0%

84.9%

2000

2.3%
2.6%
0.9%

Other
Asian
Black
14.3%

Other
The
Asian
Hispanic/Latino
Black
Population grew

30% in 10
years

79.9%

2010
Source: U.S. Census Bureau
9

Sociodemographic Factors
Educational attainment
Less than 9th grade, 2.0%
9th to 12th grade, no
diploma, 4.7%

Graduate or professional
degree, 14.4%

High school graduate
(includes
equivalency), 22.2%
Bachelor's
degree, 26.40%
Some college, no
degree, 22.7%

Associate's degree,
7.50%

48.3%
of Jefferson County residents
over 25 have completed an
associate’s degree or higher
education

6.7%
of Jefferson County residents
over 25 did not received a
High School diploma, or
equivalent

*Adults 25 and older

Source: U.S. Census Bureau
10

Sociodemographic Factors
Education and Income
The map on the left shows
the areas of the county
where a higher percent of
the population did not
graduate from high
school, the darker the blue
on the map the more
people who live in those
areas that did not
graduate from high school.
The map on the right
shows family poverty
level, the darker the
blue, the more families
living under poverty live in
those areas of the county.
These maps clearly show
that educational
attainment is directly
related to income.

Source: U.S. Census Bureau, 2010 American Community Survey
11

Sociodemographic Factors
Education and Income
Percent of the population living below 125% of
poverty by race/ethnicity , Jefferson
County, 2012
25%
20%
15%
10%

5%
0%
Hispanic (of any race)

Non-Hispanic White

Source: U.S. Census Bureau, 2012 American Community Survey
12

Sociodemographic Factors
Food deserts

Food deserts
low-income areas where a significant number of residents
live “far” from a super market.
What is "far“?
More than .5 mile for urban areas or 10 miles for rural areas
from the nearest supermarket

Source: United States Department of Agriculture, Accessed, October 2013
13

Sociodemographic Factors
Food deserts

DENVER

JEFFCO

The orange squares on the map
represent food deserts by Census Tract.
Keep in mind that some people and
places, especially those with lowincome, may face greater barriers in
accessing healthy and affordable food
retailers, which may negatively affect
diet and food security.
Source: United States Department of Agriculture, Accessed, October 2013
14

Sociodemographic Factors
Income

Median household Income

$63,826

Household income includes the income of the
householder and all other individuals 15 years old
and over in the household, whether they are
related to the householder or not.
Source: U.S. Census Bureau
15

Sociodemographic Factors
Income

How much does it cost to live in Jeffco?

Family of 4:
2 adults
1 preschooler
1 school-age child
16

Sociodemographic Factors
Income

How much does it cost to live in Jeffco?

$62,952*

The $62,952 annual income is for a family
of four with two adults, one
preschooler, and one school-age child.
This annual income was calculated using
the Self-Sufficiency Standard which
defines the income realistically needed to
support a family, without public or private
assistance.

Source: *Colorado Center on Law and Policy, The Self-Sufficiency Standard for Colorado, 2011
17

Sociodemographic Factors
Income

How much does it cost to live in Jeffco?

$62,952*

$7.78 Minimum Wage
Both parents working 40hrs/wk
• No days off
• No holidays

Let’s think about a family in which both
parents work full time, make minimum
wage, and take no days off or holidays.
What would be their combined annual
gross income?

Source: *Colorado Center on Law and Policy, The Self-Sufficiency Standard for Colorado, 2011
18

Sociodemographic Factors
Income

How much does it cost to live in Jeffco?

$62,952*

$7.78 Minimum Wage
Both parents working 40hrs/wk
• No days off
• No holidays

$32,365
Let’s think about a family in which both
parents work full time, make minimum
wage, and take no days off or holidays.
What would be their combined annual
gross income?
The combined annual gross income would
be about half of the Self Sufficiency
Standard
Source: *Colorado Center on Law and Policy, The Self-Sufficiency Standard for Colorado, 2011
19

Sociodemographic Factors
Income

How much does it cost to live in Jeffco?

*
$62,952

$7.78 Minimum Wage
Both parents working 40hrs/wk
• No days off
• No holidays

$32,365
This is roughly HALF of what is needed

It was calculated that in Jefferson County for this
family to meet the Self Sufficiency Standard, the
minimum wage should be $14.90

$14.90 Self-sufficient Wage

Source: *Colorado Center on Law and Policy, The Self-Sufficiency Standard for Colorado, 2011
20

Sociodemographic Factors
Social determinants of health

From the data on the previous slides we learned that the
more education an individuals have, the higher the income
they will make, and in turn the better their health
21

Sociodemographic Factors
Income and health

There is a strong relationship between
income and health outcomes
22

Sociodemographic Factors
Income and health
Obesity and hypertension rates among adults by income,
Jefferson County, 2009-2010
35
32.3
27.0
30

24.7

Percent

25
20

19.1

18.6

20

15
10

5
0
<$25,000
$25,000-49,999
≥$50,000
Obesity
Hypertension
This graph shows the percent of obesity and hypertension by income.
Notice that the lowest income bracket has the highest obesity rate and
the largest percent of adults who have ever been told by a
doctor, nurse, or other health professional that they have high blood
pressure. In turn the highest income bracket has the lowest percent.

Source: Colorado Behavioral Risk Survey, 2009-2010
Overview:

23

 Sociodemographic factors that
 Healthy eating,

Children
(2-14)

influence health

active living data
Youth
(High School)

Adult
(over 18 years old)
Children (2-14)

In 2010, in Jefferson
County there were 85,339
children between the
ages of 2-14 years old.

24

85,339 children
8.2% of population
Source: Colorado State Demography Office,2010
25

Children (2-14)

Population characteristics
Percent of children under 18 living in families with income
below poverty level, Jefferson County, 2006-2011
16
14

Percent

12
10
8
6
4
2

0
2006

There has been a steady
increase of poverty levels in
Jefferson among families with
children under 18

2007

2008

2009

2010

2011

Data Source: U.S. Census Bureau, Small Area Income and Poverty Estimates (SAIPE)
26

Children (2-14)
Overweight and obesity by
race/ethnicity

Overweight and obesity among children 2-14 by parentreported race/ethnicity, Colorado, 2004-2008
The obesity rates for Black and
Hispanic children is two times
the rate of their White
counterparts

Source: The Weight of the State: 2009 Report on Overweight and Obesity in Colorado
27

Children (2-14)
Fruit and vegetable, and fast food
consumption

Fruit and vegetable and fast food consumption among children by
age group, Colorado 2006-2008
As children get older, their
consumption of fruits and
vegetables decreases
meanwhile their consumption
of fast food increases

Source: The Weight of the State: 2009 Report on Overweight and Obesity in Colorado
Children (2-14)

28

Free and reduced lunch (all
grades)

of schools in Jeffco at least 3 out
of 5 students qualify for free or
reduced lunch.

In other words, in 32 schools out of 145, more than 60% of students
qualified for free or reduce lunch. (Oct 2013)

In 2012, 34% of students in
Jeffco qualified to receive
free or reduced lunch (this
is an average of all schools
in the district). (Oct 2013)
Source: Jeffco Public Schools
Children (2-14)

29

Food insecurity
Notice that this is the
number of SNAP cases
not the number of
individuals.

Open SNAP cases
in Jeffco (September 2013)

Keep in mind that
the WIC program is
for children under
the age of 5

Children in Jeffco
received vouchers
(2011)

Source: Hunger Free Colorado, 2013 Kids Count in Colorado Report
Children (2-14)

30

Food insecurity

35.4%

of parents reported
often or sometimes
relied on low-cost
food to feed their
children because
they were running
out of money to buy
food. (2012 data)

Source: Colorado Child Health Survey, Colorado Department of Public Health and Environment
Overview:

31

 Sociodemographic factors that
 Healthy eating,

Children
(2-14)

influence health

active living data
Youth
(High School)

Adult
(over 18 years old)
Youth (High School

32

Students)

In 2010, in Jefferson
County there were
35,727 young adults
between the ages of
14-18.
Notice that the data
presented for youth is
collected in High
School and may mean
that those who
participated might
have been younger
than 14 and/or older
than 18 at the time of
the health survey

35,724
ages 14-18
Source: Colorado State Demography Office,2010
33

Youth (High School

Students)
High school graduation rates
High school graduation rates by
race/ethnicity, Jefferson County, 2010-2011
100
89.0

90

80

79.1

73.1

70

Rate

83.1

64.8

61.8

60
50
40

30
20
10
0
District

Non-Hispanic White Hispanic

Black

Asian

American Indian or
Alaska Native

Although high school graduation rates in Jefferson County are high, the graduation rates vary depending on
the race/ethnicity of the students. White students have the highest graduation rates while American
Indian/Alaska Native students have the lowest. This is important to health because educational attainment is
directly related to income and income is related to health.
Source: Colorado Department of Education
Youth (High School Students)

34

Percent

Overweight and Obesity by
race/ethnicity
Students Students in grades 9-129-12 overweight are overweight or obese by
in grades who are who or obese by race/ethnicity, Colorado, 2011
race/ethnicity, Colorado, 2011
18
16
14
12
10
8
6
4
2
0

17%
15%

8%
5%

Obese

Non-Hispanic White

Overweight
Hispanic

Hispanic/Latino high school students’
obesity rates are three times as high as
those for White high school students
Source: Colorado Youth Risk Behavior Surveillance Survey, 2011
Youth (High School Students)

35

Physical activity

53.1%

of adolescents in
high school met the
recommendation
of physical activity

Percent of adolescents in high school who
met the recommended physical activity by
race/ethnicity, Colorado 2011

56.1%
44.9%

(2011)

The recommendation for physical
activity is at least 60 minutes per day
on at least 5 of the past 7 days

Non-Hispanic White

Hispanic

Source: Colorado Youth Risk Behavior Surveillance Survey, 2011
Overview:

36

 Sociodemographic factors that
 Healthy eating,

Children
(2-14)

influence health

active living data
Youth
(High School)

Adult
(over 18 years old)
Adults (18 and older)

In 2010, in Jefferson County
there were 204,884 adults 18
and older. The population of
adults over 65 was 68,000.

37

204, 884
18 and older
Source: Colorado State Demography Office,2010
Adults (18 and older)
Income

38

Median household income by
race/ethnicity, Jefferson County, 2012

$80,000
Median $67,512

$70,000

Percent

$60,000
$50,000
$40,000
$30,000

$20,000
$10,000
$0
Non-Hispanic White

Hispanic

Black

Since income is directly linked to health, this graph shows income by race/ethnicity in
Jefferson County. Notice that while Non-Hispanic Whites make more than the
median, Hispanic and Blacks fall below the median income level.
The median on this slide is different from the earlier slide where median income was
presented because the data on this slide is from 2012 (the median household income
in 2010 was $63,826).
Source: U.S. Census Bureau, 2012
‹#›
40

Adults (18 and older)
Overweight and Obesity

Percent of adults (18+) who are overweight or obese
(BMI Percent of adults (18+) who are overweight or obese (BMI ≥ 25), Jefferson County, 2001-2010
≥ 25), Jefferson County, 2001-2010
Obese

Overweight

60
2016 Target

50
12.9
14.6

40
Percent

14.9

12.0

35.1

37.6

38.1

2002

2003

2004

18.6

18.9

17.7

17.7

35.3

35.3

35.3

36.2

38.0

2005

2006

2007

2008

2009

14.8

20.4

30
20

40.1

34.4

10
0
2001

2010

Year
Source: Colorado Behavioral Risk Factor Surveillance System, Colorado Department of Public Health and Environment
Adults (18 and older)

41

Obesity

40

Percent of adults (18+) who are obese by
race/ethnicity, Colorado, 2011-2012

35
30
Percent

25
20
15
10
5
0
Non-Hispanic White

Hispanic

Black

We can see in this graph that the income an education data are good predictors of obesity rates among NonHispanic Whites, Hispanics, and Blacks. There is strong correlation between income, education, and health
outcomes. Non-Hispanic Whites have the highest educational attainment and the highest incomes, in turn they
have the best health outcome (lowest obesity rates). The opposite is true for Hispanics and Blacks
Source: Colorado Behavioral Risk Factor Surveillance System, Colorado Department of Public Health and Environment
Adults (18 and older)

42

Physical activity
Percent of adults reporting not engaging in any
leisure time physical activity during the past 30
days, Colorado, 2011-2012
30
25
20
15
10
5
0

Non-Hispanic White

Hispanic

Black

Similar to obesity rates graph on the previous slide, this graph shows that
income an education data are good predictors of health outcomes.

Source: Colorado Behavioral Risk Factor Surveillance System, Colorado Department of Public Health and Environment
Adults (18 and older)

43

Not physically active by
income Percent of adults engaging in no physical activity (2008) by annual
household income, Colorado.

The graph on the left shows
that as income
decreases, the percent of
adults engaging in physical
activity increases. Clearly
showing that there is a strong
relationship between income
and health outcomes.

Source: The Weight of the State: 2009 Report on Overweight and Obesity in Colorado
Overview:
 Sociodemographic factors that
 Healthy eating,

Children
(2-14)

influence health

active living data
Youth
(High School)

 The Social-Ecological Model

Adult
(over 18 years old)
Social-Ecological
Model

45

The Social -Ecological Model
stresses that society is composed of
interconnected elements that
invariably affect one another. The
model is based on the premise that
changes in individual behavior will
come about through a combination
of
societal, community, organizational
, interpersonal, and individual
efforts

Effective prevention initiatives to improve access to healthy foods and
physical activity to reduce obesity, should address multiple levels of the
environment and engage multiple sectors of society in order to affect social
change and achieve health impact.

Source: CDC, http://www.cdc.gov/obesity/downloads/CDC_Healthy_Communities.pdf
Social-Ecological
Model

46

Public Policies like the construction
of parks and bike lanes support
physical activity and active
lifestyles

Activities at the community
level help facilitate individual
behavior change, for
example, media and
advocacy groups can help
promote healthy
eating, active living in the
community

COMMUNITY
ORGANIZATIONAL
RELATIONSHIPS

Organizational changes like
having worksite wellness
programs or providing healthy
school lunches support
individuals to live healthier lives
Relationships with our
friends, family, and health care
providers represent sources of
interpersonal messages and
can help support to healthy
eating and an active lifestyle

Each individual may have different
degrees of access to education, income
and these factors may in turn affect the
individual’s believes and behaviors toward
eating healthier foods and being physically
active.

Health and Socioeconomic Status

  • 1.
    www.healthypeoplehealthyplacesjeffco.com Community Health Improvementplan Work Groups October 22, 2013 Ana Marin Epidemiologist Jefferson County Public Health 1
  • 2.
    2 The objectives ofthis presentation are: • To give an overview of the demographic trends in Jefferson County • Present healthy eating, active living data and their relationship with obesity and chronic disease • The data will be broken into three groups, adults, youth, and children • Finally, discuss how the SocialEcological Model can help address the increase in obesity by improving healthy food access and physical activity
  • 3.
    Overview:  Sociodemographic factorsthat  Healthy eating, active living data Youth Children (2-14) influence health (High School)  The Socio-Ecological Model Adult (over 18 years old)
  • 4.
    4 Sociodemographic Factors Population Population population: 534,543 th Highest countypopulation 45th fastest growth rate (out of 63 counties) Source: U.S. Census Bureau
  • 5.
    5 Sociodemographic Factors Population 2010 2000 90 years& over Males Females 85 to 89 years 80 to 84 years 75 to 79 years 70 to 74 years 65 to 69 years These population pyramids show the changes in population over the ten year period in Jefferson County from 2000 to 2010 by age groups and gender 60 to 64 years 55 to 59 years Age group 50 to 54 years 45 to 49 years 40 to 44 years 35 to 39 years 30 to 34 years 25 to 29 years 20 to 24 years 15 to 19 years 10 to 14 years 5 to 9 years Under 5 years 5 4 3 2 1 0 1 2 3 4 5 Percentage in age group from total population Source: U.S. Census Bureau
  • 6.
    6 Sociodemographic Factors Population 118, 754 Childrenunder 18 68, 000 Adults 65 and older Age is an important factor for health, therefore, it is important to consider age groups in Jefferson county when we think about how to increase healthy food access and physical activity in our community. Having a healthy population is important to the vitality and economic success of our county. Source: Colorado State Demography Office,2010
  • 7.
    7 Sociodemographic Factors Population byrace/ethnicity Population Distributionor Latino by Race andHispanic BlackJefferson County, 2000 and 2010 Ethnicity, Hispanic Non Non Hispanic Asian Other Population Distribution by Race and Ethnicity, Jefferson County, 2000 and 2010 Non Hispanic White 2.2% 2.3% 0.9% 10.0% 2.3% 2.6% 0.9% Other Asian Black Other Asian Black 14.3% These graphs show the race and ethnic distribution in Jefferson county comparing data from 2000 to 2010 84.9% 2000 79.9% 2010 Source: U.S. Census Bureau 2000, 2010
  • 8.
    8 Sociodemographic Factors Population byrace/ethnicity Population Distribution by Race and Ethnicity, Jefferson County, 2000 and 2010 Non Hispanic Asian Other Non Hispanic White Hispanic or Latino Non Hispanic Population Distribution by Race and Ethnicity, Jefferson County, 2000 and 2010 Black 2.2% 2.3% 0.9% 10.0% 84.9% 2000 2.3% 2.6% 0.9% Other Asian Black 14.3% Other The Asian Hispanic/Latino Black Population grew 30% in 10 years 79.9% 2010 Source: U.S. Census Bureau
  • 9.
    9 Sociodemographic Factors Educational attainment Lessthan 9th grade, 2.0% 9th to 12th grade, no diploma, 4.7% Graduate or professional degree, 14.4% High school graduate (includes equivalency), 22.2% Bachelor's degree, 26.40% Some college, no degree, 22.7% Associate's degree, 7.50% 48.3% of Jefferson County residents over 25 have completed an associate’s degree or higher education 6.7% of Jefferson County residents over 25 did not received a High School diploma, or equivalent *Adults 25 and older Source: U.S. Census Bureau
  • 10.
    10 Sociodemographic Factors Education andIncome The map on the left shows the areas of the county where a higher percent of the population did not graduate from high school, the darker the blue on the map the more people who live in those areas that did not graduate from high school. The map on the right shows family poverty level, the darker the blue, the more families living under poverty live in those areas of the county. These maps clearly show that educational attainment is directly related to income. Source: U.S. Census Bureau, 2010 American Community Survey
  • 11.
    11 Sociodemographic Factors Education andIncome Percent of the population living below 125% of poverty by race/ethnicity , Jefferson County, 2012 25% 20% 15% 10% 5% 0% Hispanic (of any race) Non-Hispanic White Source: U.S. Census Bureau, 2012 American Community Survey
  • 12.
    12 Sociodemographic Factors Food deserts Fooddeserts low-income areas where a significant number of residents live “far” from a super market. What is "far“? More than .5 mile for urban areas or 10 miles for rural areas from the nearest supermarket Source: United States Department of Agriculture, Accessed, October 2013
  • 13.
    13 Sociodemographic Factors Food deserts DENVER JEFFCO Theorange squares on the map represent food deserts by Census Tract. Keep in mind that some people and places, especially those with lowincome, may face greater barriers in accessing healthy and affordable food retailers, which may negatively affect diet and food security. Source: United States Department of Agriculture, Accessed, October 2013
  • 14.
    14 Sociodemographic Factors Income Median householdIncome $63,826 Household income includes the income of the householder and all other individuals 15 years old and over in the household, whether they are related to the householder or not. Source: U.S. Census Bureau
  • 15.
    15 Sociodemographic Factors Income How muchdoes it cost to live in Jeffco? Family of 4: 2 adults 1 preschooler 1 school-age child
  • 16.
    16 Sociodemographic Factors Income How muchdoes it cost to live in Jeffco? $62,952* The $62,952 annual income is for a family of four with two adults, one preschooler, and one school-age child. This annual income was calculated using the Self-Sufficiency Standard which defines the income realistically needed to support a family, without public or private assistance. Source: *Colorado Center on Law and Policy, The Self-Sufficiency Standard for Colorado, 2011
  • 17.
    17 Sociodemographic Factors Income How muchdoes it cost to live in Jeffco? $62,952* $7.78 Minimum Wage Both parents working 40hrs/wk • No days off • No holidays Let’s think about a family in which both parents work full time, make minimum wage, and take no days off or holidays. What would be their combined annual gross income? Source: *Colorado Center on Law and Policy, The Self-Sufficiency Standard for Colorado, 2011
  • 18.
    18 Sociodemographic Factors Income How muchdoes it cost to live in Jeffco? $62,952* $7.78 Minimum Wage Both parents working 40hrs/wk • No days off • No holidays $32,365 Let’s think about a family in which both parents work full time, make minimum wage, and take no days off or holidays. What would be their combined annual gross income? The combined annual gross income would be about half of the Self Sufficiency Standard Source: *Colorado Center on Law and Policy, The Self-Sufficiency Standard for Colorado, 2011
  • 19.
    19 Sociodemographic Factors Income How muchdoes it cost to live in Jeffco? * $62,952 $7.78 Minimum Wage Both parents working 40hrs/wk • No days off • No holidays $32,365 This is roughly HALF of what is needed It was calculated that in Jefferson County for this family to meet the Self Sufficiency Standard, the minimum wage should be $14.90 $14.90 Self-sufficient Wage Source: *Colorado Center on Law and Policy, The Self-Sufficiency Standard for Colorado, 2011
  • 20.
    20 Sociodemographic Factors Social determinantsof health From the data on the previous slides we learned that the more education an individuals have, the higher the income they will make, and in turn the better their health
  • 21.
    21 Sociodemographic Factors Income andhealth There is a strong relationship between income and health outcomes
  • 22.
    22 Sociodemographic Factors Income andhealth Obesity and hypertension rates among adults by income, Jefferson County, 2009-2010 35 32.3 27.0 30 24.7 Percent 25 20 19.1 18.6 20 15 10 5 0 <$25,000 $25,000-49,999 ≥$50,000 Obesity Hypertension This graph shows the percent of obesity and hypertension by income. Notice that the lowest income bracket has the highest obesity rate and the largest percent of adults who have ever been told by a doctor, nurse, or other health professional that they have high blood pressure. In turn the highest income bracket has the lowest percent. Source: Colorado Behavioral Risk Survey, 2009-2010
  • 23.
    Overview: 23  Sociodemographic factorsthat  Healthy eating, Children (2-14) influence health active living data Youth (High School) Adult (over 18 years old)
  • 24.
    Children (2-14) In 2010,in Jefferson County there were 85,339 children between the ages of 2-14 years old. 24 85,339 children 8.2% of population Source: Colorado State Demography Office,2010
  • 25.
    25 Children (2-14) Population characteristics Percentof children under 18 living in families with income below poverty level, Jefferson County, 2006-2011 16 14 Percent 12 10 8 6 4 2 0 2006 There has been a steady increase of poverty levels in Jefferson among families with children under 18 2007 2008 2009 2010 2011 Data Source: U.S. Census Bureau, Small Area Income and Poverty Estimates (SAIPE)
  • 26.
    26 Children (2-14) Overweight andobesity by race/ethnicity Overweight and obesity among children 2-14 by parentreported race/ethnicity, Colorado, 2004-2008 The obesity rates for Black and Hispanic children is two times the rate of their White counterparts Source: The Weight of the State: 2009 Report on Overweight and Obesity in Colorado
  • 27.
    27 Children (2-14) Fruit andvegetable, and fast food consumption Fruit and vegetable and fast food consumption among children by age group, Colorado 2006-2008 As children get older, their consumption of fruits and vegetables decreases meanwhile their consumption of fast food increases Source: The Weight of the State: 2009 Report on Overweight and Obesity in Colorado
  • 28.
    Children (2-14) 28 Free andreduced lunch (all grades) of schools in Jeffco at least 3 out of 5 students qualify for free or reduced lunch. In other words, in 32 schools out of 145, more than 60% of students qualified for free or reduce lunch. (Oct 2013) In 2012, 34% of students in Jeffco qualified to receive free or reduced lunch (this is an average of all schools in the district). (Oct 2013) Source: Jeffco Public Schools
  • 29.
    Children (2-14) 29 Food insecurity Noticethat this is the number of SNAP cases not the number of individuals. Open SNAP cases in Jeffco (September 2013) Keep in mind that the WIC program is for children under the age of 5 Children in Jeffco received vouchers (2011) Source: Hunger Free Colorado, 2013 Kids Count in Colorado Report
  • 30.
    Children (2-14) 30 Food insecurity 35.4% ofparents reported often or sometimes relied on low-cost food to feed their children because they were running out of money to buy food. (2012 data) Source: Colorado Child Health Survey, Colorado Department of Public Health and Environment
  • 31.
    Overview: 31  Sociodemographic factorsthat  Healthy eating, Children (2-14) influence health active living data Youth (High School) Adult (over 18 years old)
  • 32.
    Youth (High School 32 Students) In2010, in Jefferson County there were 35,727 young adults between the ages of 14-18. Notice that the data presented for youth is collected in High School and may mean that those who participated might have been younger than 14 and/or older than 18 at the time of the health survey 35,724 ages 14-18 Source: Colorado State Demography Office,2010
  • 33.
    33 Youth (High School Students) Highschool graduation rates High school graduation rates by race/ethnicity, Jefferson County, 2010-2011 100 89.0 90 80 79.1 73.1 70 Rate 83.1 64.8 61.8 60 50 40 30 20 10 0 District Non-Hispanic White Hispanic Black Asian American Indian or Alaska Native Although high school graduation rates in Jefferson County are high, the graduation rates vary depending on the race/ethnicity of the students. White students have the highest graduation rates while American Indian/Alaska Native students have the lowest. This is important to health because educational attainment is directly related to income and income is related to health. Source: Colorado Department of Education
  • 34.
    Youth (High SchoolStudents) 34 Percent Overweight and Obesity by race/ethnicity Students Students in grades 9-129-12 overweight are overweight or obese by in grades who are who or obese by race/ethnicity, Colorado, 2011 race/ethnicity, Colorado, 2011 18 16 14 12 10 8 6 4 2 0 17% 15% 8% 5% Obese Non-Hispanic White Overweight Hispanic Hispanic/Latino high school students’ obesity rates are three times as high as those for White high school students Source: Colorado Youth Risk Behavior Surveillance Survey, 2011
  • 35.
    Youth (High SchoolStudents) 35 Physical activity 53.1% of adolescents in high school met the recommendation of physical activity Percent of adolescents in high school who met the recommended physical activity by race/ethnicity, Colorado 2011 56.1% 44.9% (2011) The recommendation for physical activity is at least 60 minutes per day on at least 5 of the past 7 days Non-Hispanic White Hispanic Source: Colorado Youth Risk Behavior Surveillance Survey, 2011
  • 36.
    Overview: 36  Sociodemographic factorsthat  Healthy eating, Children (2-14) influence health active living data Youth (High School) Adult (over 18 years old)
  • 37.
    Adults (18 andolder) In 2010, in Jefferson County there were 204,884 adults 18 and older. The population of adults over 65 was 68,000. 37 204, 884 18 and older Source: Colorado State Demography Office,2010
  • 38.
    Adults (18 andolder) Income 38 Median household income by race/ethnicity, Jefferson County, 2012 $80,000 Median $67,512 $70,000 Percent $60,000 $50,000 $40,000 $30,000 $20,000 $10,000 $0 Non-Hispanic White Hispanic Black Since income is directly linked to health, this graph shows income by race/ethnicity in Jefferson County. Notice that while Non-Hispanic Whites make more than the median, Hispanic and Blacks fall below the median income level. The median on this slide is different from the earlier slide where median income was presented because the data on this slide is from 2012 (the median household income in 2010 was $63,826). Source: U.S. Census Bureau, 2012
  • 39.
  • 40.
    40 Adults (18 andolder) Overweight and Obesity Percent of adults (18+) who are overweight or obese (BMI Percent of adults (18+) who are overweight or obese (BMI ≥ 25), Jefferson County, 2001-2010 ≥ 25), Jefferson County, 2001-2010 Obese Overweight 60 2016 Target 50 12.9 14.6 40 Percent 14.9 12.0 35.1 37.6 38.1 2002 2003 2004 18.6 18.9 17.7 17.7 35.3 35.3 35.3 36.2 38.0 2005 2006 2007 2008 2009 14.8 20.4 30 20 40.1 34.4 10 0 2001 2010 Year Source: Colorado Behavioral Risk Factor Surveillance System, Colorado Department of Public Health and Environment
  • 41.
    Adults (18 andolder) 41 Obesity 40 Percent of adults (18+) who are obese by race/ethnicity, Colorado, 2011-2012 35 30 Percent 25 20 15 10 5 0 Non-Hispanic White Hispanic Black We can see in this graph that the income an education data are good predictors of obesity rates among NonHispanic Whites, Hispanics, and Blacks. There is strong correlation between income, education, and health outcomes. Non-Hispanic Whites have the highest educational attainment and the highest incomes, in turn they have the best health outcome (lowest obesity rates). The opposite is true for Hispanics and Blacks Source: Colorado Behavioral Risk Factor Surveillance System, Colorado Department of Public Health and Environment
  • 42.
    Adults (18 andolder) 42 Physical activity Percent of adults reporting not engaging in any leisure time physical activity during the past 30 days, Colorado, 2011-2012 30 25 20 15 10 5 0 Non-Hispanic White Hispanic Black Similar to obesity rates graph on the previous slide, this graph shows that income an education data are good predictors of health outcomes. Source: Colorado Behavioral Risk Factor Surveillance System, Colorado Department of Public Health and Environment
  • 43.
    Adults (18 andolder) 43 Not physically active by income Percent of adults engaging in no physical activity (2008) by annual household income, Colorado. The graph on the left shows that as income decreases, the percent of adults engaging in physical activity increases. Clearly showing that there is a strong relationship between income and health outcomes. Source: The Weight of the State: 2009 Report on Overweight and Obesity in Colorado
  • 44.
    Overview:  Sociodemographic factorsthat  Healthy eating, Children (2-14) influence health active living data Youth (High School)  The Social-Ecological Model Adult (over 18 years old)
  • 45.
    Social-Ecological Model 45 The Social -EcologicalModel stresses that society is composed of interconnected elements that invariably affect one another. The model is based on the premise that changes in individual behavior will come about through a combination of societal, community, organizational , interpersonal, and individual efforts Effective prevention initiatives to improve access to healthy foods and physical activity to reduce obesity, should address multiple levels of the environment and engage multiple sectors of society in order to affect social change and achieve health impact. Source: CDC, http://www.cdc.gov/obesity/downloads/CDC_Healthy_Communities.pdf
  • 46.
    Social-Ecological Model 46 Public Policies likethe construction of parks and bike lanes support physical activity and active lifestyles Activities at the community level help facilitate individual behavior change, for example, media and advocacy groups can help promote healthy eating, active living in the community COMMUNITY ORGANIZATIONAL RELATIONSHIPS Organizational changes like having worksite wellness programs or providing healthy school lunches support individuals to live healthier lives Relationships with our friends, family, and health care providers represent sources of interpersonal messages and can help support to healthy eating and an active lifestyle Each individual may have different degrees of access to education, income and these factors may in turn affect the individual’s believes and behaviors toward eating healthier foods and being physically active.

Editor's Notes

  • #3 (Ana)
  • #4 Sociodemographic factors a.k.a. SOCIAL DETERMINANTS OF HEALTH
  • #7 Children under 18 are 22.1% of populationAdults 65 and over 12.6%Adults 46-64157, 695Adults 31-45105, 594Adults 18-3085, 481
  • #8 Now, let’s look at how it compares to 2010, notice that the distribution of Blacks, Asians, and those who were classified as “other” did not change much over the 10 year period
  • #9 However, the Hispanic population grew 30%
  • #10 In 2010 population was 534, 5436.83%=35, 800 people48.3% = 258184.269 people
  • #13 Limited access to supermarkets, supercenters, grocery stores, or other sources of healthy and affordable food may make it harder for some Americans to eat a healthy diet.  Expanding the availability of nutritious and affordable food by developing and equipping grocery stores, small retailers, corner markets and farmers’ markets in communities with limited access is an important part of addressing the disparities.This map shows food deserts: food deserts—low-income areas where a significant number or share of residents is far from a supermarket, where &quot;far&quot; is more than .5 mile in urban areas and more than 10 miles in rural areas, from the nearest supermarket
  • #14 Limited access to supermarkets, supercenters, grocery stores, or other sources of healthy and affordable food may make it harder for some Americans to eat a healthy diet.  Expanding the availability of nutritious and affordable food by developing and equipping grocery stores, small retailers, corner markets and farmers’ markets in communities with limited access is an important part of addressing the disparities.This map shows food deserts: food deserts—low-income areas where a significant number or share of residents is far from a supermarket, where &quot;far&quot; is more than .5 mile in urban areas and more than 10 miles in rural areas, from the nearest supermarket EXPLAIN WHAT THE ORANGE MEANS
  • #15 Median household income in 2010Side note in case of being asked:Household income is often the combination of two income earners pooling the resources and should therefore not be confused with an individual&apos;s earnings.
  • #17 Annual living cost-based on the Colorado Center for Law and Policy Self-Sufficency standard that defines the income that is realistically needed to support a family without public or private assistance A family of 2 adults and 1 preschool age child YOU CAN ELIMINATE THIS SLIDE AND REFERENCE THE INFORMATION ON THE NEXT ONE.
  • #18 Annual living cost-based on the Colorado Center for Law and Policy Self-Sufficency standard that defines the income that is realistically needed to support a family without public or private assistance A family of 2 adults and 1 preschool age child
  • #19 Let’s think about this.
  • #20 Let’s think about this.$32, 365 is their gross income, before taxes
  • #24 Sociodemographic factors a.k.a. SOCIAL DETERMINANTS OF HEALTH
  • #25 In Jefferson County there are 118, 754 children under 18. the data for this population will be presented broken down by children 2-14 and high school students so roughly those ages 14 to about 18 years old. So for the children data I’m about to present, it is important to note that in Jeffco, 85, 339 children are age 2-14, this is 8.2% of the total population
  • #26 POVERTY:Definitions: Percent and number of children under age 18 living in families with incomes below poverty level. Data Source: U.S. Census Bureau, Small Area Income and Poverty Estimates (SAIPE) Footnotes: Note:  SAIPE changed methodology in 2005, hence no data before 2005 was included.  Trends are not recommended across this point in time.
  • #27 10.9% of non-hispanic white children were obese, Meanwhile Blacks and hispanics had a rate of 20+% this is 2x as high
  • #29 Free and reduce lunch, 60% or more qualify
  • #31 In 2012, 35.4% of parents of children 2-14 relied on low cost food to feed their children because they were running out of money to buy food
  • #32 Sociodemographic factors a.k.a. SOCIAL DETERMINANTS OF HEALTH
  • #33 The graduation rate is ________
  • #34 Jefferson County’s school district is one of the 50 largest school districts in the nation.has a graduation rate of 79.1%, it is
  • #35 ALL students obesity 7.3ALL Students overweight 10.715% of Hispanic/Latino Students are obese this is 3X the are among White Students.17% of Hispanics are overweight, more than twice the rate among White studentsNOTE ABOUT DATA- IT CAME FROM THE HEALTH DISPARITIES REPORT, 2013
  • #36 53.1% for all races
  • #37 Sociodemographic factors a.k.a. SOCIAL DETERMINANTS OF HEALTH
  • #39 Median Income 67512
  • #41 (Ana)
  • #44 Some people they’re poor because they are lazy our data doesn’t support this, many of these people have more than 1 job.
  • #45 Sociodemographic factors a.k.a. SOCIAL DETERMINANTS OF HEALTH