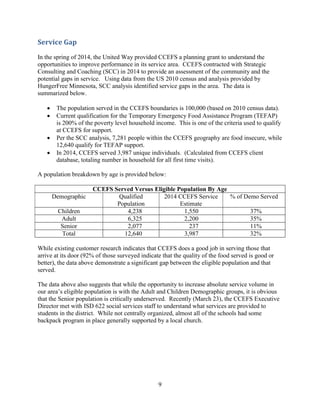
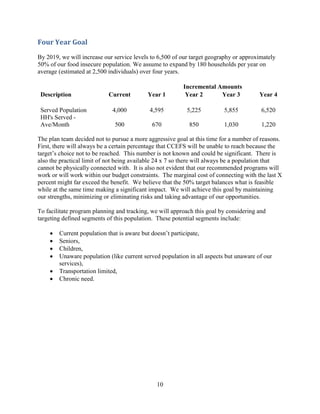
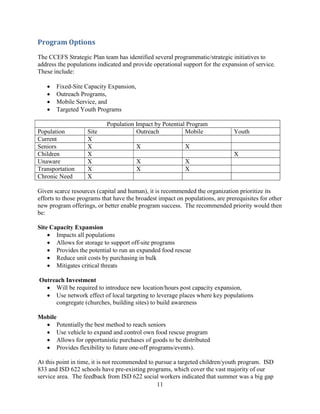
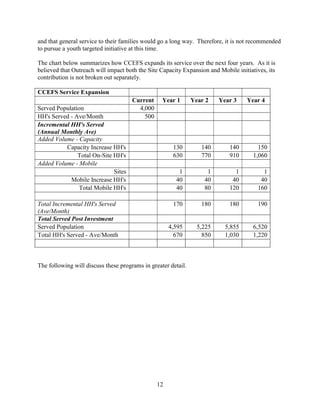
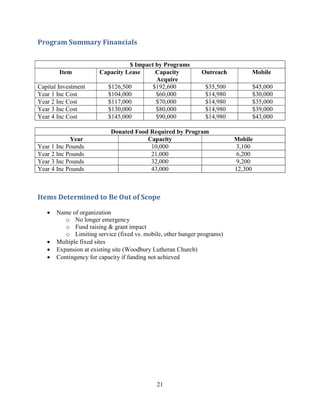
For Period:
2016 to 2020
Completed:
April 17, 2015
Last Reviewed:
April 17, 2015
2
Table of Contents
Introduction..................................................................................................................................... 3
CCEFS Vision, Mission & Values.................................................................................................. 3
Background..................................................................................................................................... 4
Risks and Opportunities.................................................................................................................. 8
Service Gap..................................................................................................................................... 9
Four Year Goal ............................................................................................................................. 10
Program Options........................................................................................................................... 11
Site Capacity Expansion ............................................................................................................... 13
Outreach........................................................................................................................................ 17
Mobile........................................................................................................................................... 19
Program Summary Financials....................................................................................................... 21
Items Determined to Be Out of Scope.......................................................................................... 21
Funding Strategy........................................................................................................................... 22
Attachment A – Model Assumptions............................................................................................ 24
Attachment B – Financial Model Program Expense Impact Capacity & Mobile......................... 25
Attachment C – Outreach Program Financial Impact................................................................... 26
3
Introduction
In 2014, CCEFS received a planning grant from the United Way to perform a community
assessment. Strategic Consulting & Coaching (SCC) was hired to do the analysis which
included an analysis of Hunger Free Minnesota’s Missing Meal study as well as key constituency
interviews and customer surveys. The results were presented in June of 2014 to the CCEFS
board. Subsequently, the CCEFS board decided to defer any planning action to address the
concerns, suggestions and options identified in this assessment until a new board was in place in
January 2015. In the January 20, 2015 board meeting, the Executive Director was charged to
create a Strategic Planning Committee with the charter to address the issues identified in the June
2014 community assessment as part of building a strategic plan. Members included Greig
Metzger (Executive Director); Sue Gillman (volunteer), John Donofrio (volunteer), Brandon
Bellin (donor) and Peter Bloomquist (board member). The output of this committee follows.
CCEFS Vision, Mission & Values
Vision
We envision a community in which everyone has access to sufficient nutritious
food.
Mission
Our mission is to provide nutritious food and personal care items to people in our
community in a dignified manner, while fighting to eliminate hunger.
Values
We believe that access to nutritious food is a basic human right. We are
committed to responding to the needs of our community by providing food
distribution and support services with dignity and respect.
4
Background
Helping Those in Need
The Christian Cupboard Emergency Food Shelf (CCEFS) provides food, personal care items and
access to other resources to help those in need in the communities of Woodbury, Oakdale,
Landfall and south Maplewood. Households can be confronted with loss of income, or increased
expenses that puts a family in financial distress. Our goal is to provide food for those families in
this type of situation.
About Us
Recognized by the Woodbury Area Chamber of Commerce as the 2013 non-profit of the year,
CCEFS was formed as a non-profit organization by seven Woodbury area churches in 1983.
Woodbury Lutheran Church made space available to house CCEFS and has remained our host
church ever since.
CCEFS is a registered nonprofit 501(c)3 corporation with
the Internal Revenue Service and all donations are tax
deductible for contributors. We operate with an
Executive Director, an Operations Manager, and
volunteer staff. The Board of Directors consists of
representatives from the communities we serve. We are
supported by the area’s faith community, civic
organizations, local businesses, individual donors as well
as a small group of charitable foundations.
Our service area includes 22 census tracts defined by the
city boundaries of Oakdale, Woodbury, and Landfall and
in Maplewood by the area bounded to the north by
Stillwater Avenue / Road (Route 5), to the east by
Century Avenue and the west by the east side of
McKnight Road. According to Hunger Free Minnesota
and the 2010 census, there were 99,799 food insecure
people in our service area.
Service Statistic Summary
In the first year of operation, an average of 5 households came to CCEFS each week to obtain
assistance. Today, as many as 125 households or more are served each week and October 2014
marked a new monthly service peak of over 600 households served. For the year, CCEFS served
5,977 households in 2014. This represents a 12% increase versus 2013.
5
CCEFS 2014 Service Summary Statistics
Service Metric Quantity
Total Households Served 5,977
Unique Households Served 1,302
Total Individuals Served 20,656
Segment Breakdown Quantity % of Total
Ages 0-17 8,282 40%
Ages 18-64 10,916 53%
Ages 65+ 1,453 7%
On average, each client household receives 82 pounds of food. This is a mixture of shelf-stable
items (purchased and donated) as well as purchased dairy, and food rescue including dairy,
bakery, deli, produce and frozen proteins (beef, chicken, fish, pork and lamb). In 2014, CCEFS
distributed 490,000 pounds of food and personal care products.
In 2014, the average
household visited CCEFS
4.2 times in a year. The
majority (56%) of our client
households visit us 3 times
a year or less.
During Q4 2014, we saw a
significant increase in the
number of days that our
clients experienced long
wait lines and rushed
service. One of our core
values is to provide each client with a great shopping experience. Our ability to continue to
provide this level of service is at risk with our current volume and observed growth trends. Our
efforts to increase the population we serve will only aggravate this issue.
8%
0% 0%
8% 8% 8% 8%
0%
17% 14%
50%
73%
Jan Feb Mar Apr May Jun Jul Aug Sep Oct Nov Dec
Percent of Days per Month Over
Service Capacity
0%
10%
20%
30%
40%
1 2 3 4 5 6 7 8 9 10 11 12
%ofHH's
# of Visits in 2014
% HH's Annual Visit Frequency
6
Serve Area Demographics & Trends
Population in our service area has grown significantly since 1960. That trend is expected to
continue. In the 2013 Washington County HRA study, the combined population of the two cities
of Oakdale and Woodbury are expected to grow 15.5% by 2020 to 106,450. This is 38% of the
total Washington County forecast population.
While the ethnicity of our service area is primarily Caucasian (~80%), the Woodbury and
Oakdale area have the most ethnically diverse populations of any of the Washington County
cities.
Race % of City’s Total Population (2010)
Woodbury Oakdale
White Alone 81.4 81.1
Black or African American 5.6 5.9
Native American 0.3 0.5
Asian 9.1 8.0
Other/2 or More Races 3.6 4.5
Based on Metro Council and US
Census data, the growth in non-
white populations is expected to
continue.
7
The other key demographic trend identified is the increase in the senior population not only in
the state but in our area. Children under the age of 18 make up 27% of our population while
seniors over the age of 65 make up 10%. The U.S. Census Bureau projects the number of
seniors in Minnesota will begin surpassing the number of children by 2020. Washington County
(WCHRA 2013) forecasts a 29% increase in the 65+ population in Woodbury (versus an overall
growth rate of 17%) with a 20% increase in this population in Oakdale (versus an overall growth
rate of 7%).
8
Risks and Opportunities
The following SWOT analysis identifies CCEFS’s current positioning.
Strengths
 Shopping Experience
o Choice Model
o Walk-In
 Rank & File Volunteers
 Ease of Access (By Car)
 Amount of Food Provided
 Quality of Food
 Customers Treated with Dignity &
Respect
Weaknesses
 Wait Time
 Inflexible Store Days & Hours
 Nutritional Choices
 Facilities Layout & Available Space
 Lack of Loading Dock
 Community Awareness
o Customers
o Supporters
 Ethnic Ease of Use
 Lack of Staff Depth
 Narrow Donation & Support base
o Faith Community
o Individuals
 Technology – Data Capture
Opportunities
 Additional Community Support
o Business Community
o Individual Donors
o Foundation Support
 New Distribution Programs
o Mobile Program
o Kids Packs
o Seniors
 Outreach
 Expand Partner Relationships
 Expand – Better Optimize Hours
Open
Threats
 2nd Harvest Policy Changes
 Hit Capacity Before Ready
 Inhospitable Work Environment
o Volunteer Comfort
o Work place safety
 Financial Cushion
 Financial Stress of Area Food
Shelves
 Gifted Space
o WLC
o 3M
 Dependence on Volunteer Workforce
9
Service Gap
In the spring of 2014, the United Way provided CCEFS a planning grant to understand the
opportunities to improve performance in its service area. CCEFS contracted with Strategic
Consulting and Coaching (SCC) in 2014 to provide an assessment of the community and the
potential gaps in service. Using data from the US 2010 census and analysis provided by
HungerFree Minnesota, SCC analysis identified service gaps in the area. The data is
summarized below.
 The population served in the CCEFS boundaries is 100,000 (based on 2010 census data).
 Current qualification for the Temporary Emergency Food Assistance Program (TEFAP)
is 200% of the poverty level household income. This is one of the criteria used to qualify
at CCEFS for support.
 Per the SCC analysis, 7,281 people within the CCEFS geography are food insecure, while
12,640 qualify for TEFAP support.
 In 2014, CCEFS served 3,987 unique individuals. (Calculated from CCEFS client
database, totaling number in household for all first time visits).
A population breakdown by age is provided below:
CCEFS Served Versus Eligible Population By Age
Demographic Qualified
Population
2014 CCEFS Service
Estimate
% of Demo Served
Children 4,238 1,550 37%
Adult 6,325 2,200 35%
Senior 2,077 237 11%
Total 12,640 3,987 32%
While existing customer research indicates that CCEFS does a good job in serving those that
arrive at its door (92% of those surveyed indicate that the quality of the food served is good or
better), the data above demonstrate a significant gap between the eligible population and that
served.
The data above also suggests that while the opportunity to increase absolute service volume in
our area’s eligible population is with the Adult and Children Demographic groups, it is obvious
that the Senior population is critically underserved. Recently (March 23), the CCEFS Executive
Director met with ISD 622 social services staff to understand what services are provided to
students in the district. While not centrally organized, almost all of the schools had some
backpack program in place generally supported by a local church.
10
Four Year Goal
By 2019, we will increase our service levels to 6,500 of our target geography or approximately
50% of our food insecure population. We assume to expand by 180 households per year on
average (estimated at 2,500 individuals) over four years.
Incremental Amounts
Description Current Year 1 Year 2 Year 3 Year 4
Served Population 4,000 4,595 5,225 5,855 6,520
HH's Served -
Ave/Month 500 670 850 1,030 1,220
The plan team decided not to pursue a more aggressive goal at this time for a number of reasons.
First, there will always be a certain percentage that CCEFS will be unable to reach because the
target’s choice not to be reached. This number is not known and could be significant. There is
also the practical limit of not being available 24 x 7 so there will always be a population that
cannot be physically connected with. It is also not evident that our recommended programs will
work or will work within our budget constraints. The marginal cost of connecting with the last X
percent might far exceed the benefit. We believe that the 50% target balances what is feasible
while at the same time making a significant impact. We will achieve this goal by maintaining
our strengths, minimizing or eliminating risks and taking advantage of our opportunities.
To facilitate program planning and tracking, we will approach this goal by considering and
targeting defined segments of this population. These potential segments include:
 Current population that is aware but doesn’t participate,
 Seniors,
 Children,
 Unaware population (like current served population in all aspects but unaware of our
services),
 Transportation limited,
 Chronic need.
11
Program Options
The CCEFS Strategic Plan team has identified several programmatic/strategic initiatives to
address the populations indicated and provide operational support for the expansion of service.
These include:
 Fixed-Site Capacity Expansion,
 Outreach Programs,
 Mobile Service, and
 Targeted Youth Programs
Population Impact by Potential Program
Population Site Outreach Mobile Youth
Current X
Seniors X X X
Children X X
Unaware X X X
Transportation X X X
Chronic Need X
Given scarce resources (capital and human), it is recommended the organization prioritize its
efforts to those programs that have the broadest impact on populations, are prerequisites for other
new program offerings, or better enable program success. The recommended priority would then
be:
Site Capacity Expansion
 Impacts all populations
 Allows for storage to support off-site programs
 Provides the potential to run an expanded food rescue
 Reduce unit costs by purchasing in bulk
 Mitigates critical threats
Outreach Investment
 Will be required to introduce new location/hours post capacity expansion,
 Use network effect of local targeting to leverage places where key populations
congregate (churches, building sites) to build awareness
Mobile
 Potentially the best method to reach seniors
 Use vehicle to expand and control own food rescue program
 Allows for opportunistic purchases of goods to be distributed
 Provides flexibility to future one-off programs/events).
At this point in time, it is not recommended to pursue a targeted children/youth program. ISD
833 and ISD 622 schools have pre-existing programs, which cover the vast majority of our
service area. The feedback from ISD 622 social workers indicated that summer was a big gap
12
and that general service to their families would go a long way. Therefore, it is not recommended
to pursue a youth targeted initiative at this time.
The chart below summarizes how CCEFS expands its service over the next four years. As it is
believed that Outreach will impact both the Site Capacity Expansion and Mobile initiatives, its
contribution is not broken out separately.
CCEFS Service Expansion
Current Year 1 Year 2 Year 3 Year 4
Served Population 4,000
HH's Served - Ave/Month 500
Incremental HH's Served
(Annual Monthly Ave)
Added Volume - Capacity
Capacity Increase HH's 130 140 140 150
Total On-Site HH's 630 770 910 1,060
Added Volume - Mobile
Sites 1 1 1 1
Mobile Increase HH's 40 40 40 40
Total Mobile HH's 40 80 120 160
Total Incremental HH's Served
(Ave/Month)
170 180 180 190
Total Served Post Investment
Served Population 4,595 5,225 5,855 6,520
Total HH's Served - Ave/Month 670 850 1,030 1,220
The following will discuss these programs in greater detail.
13
Site Capacity Expansion
Proposed Solution:
Expand square footage available to food shelf and address facility challenges.
Background:
Woodbury Lutheran Church has generously donated our space since CCEFS’ inception. While
this arrangement has worked well to date, it provides a number of constraints:
1. Floor Space – We are limited to 1,500 square feet of floor space (900 for shopping and
600 for dry storage) in the basement of the church that is secure. This limits the number
of shoppers we can reasonably have to 12 per hour. It also limits the amount of inventory
we can keep on hand and requires that any donations be processed immediately so they
do not interfere with the flow of our clients.
2. Service Hours – Woodbury Lutheran Church is extremely well scheduled. This means
we are restricted to our current 12 ½ hours of operation per week:
Monday: 12:00 pm - 4:00 pm
Thursday: 3:00 pm - 7:00 pm
Friday: 9:00 am - 1:30 pm
3. Lack of Loading Dock – The space we are using was not originally intended to serve as a
food shelf. It does not have a loading dock or double doors. This means volunteers
cannot bring supplies into the food shelf on pallets. They are required to carry everything
in by hand and they are exposed to the elements.
4. No Garage Door Entry – If we pursue a truck to support our operations, we do not have a
secure location to park it. A facility with a garage would allow us to load/unload the
truck out of the elements.
As previously mentioned, we saw a significant increase in Q4 2014 in the number of days each
week that we exceeded planned capacity. Our clients experienced long wait times. One of our
key strengths is our great shopping experience. Our ability to continue to provide this level of
service is at risk with our current volume. Any effort to increase the population we serve will
only exasperate this issue.
SWOT Impact:
Mitigate a number of threats, including gifted space, inhospitable work environment, and
capacity constraints as well as some of the weaknesses of operation including facilities layout,
lack of loading dock, and inflexible service hours. Expanded capacity will reinforce our existing
strengths of quality service, generous distribution amounts, and respectful atmosphere.
14
Target:
Expanded capacity will allow us to improve service across all populations with the exception of
those that are unaware of our services. While not directly impacted, our ability to deliver on a
mobile solution to those in need of transportation will be enhanced by a facility that will allow
for staging, bulk purchase storage, and large volunteer groups.
Strategy:
Relocate existing operation to a new CCEFS controlled facility (purchase or rent) that provides a
better physical plant for service enhancements, capacity to expand (both space and service
hours), and features to improve unit cost performance and work environment. While there may
be an opportunity to secure a smaller space and then operate 2 locations (the existing facility at
the Woodbury Lutheran Church and a new location), it would potentially require duplicative
staffing (paid and volunteer) and management resources. Also, a 2-location strategy that would
incorporate Woodbury Lutheran space would logically require that the new site be in Oakdale to
best serve our customers.
Tactics:
 Identify 6,000 – 7,000 square feet of showroom/warehouse space (or equivalent) in
Woodbury or Oakdale. While there are no operational issues with an Oakdale location,
there is a potential risk to future support (financial and volunteer) if there isn’t some
physical service site in Woodbury.
 Key attributes include:
o Wide door for access (or ability to install)
o Loading dock or inside garage door access or both (necessity for unloading
delivery trucks
o Minimum 18 feet high
o ADA accessible
o Provide for 2 high rack storage
 Secure sufficient refrigerator and freezer storage capacity as well as staging and dry
storage
 Provide administrative space for 3 Intake, 1 Food Shelf Coordinator, ED, conference
room and customer waiting area
Impact:
 130 – 150 incremental households per year
 Grow service from 500 HH’s per month average to 1,060 HH’s per month average
 After 4 years and assuming that our service goal is reached, the operation would still only
be at 75% of capacity, providing room for continued growth.
15
Financial Summary:
Top-level, summary numbers are presented here. Please see appendices for detailed assumptions
and financial model.
Lease Option:
 Capital investment of $126,500
 Annual cash cost increase (assumes core expenses not impacted):
o Year 1 - $104,000
o Year 2 - $117,000
o Year 3 - $130,000
o Year 4 - $145,000
Acquire Option:
 Capital investment of $192,600 (Assumes financing 75% of purchase & buildout cost)
 Annual cash cost increase (assumes core expenses not impacted):
o Year 1 - $60,000
o Year 2 - $70,000
o Year 3 - $80,000
o Year 4 - $90,000
Acquire vs. Lease:
 The financial model assumes the ability to lease or buy is interchangeable. It is likely
not. The Woodbury and Oakdale commercial real estate market is tight, with not a lot of
excess capacity and that capacity coming online is new. With no financial constraint, it is
likely that a leased property would be available sooner than a purchased property.
 There are benefits to a purchase, the key one is the opportunity to avoid paying property
taxes. Any lease would roll taxes into the common charges. By excluding property taxes,
and depending on the down payment, the monthly mortgage payment can be less than the
lease, operating expenses and taxes.
 However, the likely mortgage would be a 5-year with a balloon payment. While there is
the opportunity to refinance, interest rates would have likely increased (which are at
historic lows now) and credit terms could potentially change. Of course this risk can be
mitigated by securing the funds to pay-off the balloon during the 5-year period.
 Acquired space also comes with the risk of being locked in (relatively) to a location that
may not suit future needs.
16
Incremental Donated Food Impact
CCEFS is critically dependent on donated food to meet the needs of its customers. In the model,
we assume that the split between donated food and purchased food remains constant. Thus,
increased capacity to support increased demand requires increased food donations. This increase
becomes significant over 4 years compared to 2014.
Period Donated Food in Pounds % Increase vs. 2014
Year 1 10,000 10%
Year 2 21,000 21%
Year 3 32,000 31%
Year 4 43,000 43%
Volunteer Impact:
In general, it is assumed that there are no constraints to expand volunteer hours to meet the added
capacity created (2.4 times current capacity). We believe by making the volunteer experience
less challenging (no unloading outdoors) we will attract more volunteers. However, there are
key volunteer roles that will need to be filled for this capacity to be realized: client intake,
inventory control/management and volunteer coordinator.
Insufficient client intake staff will become the new capacity constraint. Currently, we generally
staff 2 intake positions per shift. We assume some process redesign enabled from new space will
allow 1 additional intake position to support the capacity expansion.
The volunteer coordinator role becomes even more critical with the expansion of new volunteers.
Currently, it is envisioned that this will continue to be a volunteer role, but this current position
remains unfilled since the fall of 2014. Future success may require staffing this role as a paid
position.
17
Outreach
Proposed Solution:
Invest in multi-channel communications to increase awareness of CCEFS offering.
Background:
To date, CCEFS communications have generally been limited to our website, 3-panel brochure
and appearances at local Woodbury events. The current brochure serves multiple audiences in
an attempt to be efficient and with that compromise, does not serve our customers or potential
customers well. Recent initiatives have increased email updates with donor and volunteer
constituencies. Only one-third of respondents (21) to last spring’s survey at HRA sites indicated
that they were aware of CCEFS.
SWOT Impact:
Take advantage of opportunity to increase usage through greater awareness of CCEFS. We
assume that expanded outreach will broaden awareness in general and mitigate the weakness of a
narrow donor and support base.
Target:
Adult population (18+ and seniors) and key referral sources in civic, school and faith
organizations in served geography.
Strategy:
 Increase channels and frequencies of communication in a targeted fashion that
acknowledges our current capacity constraints
 Improve the accessibility of CCEFS communications
 Improve usability of shopping experience to encourage word of mouth
Tactics:
 Continue to participate (Woodbury) and expand participation (Oakdale) in community
events. Seek out opportunities in the south Maplewood area.
 Expand 3rd
party channel communications as available with channel specific design
o Faith community
o Social services
o Schools
o Community websites
o Community – senior centers
 Create temporary information stands in high traffic areas or where targeted populations
visit
o Grocery stores
o Event venues
18
o Community social services
 Implement a Google paid search
 Expand press release frequency
 Rework website
o Responsive design
o Multi-lingual
 Create “user” friendly collateral materials
o Spanish
o Portable
o Long-lasting
 Multi-lingual signage in service areas
 Add multi-lingual intake staff
Impact:
 Qualified population of approximately 8,400 adults including seniors
Financial Summary:
 Capital investment of $35,500
 Average Annual cost increase: $14,980 (includes multi-lingual intake intern)
Volunteer Impact:
We do not assume that there is any constraint to this program from a limit of volunteers. That
said, increased attendance at events, especially day-long and weekend-long ones, requires a
larger pool of volunteers available at these times.
19
Mobile
Proposed Solution:
If potential customers can’t come to us (lack of transportation, hours we are open, distance, etc.),
we will come to them. CCEFS will invest in a truck and necessary equipment to create “pop-
up” distribution sites. This truck will also allow us to expand our own food rescue program and
be opportunistic with food purchases. Please note that what follows for a strategy, tactics and
most critically from a financial model perspective assumes that there is added capacity in place
to at minimum store and stage goods.
Background:
The lack of a CCEFS owned and operated truck limits our programs. Currently, our limited food
rescue program is supported 100% by volunteers and their own vehicles. The opportunity to
expand this program or take over Second Harvest routes is not possible without a truck. When
we have need to pick up large donations (or move bulky objects like donation barrels), we
depend on the availability of a loaned truck from a local realtor.
But most critically, the lack of an appropriate vehicle prevents us from taking our services to
those in need. Client surveys indicate 29% of our served population did not arrive in their own
car. For seniors, while the lack of transportation may be a concern, there is also the reluctance to
drive in poor weather or in the winter. Our limited, once a month senior service delivery to
Common Bonds Oak Terrace site suggests a large opportunity at other senior living facilities as
well as HRA sites.
While this plan does not recommend any youth targeted initiatives, any youth/school directed
program would most likely require CCEFS controlled transportation.
SWOT Impact:
A truck solution will allow CCEFS to pursue the opportunity to connect with the underserved
senior demographic as well as targeted HRA sites and other community locations. A CCEFS
owned and managed truck will also provide insurance for the threat that Second Harvest
Heartland changes their food rescue program or allow CCEFS to assume a larger role.
Target:
Low mobility groups living in concentrated areas including seniors, HRA sites and potentially
other site partners (schools, churches). Also, with the expansion of food rescue, provide added
and more frequent options to existing on-site customers.
Strategy:
Acquire and configure a used, straight truck that does not require a different class of license to
drive as well as fund a paid driver position to operate.
20
Tactics:
 Truck must have floor bed at loading dock height with a power lift on the back.
 Will not require a commercial license to operate and will be automatic transmission.
 Will be appropriately configured to support a variety of tasks (pickup, delivery, food
rescue) but will not be refrigerated.
 Will recruit area businesses to provide operational funding support in exchange for
branding opportunity on the truck (see Second Harvest trucks).
 Recruit volunteer leader for mobile programs.
Impact:
 Each year, serve 40 incremental households per month on average via mobile
 Grow service from negligible amount (20 HH’s per month average through informal
program) to 160 HH’s per month average
 Facilitate expanded food rescue to support on-site service which impacts up to 1,060
HH’s per month after 4 years.
Financial Summary:
 Capital investment of $45,000
 Annual cost increase:
o Year 1 - $30,000
o Year 2 - $35,000
o Year 3 - $39,000
o Year 4 - $43,000
 Increase in donated food required
Period Donated Food in Pounds % Increase vs. 2014
Year 1 3,100 3%
Year 2 6,200 6%
Year 3 9,200 9%
Year 4 12,300 12%
Volunteer Impact:
The financial model assumes the addition of a paid part-time driver (40% time). However, the
truck to be purchased would not require a special license to operate so a volunteer could drive it.
It is not assumed that the driver would facilitate the intake process at the remote site so we will
need to recruit volunteers to execute that role. Finally, the financial model assumes that the
expanded (full-time) role of the food shelf coordinator could also direct this activity. That may
not be possible and we may need to recruit a volunteer with the sole purpose of directing –
project managing this program.
21
Program Summary Financials
$ Impact by Programs
Item Capacity Lease Capacity
Acquire
Outreach Mobile
Capital Investment $126,500 $192,600 $35,500 $45,000
Year 1 Inc Cost $104,000 $60,000 $14,980 $30,000
Year 2 Inc Cost $117,000 $70,000 $14,980 $35,000
Year 3 Inc Cost $130,000 $80,000 $14,980 $39,000
Year 4 Inc Cost $145,000 $90,000 $14,980 $43,000
Donated Food Required by Program
Year Capacity Mobile
Year 1 Inc Pounds 10,000 3,100
Year 2 Inc Pounds 21,000 6,200
Year 3 Inc Pounds 32,000 9,200
Year 4 Inc Pounds 43,000 12,300
Items Determined to Be Out of Scope
 Name of organization
o No longer emergency
o Fund raising & grant impact
o Limiting service (fixed vs. mobile, other hunger programs)
 Multiple fixed sites
 Expansion at existing site (Woodbury Lutheran Church)
 Contingency for capacity if funding not achieved
22
Funding Strategy
CCEFS plans to approach the financing of these strategic initiatives with multi-pronged approach
to a capital campaign. This includes:
 Community outreach
 Grant applications to targeted capacity funding organizations including:
 Targeted approaches to area businesses
 Investigate faith community expansion
 County – City support
A general discussion follows.
Community Outreach:
There is a tremendous opportunity with the upcoming Feed My Starving Children (FMSC)
mobile pack event in October 2015 to not only provide a strong foundation for a capital
campaign launch (target $80,000 contribution) but also to increase the awareness of CCEFS here
in the community. CCEFS will have an educational component as part of the event’s volunteer
training and will have access to the volunteer names and contact information. This information
can provide the basis for future donation solicitations.
While the FMSC will provide a wide audience, it will be critical to engage targeted, high net
worth individuals in our community to support a capital campaign. This requires a more
sophisticated approach from event creation and execution to personal appeals. It is
recommended that the CCEFS Board create, staff and recruit outsider volunteers to participate on
a Development Committee. This committee will be a critical resource for business appeals as
well.
Grant Applications:
Much of the new equipment installed in 2013 was funded from hunger-focused, granting
organizations including Open Your Heart to the Hungry and Homeless and Hunger Solutions.
There are a number of granting organizations that focus specifically on capacity building. It is
recommended that CCEFS engage a consultant to help support this process. A placeholder
($10,000) amount has been put in the financials to fund this initiative.
A key contributor to success in the grant application process is robust support from not only
other foundations and individuals but area businesses as well. The demonstrated breadth of
“support” from other community stakeholders is a key consideration for many grantors. Also
the ability to continue to support the capacity created. CCEFS will need to demonstrate the
ability to fund ongoing support for its expanded operation.
Targeted Approaches to Area Businesses:
23
The business community represents the lowest amount of the donations received by CCEFS.
Unlike other organizations that present “high-visibility” opportunities, the vast majority of our
resources are only visible to our customers. There is the potential opportunity if a truck is
acquired to secure business sponsorship support by selling advertising space on the truck. A
vehicle making pickups and deliveries in the Woodbury, Oakdale and South Maplewood area
will reach many eyeballs. Second Harvest does this in a limited way. See also the Keller
Williams truck that we borrow.
Without the opportunity for high traffic, high visibility branding opportunities, CCEFS will need
to continue to approach businesses directly, with a personal appeal for sponsorship. The
Executive Director with a few volunteers has started such an initiative. Results to date are
inconclusive. Like the targeted consumer appeal, this effort would benefit from board
sponsorship and participation.
Faith Community:
The Woodbury-area faith community has been long-time, steady supporters of CCEFS. The
challenge is that the opportunity to increase that financial support maybe limited. Almost all of
the large (200+ household parishes) provide financial support. The ability of the current parishes
to expand support is unknown though a capital campaign proposal may provide the necessary
motivation. So with the exception of Oakdale, there is no real untapped church opportunity.
The Oakdale opportunity may be limited as one of the larger parishes is undergoing a transition
and another large church has its own food shelf. Also, many of these communities have an
existing relationship with the North St. Paul Food Shelf.
While the opportunity may be present, it is difficult to anticipate significant growth from this
source.
County – City Support:
City support (Woodbury, Oakdale, or Maplewood) has not been investigated beyond the casual
conversations about available space in Woodbury. With a board approved plan in place, it would
enable an informed conversation with city staff. Washington County does have a grant program
that has supported the construction of other county food shelf facilities (Hugo).
24
Attachment A – Model Assumptions
See PDF Assumptions
25
Attachment B – Financial Model Program Expense Impact Capacity &
Mobile
See PDF Program Impact
26
Attachment C – Outreach Program Financial Impact
CCEFS Strategic Plan Outreach Program Expenses
04172015
One - Time
Expense
On-going Annual
Expense
Website $15,000 $1,000
Client Collateral
Brochure $2,000 $500
Reference Card $500 $500
Stand Alone
Signage/Display $6,000
Multi-Lingual Poster $2,000 $500
Multi-Lingual Video $10,000
Multi-Lingual Intake $12,480
Total $35,500 $14,980

CCEFS Strategic Plan

  • 1.
    For Period: 2016 to2020 Completed: April 17, 2015 Last Reviewed: April 17, 2015
  • 2.
    2 Table of Contents Introduction.....................................................................................................................................3 CCEFS Vision, Mission & Values.................................................................................................. 3 Background..................................................................................................................................... 4 Risks and Opportunities.................................................................................................................. 8 Service Gap..................................................................................................................................... 9 Four Year Goal ............................................................................................................................. 10 Program Options........................................................................................................................... 11 Site Capacity Expansion ............................................................................................................... 13 Outreach........................................................................................................................................ 17 Mobile........................................................................................................................................... 19 Program Summary Financials....................................................................................................... 21 Items Determined to Be Out of Scope.......................................................................................... 21 Funding Strategy........................................................................................................................... 22 Attachment A – Model Assumptions............................................................................................ 24 Attachment B – Financial Model Program Expense Impact Capacity & Mobile......................... 25 Attachment C – Outreach Program Financial Impact................................................................... 26
  • 3.
    3 Introduction In 2014, CCEFSreceived a planning grant from the United Way to perform a community assessment. Strategic Consulting & Coaching (SCC) was hired to do the analysis which included an analysis of Hunger Free Minnesota’s Missing Meal study as well as key constituency interviews and customer surveys. The results were presented in June of 2014 to the CCEFS board. Subsequently, the CCEFS board decided to defer any planning action to address the concerns, suggestions and options identified in this assessment until a new board was in place in January 2015. In the January 20, 2015 board meeting, the Executive Director was charged to create a Strategic Planning Committee with the charter to address the issues identified in the June 2014 community assessment as part of building a strategic plan. Members included Greig Metzger (Executive Director); Sue Gillman (volunteer), John Donofrio (volunteer), Brandon Bellin (donor) and Peter Bloomquist (board member). The output of this committee follows. CCEFS Vision, Mission & Values Vision We envision a community in which everyone has access to sufficient nutritious food. Mission Our mission is to provide nutritious food and personal care items to people in our community in a dignified manner, while fighting to eliminate hunger. Values We believe that access to nutritious food is a basic human right. We are committed to responding to the needs of our community by providing food distribution and support services with dignity and respect.
  • 4.
    4 Background Helping Those inNeed The Christian Cupboard Emergency Food Shelf (CCEFS) provides food, personal care items and access to other resources to help those in need in the communities of Woodbury, Oakdale, Landfall and south Maplewood. Households can be confronted with loss of income, or increased expenses that puts a family in financial distress. Our goal is to provide food for those families in this type of situation. About Us Recognized by the Woodbury Area Chamber of Commerce as the 2013 non-profit of the year, CCEFS was formed as a non-profit organization by seven Woodbury area churches in 1983. Woodbury Lutheran Church made space available to house CCEFS and has remained our host church ever since. CCEFS is a registered nonprofit 501(c)3 corporation with the Internal Revenue Service and all donations are tax deductible for contributors. We operate with an Executive Director, an Operations Manager, and volunteer staff. The Board of Directors consists of representatives from the communities we serve. We are supported by the area’s faith community, civic organizations, local businesses, individual donors as well as a small group of charitable foundations. Our service area includes 22 census tracts defined by the city boundaries of Oakdale, Woodbury, and Landfall and in Maplewood by the area bounded to the north by Stillwater Avenue / Road (Route 5), to the east by Century Avenue and the west by the east side of McKnight Road. According to Hunger Free Minnesota and the 2010 census, there were 99,799 food insecure people in our service area. Service Statistic Summary In the first year of operation, an average of 5 households came to CCEFS each week to obtain assistance. Today, as many as 125 households or more are served each week and October 2014 marked a new monthly service peak of over 600 households served. For the year, CCEFS served 5,977 households in 2014. This represents a 12% increase versus 2013.
  • 5.
    5 CCEFS 2014 ServiceSummary Statistics Service Metric Quantity Total Households Served 5,977 Unique Households Served 1,302 Total Individuals Served 20,656 Segment Breakdown Quantity % of Total Ages 0-17 8,282 40% Ages 18-64 10,916 53% Ages 65+ 1,453 7% On average, each client household receives 82 pounds of food. This is a mixture of shelf-stable items (purchased and donated) as well as purchased dairy, and food rescue including dairy, bakery, deli, produce and frozen proteins (beef, chicken, fish, pork and lamb). In 2014, CCEFS distributed 490,000 pounds of food and personal care products. In 2014, the average household visited CCEFS 4.2 times in a year. The majority (56%) of our client households visit us 3 times a year or less. During Q4 2014, we saw a significant increase in the number of days that our clients experienced long wait lines and rushed service. One of our core values is to provide each client with a great shopping experience. Our ability to continue to provide this level of service is at risk with our current volume and observed growth trends. Our efforts to increase the population we serve will only aggravate this issue. 8% 0% 0% 8% 8% 8% 8% 0% 17% 14% 50% 73% Jan Feb Mar Apr May Jun Jul Aug Sep Oct Nov Dec Percent of Days per Month Over Service Capacity 0% 10% 20% 30% 40% 1 2 3 4 5 6 7 8 9 10 11 12 %ofHH's # of Visits in 2014 % HH's Annual Visit Frequency
  • 6.
    6 Serve Area Demographics& Trends Population in our service area has grown significantly since 1960. That trend is expected to continue. In the 2013 Washington County HRA study, the combined population of the two cities of Oakdale and Woodbury are expected to grow 15.5% by 2020 to 106,450. This is 38% of the total Washington County forecast population. While the ethnicity of our service area is primarily Caucasian (~80%), the Woodbury and Oakdale area have the most ethnically diverse populations of any of the Washington County cities. Race % of City’s Total Population (2010) Woodbury Oakdale White Alone 81.4 81.1 Black or African American 5.6 5.9 Native American 0.3 0.5 Asian 9.1 8.0 Other/2 or More Races 3.6 4.5 Based on Metro Council and US Census data, the growth in non- white populations is expected to continue.
  • 7.
    7 The other keydemographic trend identified is the increase in the senior population not only in the state but in our area. Children under the age of 18 make up 27% of our population while seniors over the age of 65 make up 10%. The U.S. Census Bureau projects the number of seniors in Minnesota will begin surpassing the number of children by 2020. Washington County (WCHRA 2013) forecasts a 29% increase in the 65+ population in Woodbury (versus an overall growth rate of 17%) with a 20% increase in this population in Oakdale (versus an overall growth rate of 7%).
  • 8.
    8 Risks and Opportunities Thefollowing SWOT analysis identifies CCEFS’s current positioning. Strengths  Shopping Experience o Choice Model o Walk-In  Rank & File Volunteers  Ease of Access (By Car)  Amount of Food Provided  Quality of Food  Customers Treated with Dignity & Respect Weaknesses  Wait Time  Inflexible Store Days & Hours  Nutritional Choices  Facilities Layout & Available Space  Lack of Loading Dock  Community Awareness o Customers o Supporters  Ethnic Ease of Use  Lack of Staff Depth  Narrow Donation & Support base o Faith Community o Individuals  Technology – Data Capture Opportunities  Additional Community Support o Business Community o Individual Donors o Foundation Support  New Distribution Programs o Mobile Program o Kids Packs o Seniors  Outreach  Expand Partner Relationships  Expand – Better Optimize Hours Open Threats  2nd Harvest Policy Changes  Hit Capacity Before Ready  Inhospitable Work Environment o Volunteer Comfort o Work place safety  Financial Cushion  Financial Stress of Area Food Shelves  Gifted Space o WLC o 3M  Dependence on Volunteer Workforce
  • 9.
    9 Service Gap In thespring of 2014, the United Way provided CCEFS a planning grant to understand the opportunities to improve performance in its service area. CCEFS contracted with Strategic Consulting and Coaching (SCC) in 2014 to provide an assessment of the community and the potential gaps in service. Using data from the US 2010 census and analysis provided by HungerFree Minnesota, SCC analysis identified service gaps in the area. The data is summarized below.  The population served in the CCEFS boundaries is 100,000 (based on 2010 census data).  Current qualification for the Temporary Emergency Food Assistance Program (TEFAP) is 200% of the poverty level household income. This is one of the criteria used to qualify at CCEFS for support.  Per the SCC analysis, 7,281 people within the CCEFS geography are food insecure, while 12,640 qualify for TEFAP support.  In 2014, CCEFS served 3,987 unique individuals. (Calculated from CCEFS client database, totaling number in household for all first time visits). A population breakdown by age is provided below: CCEFS Served Versus Eligible Population By Age Demographic Qualified Population 2014 CCEFS Service Estimate % of Demo Served Children 4,238 1,550 37% Adult 6,325 2,200 35% Senior 2,077 237 11% Total 12,640 3,987 32% While existing customer research indicates that CCEFS does a good job in serving those that arrive at its door (92% of those surveyed indicate that the quality of the food served is good or better), the data above demonstrate a significant gap between the eligible population and that served. The data above also suggests that while the opportunity to increase absolute service volume in our area’s eligible population is with the Adult and Children Demographic groups, it is obvious that the Senior population is critically underserved. Recently (March 23), the CCEFS Executive Director met with ISD 622 social services staff to understand what services are provided to students in the district. While not centrally organized, almost all of the schools had some backpack program in place generally supported by a local church.
  • 10.
    10 Four Year Goal By2019, we will increase our service levels to 6,500 of our target geography or approximately 50% of our food insecure population. We assume to expand by 180 households per year on average (estimated at 2,500 individuals) over four years. Incremental Amounts Description Current Year 1 Year 2 Year 3 Year 4 Served Population 4,000 4,595 5,225 5,855 6,520 HH's Served - Ave/Month 500 670 850 1,030 1,220 The plan team decided not to pursue a more aggressive goal at this time for a number of reasons. First, there will always be a certain percentage that CCEFS will be unable to reach because the target’s choice not to be reached. This number is not known and could be significant. There is also the practical limit of not being available 24 x 7 so there will always be a population that cannot be physically connected with. It is also not evident that our recommended programs will work or will work within our budget constraints. The marginal cost of connecting with the last X percent might far exceed the benefit. We believe that the 50% target balances what is feasible while at the same time making a significant impact. We will achieve this goal by maintaining our strengths, minimizing or eliminating risks and taking advantage of our opportunities. To facilitate program planning and tracking, we will approach this goal by considering and targeting defined segments of this population. These potential segments include:  Current population that is aware but doesn’t participate,  Seniors,  Children,  Unaware population (like current served population in all aspects but unaware of our services),  Transportation limited,  Chronic need.
  • 11.
    11 Program Options The CCEFSStrategic Plan team has identified several programmatic/strategic initiatives to address the populations indicated and provide operational support for the expansion of service. These include:  Fixed-Site Capacity Expansion,  Outreach Programs,  Mobile Service, and  Targeted Youth Programs Population Impact by Potential Program Population Site Outreach Mobile Youth Current X Seniors X X X Children X X Unaware X X X Transportation X X X Chronic Need X Given scarce resources (capital and human), it is recommended the organization prioritize its efforts to those programs that have the broadest impact on populations, are prerequisites for other new program offerings, or better enable program success. The recommended priority would then be: Site Capacity Expansion  Impacts all populations  Allows for storage to support off-site programs  Provides the potential to run an expanded food rescue  Reduce unit costs by purchasing in bulk  Mitigates critical threats Outreach Investment  Will be required to introduce new location/hours post capacity expansion,  Use network effect of local targeting to leverage places where key populations congregate (churches, building sites) to build awareness Mobile  Potentially the best method to reach seniors  Use vehicle to expand and control own food rescue program  Allows for opportunistic purchases of goods to be distributed  Provides flexibility to future one-off programs/events). At this point in time, it is not recommended to pursue a targeted children/youth program. ISD 833 and ISD 622 schools have pre-existing programs, which cover the vast majority of our service area. The feedback from ISD 622 social workers indicated that summer was a big gap
  • 12.
    12 and that generalservice to their families would go a long way. Therefore, it is not recommended to pursue a youth targeted initiative at this time. The chart below summarizes how CCEFS expands its service over the next four years. As it is believed that Outreach will impact both the Site Capacity Expansion and Mobile initiatives, its contribution is not broken out separately. CCEFS Service Expansion Current Year 1 Year 2 Year 3 Year 4 Served Population 4,000 HH's Served - Ave/Month 500 Incremental HH's Served (Annual Monthly Ave) Added Volume - Capacity Capacity Increase HH's 130 140 140 150 Total On-Site HH's 630 770 910 1,060 Added Volume - Mobile Sites 1 1 1 1 Mobile Increase HH's 40 40 40 40 Total Mobile HH's 40 80 120 160 Total Incremental HH's Served (Ave/Month) 170 180 180 190 Total Served Post Investment Served Population 4,595 5,225 5,855 6,520 Total HH's Served - Ave/Month 670 850 1,030 1,220 The following will discuss these programs in greater detail.
  • 13.
    13 Site Capacity Expansion ProposedSolution: Expand square footage available to food shelf and address facility challenges. Background: Woodbury Lutheran Church has generously donated our space since CCEFS’ inception. While this arrangement has worked well to date, it provides a number of constraints: 1. Floor Space – We are limited to 1,500 square feet of floor space (900 for shopping and 600 for dry storage) in the basement of the church that is secure. This limits the number of shoppers we can reasonably have to 12 per hour. It also limits the amount of inventory we can keep on hand and requires that any donations be processed immediately so they do not interfere with the flow of our clients. 2. Service Hours – Woodbury Lutheran Church is extremely well scheduled. This means we are restricted to our current 12 ½ hours of operation per week: Monday: 12:00 pm - 4:00 pm Thursday: 3:00 pm - 7:00 pm Friday: 9:00 am - 1:30 pm 3. Lack of Loading Dock – The space we are using was not originally intended to serve as a food shelf. It does not have a loading dock or double doors. This means volunteers cannot bring supplies into the food shelf on pallets. They are required to carry everything in by hand and they are exposed to the elements. 4. No Garage Door Entry – If we pursue a truck to support our operations, we do not have a secure location to park it. A facility with a garage would allow us to load/unload the truck out of the elements. As previously mentioned, we saw a significant increase in Q4 2014 in the number of days each week that we exceeded planned capacity. Our clients experienced long wait times. One of our key strengths is our great shopping experience. Our ability to continue to provide this level of service is at risk with our current volume. Any effort to increase the population we serve will only exasperate this issue. SWOT Impact: Mitigate a number of threats, including gifted space, inhospitable work environment, and capacity constraints as well as some of the weaknesses of operation including facilities layout, lack of loading dock, and inflexible service hours. Expanded capacity will reinforce our existing strengths of quality service, generous distribution amounts, and respectful atmosphere.
  • 14.
    14 Target: Expanded capacity willallow us to improve service across all populations with the exception of those that are unaware of our services. While not directly impacted, our ability to deliver on a mobile solution to those in need of transportation will be enhanced by a facility that will allow for staging, bulk purchase storage, and large volunteer groups. Strategy: Relocate existing operation to a new CCEFS controlled facility (purchase or rent) that provides a better physical plant for service enhancements, capacity to expand (both space and service hours), and features to improve unit cost performance and work environment. While there may be an opportunity to secure a smaller space and then operate 2 locations (the existing facility at the Woodbury Lutheran Church and a new location), it would potentially require duplicative staffing (paid and volunteer) and management resources. Also, a 2-location strategy that would incorporate Woodbury Lutheran space would logically require that the new site be in Oakdale to best serve our customers. Tactics:  Identify 6,000 – 7,000 square feet of showroom/warehouse space (or equivalent) in Woodbury or Oakdale. While there are no operational issues with an Oakdale location, there is a potential risk to future support (financial and volunteer) if there isn’t some physical service site in Woodbury.  Key attributes include: o Wide door for access (or ability to install) o Loading dock or inside garage door access or both (necessity for unloading delivery trucks o Minimum 18 feet high o ADA accessible o Provide for 2 high rack storage  Secure sufficient refrigerator and freezer storage capacity as well as staging and dry storage  Provide administrative space for 3 Intake, 1 Food Shelf Coordinator, ED, conference room and customer waiting area Impact:  130 – 150 incremental households per year  Grow service from 500 HH’s per month average to 1,060 HH’s per month average  After 4 years and assuming that our service goal is reached, the operation would still only be at 75% of capacity, providing room for continued growth.
  • 15.
    15 Financial Summary: Top-level, summarynumbers are presented here. Please see appendices for detailed assumptions and financial model. Lease Option:  Capital investment of $126,500  Annual cash cost increase (assumes core expenses not impacted): o Year 1 - $104,000 o Year 2 - $117,000 o Year 3 - $130,000 o Year 4 - $145,000 Acquire Option:  Capital investment of $192,600 (Assumes financing 75% of purchase & buildout cost)  Annual cash cost increase (assumes core expenses not impacted): o Year 1 - $60,000 o Year 2 - $70,000 o Year 3 - $80,000 o Year 4 - $90,000 Acquire vs. Lease:  The financial model assumes the ability to lease or buy is interchangeable. It is likely not. The Woodbury and Oakdale commercial real estate market is tight, with not a lot of excess capacity and that capacity coming online is new. With no financial constraint, it is likely that a leased property would be available sooner than a purchased property.  There are benefits to a purchase, the key one is the opportunity to avoid paying property taxes. Any lease would roll taxes into the common charges. By excluding property taxes, and depending on the down payment, the monthly mortgage payment can be less than the lease, operating expenses and taxes.  However, the likely mortgage would be a 5-year with a balloon payment. While there is the opportunity to refinance, interest rates would have likely increased (which are at historic lows now) and credit terms could potentially change. Of course this risk can be mitigated by securing the funds to pay-off the balloon during the 5-year period.  Acquired space also comes with the risk of being locked in (relatively) to a location that may not suit future needs.
  • 16.
    16 Incremental Donated FoodImpact CCEFS is critically dependent on donated food to meet the needs of its customers. In the model, we assume that the split between donated food and purchased food remains constant. Thus, increased capacity to support increased demand requires increased food donations. This increase becomes significant over 4 years compared to 2014. Period Donated Food in Pounds % Increase vs. 2014 Year 1 10,000 10% Year 2 21,000 21% Year 3 32,000 31% Year 4 43,000 43% Volunteer Impact: In general, it is assumed that there are no constraints to expand volunteer hours to meet the added capacity created (2.4 times current capacity). We believe by making the volunteer experience less challenging (no unloading outdoors) we will attract more volunteers. However, there are key volunteer roles that will need to be filled for this capacity to be realized: client intake, inventory control/management and volunteer coordinator. Insufficient client intake staff will become the new capacity constraint. Currently, we generally staff 2 intake positions per shift. We assume some process redesign enabled from new space will allow 1 additional intake position to support the capacity expansion. The volunteer coordinator role becomes even more critical with the expansion of new volunteers. Currently, it is envisioned that this will continue to be a volunteer role, but this current position remains unfilled since the fall of 2014. Future success may require staffing this role as a paid position.
  • 17.
    17 Outreach Proposed Solution: Invest inmulti-channel communications to increase awareness of CCEFS offering. Background: To date, CCEFS communications have generally been limited to our website, 3-panel brochure and appearances at local Woodbury events. The current brochure serves multiple audiences in an attempt to be efficient and with that compromise, does not serve our customers or potential customers well. Recent initiatives have increased email updates with donor and volunteer constituencies. Only one-third of respondents (21) to last spring’s survey at HRA sites indicated that they were aware of CCEFS. SWOT Impact: Take advantage of opportunity to increase usage through greater awareness of CCEFS. We assume that expanded outreach will broaden awareness in general and mitigate the weakness of a narrow donor and support base. Target: Adult population (18+ and seniors) and key referral sources in civic, school and faith organizations in served geography. Strategy:  Increase channels and frequencies of communication in a targeted fashion that acknowledges our current capacity constraints  Improve the accessibility of CCEFS communications  Improve usability of shopping experience to encourage word of mouth Tactics:  Continue to participate (Woodbury) and expand participation (Oakdale) in community events. Seek out opportunities in the south Maplewood area.  Expand 3rd party channel communications as available with channel specific design o Faith community o Social services o Schools o Community websites o Community – senior centers  Create temporary information stands in high traffic areas or where targeted populations visit o Grocery stores o Event venues
  • 18.
    18 o Community socialservices  Implement a Google paid search  Expand press release frequency  Rework website o Responsive design o Multi-lingual  Create “user” friendly collateral materials o Spanish o Portable o Long-lasting  Multi-lingual signage in service areas  Add multi-lingual intake staff Impact:  Qualified population of approximately 8,400 adults including seniors Financial Summary:  Capital investment of $35,500  Average Annual cost increase: $14,980 (includes multi-lingual intake intern) Volunteer Impact: We do not assume that there is any constraint to this program from a limit of volunteers. That said, increased attendance at events, especially day-long and weekend-long ones, requires a larger pool of volunteers available at these times.
  • 19.
    19 Mobile Proposed Solution: If potentialcustomers can’t come to us (lack of transportation, hours we are open, distance, etc.), we will come to them. CCEFS will invest in a truck and necessary equipment to create “pop- up” distribution sites. This truck will also allow us to expand our own food rescue program and be opportunistic with food purchases. Please note that what follows for a strategy, tactics and most critically from a financial model perspective assumes that there is added capacity in place to at minimum store and stage goods. Background: The lack of a CCEFS owned and operated truck limits our programs. Currently, our limited food rescue program is supported 100% by volunteers and their own vehicles. The opportunity to expand this program or take over Second Harvest routes is not possible without a truck. When we have need to pick up large donations (or move bulky objects like donation barrels), we depend on the availability of a loaned truck from a local realtor. But most critically, the lack of an appropriate vehicle prevents us from taking our services to those in need. Client surveys indicate 29% of our served population did not arrive in their own car. For seniors, while the lack of transportation may be a concern, there is also the reluctance to drive in poor weather or in the winter. Our limited, once a month senior service delivery to Common Bonds Oak Terrace site suggests a large opportunity at other senior living facilities as well as HRA sites. While this plan does not recommend any youth targeted initiatives, any youth/school directed program would most likely require CCEFS controlled transportation. SWOT Impact: A truck solution will allow CCEFS to pursue the opportunity to connect with the underserved senior demographic as well as targeted HRA sites and other community locations. A CCEFS owned and managed truck will also provide insurance for the threat that Second Harvest Heartland changes their food rescue program or allow CCEFS to assume a larger role. Target: Low mobility groups living in concentrated areas including seniors, HRA sites and potentially other site partners (schools, churches). Also, with the expansion of food rescue, provide added and more frequent options to existing on-site customers. Strategy: Acquire and configure a used, straight truck that does not require a different class of license to drive as well as fund a paid driver position to operate.
  • 20.
    20 Tactics:  Truck musthave floor bed at loading dock height with a power lift on the back.  Will not require a commercial license to operate and will be automatic transmission.  Will be appropriately configured to support a variety of tasks (pickup, delivery, food rescue) but will not be refrigerated.  Will recruit area businesses to provide operational funding support in exchange for branding opportunity on the truck (see Second Harvest trucks).  Recruit volunteer leader for mobile programs. Impact:  Each year, serve 40 incremental households per month on average via mobile  Grow service from negligible amount (20 HH’s per month average through informal program) to 160 HH’s per month average  Facilitate expanded food rescue to support on-site service which impacts up to 1,060 HH’s per month after 4 years. Financial Summary:  Capital investment of $45,000  Annual cost increase: o Year 1 - $30,000 o Year 2 - $35,000 o Year 3 - $39,000 o Year 4 - $43,000  Increase in donated food required Period Donated Food in Pounds % Increase vs. 2014 Year 1 3,100 3% Year 2 6,200 6% Year 3 9,200 9% Year 4 12,300 12% Volunteer Impact: The financial model assumes the addition of a paid part-time driver (40% time). However, the truck to be purchased would not require a special license to operate so a volunteer could drive it. It is not assumed that the driver would facilitate the intake process at the remote site so we will need to recruit volunteers to execute that role. Finally, the financial model assumes that the expanded (full-time) role of the food shelf coordinator could also direct this activity. That may not be possible and we may need to recruit a volunteer with the sole purpose of directing – project managing this program.
  • 21.
    21 Program Summary Financials $Impact by Programs Item Capacity Lease Capacity Acquire Outreach Mobile Capital Investment $126,500 $192,600 $35,500 $45,000 Year 1 Inc Cost $104,000 $60,000 $14,980 $30,000 Year 2 Inc Cost $117,000 $70,000 $14,980 $35,000 Year 3 Inc Cost $130,000 $80,000 $14,980 $39,000 Year 4 Inc Cost $145,000 $90,000 $14,980 $43,000 Donated Food Required by Program Year Capacity Mobile Year 1 Inc Pounds 10,000 3,100 Year 2 Inc Pounds 21,000 6,200 Year 3 Inc Pounds 32,000 9,200 Year 4 Inc Pounds 43,000 12,300 Items Determined to Be Out of Scope  Name of organization o No longer emergency o Fund raising & grant impact o Limiting service (fixed vs. mobile, other hunger programs)  Multiple fixed sites  Expansion at existing site (Woodbury Lutheran Church)  Contingency for capacity if funding not achieved
  • 22.
    22 Funding Strategy CCEFS plansto approach the financing of these strategic initiatives with multi-pronged approach to a capital campaign. This includes:  Community outreach  Grant applications to targeted capacity funding organizations including:  Targeted approaches to area businesses  Investigate faith community expansion  County – City support A general discussion follows. Community Outreach: There is a tremendous opportunity with the upcoming Feed My Starving Children (FMSC) mobile pack event in October 2015 to not only provide a strong foundation for a capital campaign launch (target $80,000 contribution) but also to increase the awareness of CCEFS here in the community. CCEFS will have an educational component as part of the event’s volunteer training and will have access to the volunteer names and contact information. This information can provide the basis for future donation solicitations. While the FMSC will provide a wide audience, it will be critical to engage targeted, high net worth individuals in our community to support a capital campaign. This requires a more sophisticated approach from event creation and execution to personal appeals. It is recommended that the CCEFS Board create, staff and recruit outsider volunteers to participate on a Development Committee. This committee will be a critical resource for business appeals as well. Grant Applications: Much of the new equipment installed in 2013 was funded from hunger-focused, granting organizations including Open Your Heart to the Hungry and Homeless and Hunger Solutions. There are a number of granting organizations that focus specifically on capacity building. It is recommended that CCEFS engage a consultant to help support this process. A placeholder ($10,000) amount has been put in the financials to fund this initiative. A key contributor to success in the grant application process is robust support from not only other foundations and individuals but area businesses as well. The demonstrated breadth of “support” from other community stakeholders is a key consideration for many grantors. Also the ability to continue to support the capacity created. CCEFS will need to demonstrate the ability to fund ongoing support for its expanded operation. Targeted Approaches to Area Businesses:
  • 23.
    23 The business communityrepresents the lowest amount of the donations received by CCEFS. Unlike other organizations that present “high-visibility” opportunities, the vast majority of our resources are only visible to our customers. There is the potential opportunity if a truck is acquired to secure business sponsorship support by selling advertising space on the truck. A vehicle making pickups and deliveries in the Woodbury, Oakdale and South Maplewood area will reach many eyeballs. Second Harvest does this in a limited way. See also the Keller Williams truck that we borrow. Without the opportunity for high traffic, high visibility branding opportunities, CCEFS will need to continue to approach businesses directly, with a personal appeal for sponsorship. The Executive Director with a few volunteers has started such an initiative. Results to date are inconclusive. Like the targeted consumer appeal, this effort would benefit from board sponsorship and participation. Faith Community: The Woodbury-area faith community has been long-time, steady supporters of CCEFS. The challenge is that the opportunity to increase that financial support maybe limited. Almost all of the large (200+ household parishes) provide financial support. The ability of the current parishes to expand support is unknown though a capital campaign proposal may provide the necessary motivation. So with the exception of Oakdale, there is no real untapped church opportunity. The Oakdale opportunity may be limited as one of the larger parishes is undergoing a transition and another large church has its own food shelf. Also, many of these communities have an existing relationship with the North St. Paul Food Shelf. While the opportunity may be present, it is difficult to anticipate significant growth from this source. County – City Support: City support (Woodbury, Oakdale, or Maplewood) has not been investigated beyond the casual conversations about available space in Woodbury. With a board approved plan in place, it would enable an informed conversation with city staff. Washington County does have a grant program that has supported the construction of other county food shelf facilities (Hugo).
  • 24.
    24 Attachment A –Model Assumptions See PDF Assumptions
  • 25.
    25 Attachment B –Financial Model Program Expense Impact Capacity & Mobile See PDF Program Impact
  • 26.
    26 Attachment C –Outreach Program Financial Impact CCEFS Strategic Plan Outreach Program Expenses 04172015 One - Time Expense On-going Annual Expense Website $15,000 $1,000 Client Collateral Brochure $2,000 $500 Reference Card $500 $500 Stand Alone Signage/Display $6,000 Multi-Lingual Poster $2,000 $500 Multi-Lingual Video $10,000 Multi-Lingual Intake $12,480 Total $35,500 $14,980