The document presents a research article on a proposed graph clustering method named structure-attribute similarity clustering (sas-cluster) for community detection within political blogs. It focuses on combining structural similarities and node attributes to enhance community structure cohesiveness and evaluates the method using density and entropy measures, demonstrating its superiority over existing methods. Key contributions include the introduction of two new concepts, mean gravity and path degree, to improve the clustering algorithm's effectiveness in social network analysis.
![International Journal of Electrical and Computer Engineering (IJECE)
Vol. 9, No. 3, June 2019, pp. 2121~2130
ISSN: 2088-8708, DOI: 10.11591/ijece.v9i3.pp2121-2130 2121
Journal homepage: http://iaescore.com/journals/index.php/IJECE
Community detection of political blogs network based on
structure-attribute graph clustering model
Ahmed F. Al-Mukhtar, Eman S. Al-shamery
Department of Software Engineering, University of Babylon, Iraq
Article Info ABSTRACT
Article history:
Received May 15, 2018
Revised Nov 12, 2018
Accepted Dec 11, 2018
Complex networks provide means to represent different kinds of networks
with multiple features. Most biological, sensor and social networks can be
represented as a graph depending on the pattern of connections among their
elements. The goal of the graph clustering is to divide a large graph into
many clusters based on various similarity criteria’s. Political blogs as
standard social dataset network, in which it can be considered as blog-blog
connection, where each node has political learning beside other attributes.
The main objective of work is to introduce a graph clustering method in
social network analysis. The proposed Structure-Attribute Similarity (SAS-
Cluster) able to detect structures of community, based on nodes similarities.
The method combines topological structure with multiple characteristics of
nodes, to earn the ultimate similarity. The proposed method is evaluated
using well-known evaluation measures, Density, and Entropy. Finally, the
presented method was compared with the state-of-art comparative method,
and the results show that the proposed method is superior to the comparative
method according to the evaluations measures.
Keywords:
Collaborative similarity
Community detection
Complex networks
Graph clustering
Social networks
Copyright © 2019 Institute of Advanced Engineering and Science.
All rights reserved.
Corresponding Author:
Ahmed F. Al-Mukhtar,
Department of Software Engineering,
University of Babylon,
Hilla, Babylon, Iraq.
Email: ahmed.almukhtar@uokerbala.edu.iq
1. INTRODUCTION
In recent years, social networks are significantly considered as an important domain of complex
networks, where networks can be modeled as graphs [1], [2]. The graph structure is a useful approach for
studying social networks, where objects (such as people and authors) can be modeled as nodes and the
relationships among objects can be represented as edges connecting these nodes. In social networks analysis,
the graph clustering [3] is a great tool that is widely used to partition the large network into several densely
connected community structures based on similarity measures. In result, the partitioned structures facilitate
the understanding of large network visualization and make it easier to be analyzed.
The strategy of the graph clustering was used in many domains of social network analysis including,
biological networks [4], community detection [5]-[9], and websites social networks [10]. Mainly, there are
several graph clustering techniques, most of these techniques consider only the similarity of the topological
structures [11], [12], others focus on the attributes of the of contents of the nodes [13], while few of them
have considered both approaches [8].
Nowadays, and with increasing the influence of the weblogs on the human lifestyle especially in the
periods of the US elections. Thus, it is the time to develop appropriate methods that are able to detect the
community structures within these weblog networks. As a result, make it easier to visualize and analyze such
networks. In this work, a new graph clustering method is proposed for community detection in social
networks called Structure-Attribute Similarity Clustering (SAS-Cluster), that take into the account the](https://image.slidesharecdn.com/7513217-200727025325/75/Community-detection-of-political-blogs-network-based-on-structure-attribute-graph-clustering-model-1-2048.jpg)
![ ISSN: 2088-8708
Int J Elec & Comp Eng, Vol. 9, No. 3, June 2019 : 2121 - 2130
2122
similarities of the topological structures and the nodes attributes. Two concepts are introduced in this paper
the Mean Gravity and the Path Degree, which are used to increase the community structure cohesiveness.
The contributions of this paper are summarized below:
a. A new graph clustering algorithm is proposed which considers the structural similarity and the nodes
attributes.
b. Two concepts (Mean Gravity and Path Degree) are introduced which are used to increase the
cohesiveness of the structure of the clusters.
The remaining sections of this paper are arranged as follows. Section 2 introduces a review of some
most recent related works. Section 3 focuses on the graph clustering technique. Section 4 describes Political
Blogosphere Network. Section 5 introduces the proposed method. Section 6 reviews the experimental results.
Finally, section 7 concludes this paper.
2. RELATED WORKS
This section reviews a summary of most recent related works concerning the graph clustering
methods of social networks. The goal of graph clustering is to group the nodes of the network that have
denser connections among them. Some methods such as Clique Peculation Methods CPM focus on
internal/external edge counting [3] while ignoring the interactions and vertex characteristics, in [14] the
authors propose a clique method on co-purchased network weighted graph, to find micro-cluster, the
algorithm works in two phases graph polishing to enumerate intersections of neighbors and clique
enumeration to count maximum cliques.
Newman-Girvan is considered as well-known divisive algorithm [15] for community detection
which based on two main steps; first detects some edges based on betweenness measure then splits the
network into communities based on the detected edges finally it requires betweenness recalculation after each
splitting, the quality of the communities is measured using the maximal modularity. However, the method is
not suitable for large networks and it suffers from the resolution limit.
In ABCD [6], the authors introduced new algorithm based on bi-directional connections and nodes
features to detect community attractiveness of OSN, the algorithm was validated in SNAP platform and
compared with CNM [5], according to the researcher ABCD is outperformed CNM and it can discover
smaller communities in contrast with CNM, however, the method was not shown the comparative results of
the modularity values to prove its effectiveness.
The k-prototype algorithm ISCD+ [16] an iterative model for fast graph clustering, the authors
introduce a new idea for detecting communities, the algorithm imposes two factors namely local importance
and importance concentration to select nodes with different weights to represent communities.
The KNN-based algorithms in [12] the authors propose a directed weighted graph clustering
algorithm for community detection, the algorithm considers network topology only and it is significantly
focused on the path traversed frequency and neighborhood nodes, nevertheless, the method suffers from
computational complexity since it is based on k-nearest neighbors’ computations.
In [10] the authors introduced a new approach for community detection in social network websites.
besides structure similarity a frequent pattern mining of nodes contents was contributed, the algorithm is
implemented in four steps, preprocessing, frequent pattern computing to obtain harmonious groups,
extending harmonious groups into small communities, finally small communities expansion, however, the
method suffers from some disadvantages such as, time complexity which is caused by the input parameters, a
trial, and error concept was used to determine the appropriate parameters.
Roy et al. in [17] proposed a graph-based spectral clustering model, the method uses novel affinity
matrix for spatial clustering with Mahalanobis distance, however, the method has some limitations, the
distance metric can only measure from a single point, this reduces results quality.
Jinarat et al. in [18] have introduced a graph clustering algorithm for web search results, the core
idea of the method is to combine web search results with external knowledge data from Wikipedia to attain
better clustering quality. the method uses graph-based construction for text clustering to connect related
documents, nevertheless, the similarity threshold parameter for subgraph detection must be in a certain range,
when the threshold parameter increases, the clustering quality decreases.
3. GRAPH CLUSTERING TECHNIQUE
An indirect weighted graph { , , , },G V E W where | |V is a set of vertices. | |E set of edges. | |W
set of edges weights. Each edge | |ie E maps two vertices ( , )i jv v to be connected with specific weight ijw ,
where , | |i jv v V and | |ijw W . Each vertex in a graph is associated with a set of attributes, in such that the](https://image.slidesharecdn.com/7513217-200727025325/75/Community-detection-of-political-blogs-network-based-on-structure-attribute-graph-clustering-model-2-2048.jpg)
![Int J Elec & Comp Eng ISSN: 2088-8708
Community detection of political blogs network based on structure-attribute… (Ahmed F. Al-Mukhtar)
2123
term 1 2 3{ , , , , }nattr attr attr attr where
1
( )
n
i i j
j
v v attr
The purpose of graph clustering is to partition a
graph into k-disjoint subgraphs, depending on some topological structures and attributes similarity measures,
the communities should have the following aspects;
a. Similar vertices should be participated in a similar group, while the dissimilar ones should go to different
groups.
b. The vertices that belong to the community should be densely connected to each other and sparsely
connected to the other vertices within different communities.
The goal of the proposed algorithm is to introduce a weighted measure. Thus can effectively reflects
the characteristics of network topology and vertices features to strengthen the similarity cohesiveness. The
strategy of clustering and the similarity measure will be discussed in the next section.
3.1. Contrast comparative method
W-Cluster [9] is an emerged algorithm of SA-Cluster, which considers both structures and attributes
aspects by applying a unified distance measure and neighborhood random walk strategy. The method uses the
probability of edge belongs to the community to Measure link strength and Jaccard coefficient similarity to
estimate content similarity. Eventually, W-cluster can automatically learn the degree of both topological
similarities and attribute similarity through utilizing the probability transition matrix to build unified distance
measure. The method partition large graph into numbers of clusters.
3.2. Evaluation measures
To evaluate the clusters quality results of the SAS-Cluster, two evaluation measures are used for this
purpose; Density [1] and Entropy [19]. Both measures have the following definitions. Density measure is
used to estimate the structural closeness to each cluster. Density is denoted in Equation (1).
1
1
( , )
({ } )
| |
k
k m n
c c
c
v v
Density v
E
(1)
where c is a number of clusters {1,2,3, , }k , cv represents the number of vertices belongs to the certain
cluster. ,m nv v are two vertices, , | |m nv v V and ( , )m n cv v v . ( , )m nv v represents an edge | |E .
Entropy measure is used to determine the relevance of attributes among vertices in each cluster.
Entropy can be defined in Equation (2) and Equation (3).
1
1 1
1
| |
({ } ) ( , )
| |
m k
k ac i
c c im
c i
al
l
w v
V E ac v
V
w
(2)
2
1
( , ) log ( )
nc
i cin cin
n
E ac v P P
(3)
where i is the number of clusters in the range {1,2,3, , }k , ac is the attribute value at index number in
range the [1,2,3, , ]m . n is the attribute values. ,m nc is a number of attribute values. cinP is the
percentage of cluster vertices that have th
n attribute value on ac
4. POLITICAL BLOGOSPHERE NETWORK
The political web-blogs have played an important role in US Presidential Elections since the year of
2000 and after, and it is gained more influence at the 2004 US Presidential Elections. First, the blog can be
understood as an informational website placed on World Wide Web WWW which is devoted to publishing a
diary-style text or posts, sometimes contains links to other websites.
According to Adamic et al. in [20] the year 2004 demonstrated a rapid increase in the popularity of
blogs, accordingly, the significant fraction of internet traffic was directed to these blogs. However, there is](https://image.slidesharecdn.com/7513217-200727025325/75/Community-detection-of-political-blogs-network-based-on-structure-attribute-graph-clustering-model-3-2048.jpg)
![ ISSN: 2088-8708
Int J Elec & Comp Eng, Vol. 9, No. 3, June 2019 : 2121 - 2130
2124
9% of internet users acknowledged that they read political blogs during US Political Campion. Therefore, the
weblogs may be followed by a small number of readers but its influence extends beyond that.
To discover the behavior of Blogosphere network, Adamic et al. in [20], have analyzed the
landscape of most influential political blogs in two months before the US Presidential Elections. The analysis
was based on the topics of the discussion and linking structure among blogs. The top 40 influential blogs
were considered and added to the original list.
According to Adamic et al. a set of URLs was gathered from seven online weblog directories
including, eTalkingHead, BlogCatalog, CampaignLine, and Blogarama. Each URL represents the political
weblog. A one-day snapshot is taken for URLs, for each downloaded page, the citation was considered, and
any newly discovered page was added to the list.
Next step, for all the discovered blogs, the citations are counted up, if the discovered page was cited
for 17 times or more, then, its orientation is labeled manually depending on blogrolls and posts and added to
the original list. The final set consists of 1494 blogs, divided into 759 liberals and 735 conservative blogs.
The pattern in which the blogs are linked together was done, by counting the number of posts in such that
each blog cites to another blog is counted as an edge between the two blogs. However, the link was not
duplicated if the blog was cited by another blog more than once within the same post.
Figure 1. The community structures of the political blogs extracted from [20]. The colors reflect political
orientations, the red for conservatives, the blue for liberals, the color purple from conservatives to liberals
and the color orange from liberals to conservatives
Finally, the authors concluded network description, in such that, each political learning is more
likely to talk about certain topics, one can notice an interesting pattern which is conservative bloggers tend to
link to other conservative blogs and it is more densely linked (Table 1).
Table 1. Frequently used Items and their Descriptions
Symbols Description
m n
v v Vertices with a direct connection
m nv v Vertices with an indirect connection
m nv v Disconnected vertices
( )md v Number of ties connected to vertex m
( )mc v Closeness centrality to vertex j
S Topological structure similarity
A attribute similarity](https://image.slidesharecdn.com/7513217-200727025325/75/Community-detection-of-political-blogs-network-based-on-structure-attribute-graph-clustering-model-4-2048.jpg)
![Int J Elec & Comp Eng ISSN: 2088-8708
Community detection of political blogs network based on structure-attribute… (Ahmed F. Al-Mukhtar)
2127
| |
1
| |
1
1
( , )
,
( , )
( , ) ,
n
m
m
n m ai
i
m nm
aj
m n A
j
v
l l A m n l
l v
v v w
v v
wsim v v
sim v v v v and v V
(12)
where , | |m nv v V . m is the number of attributes associated with mv . aw represents the attribute value
usually either 0 or 1. By combining Equation (10) and Equation (12) the final mathematical description of the
structure attribute similarity is defined in Equation (13).
( , ) ( , ) ( , )m n m n s m n ASAS v v sim v v sim v v (13)
where ( , )m nSAS v v is the structure attribute similarity between a pair of vertices m
v and n
v .
5.3. Algorithm description
After obtaining final similarity value among vertices, by applying Equation (13). now one can get
the distance value among vertices which is defined in Equation (14), but first, the similarity value has to be
normalized to be in the range of [0, 1].
1 ( )
( , )
,
m n
m n
norm SAS
SAS D v v
v v
(14)
( , )m n
SAS D v v is the Distance value between the two vertices mv and nv . ( ) 0m
d v and ( ) 0n
d v .
In prior, the number of centroids k are selected randomly, at each iteration these centroids are
updated, the rest of vertices are assigned to the nearest centroid based on minimum distance.
Algorithm 1. SAS-Cluster
Input: undirected, weighted* and multi-attribute Graph G , clusters number k , the weight factor , max iteration number MAX
Output: 1 2, , kk clusters C C C
1. Initialization: vertices 1{ } 0n
i iv , distance [ ][ ] 0i jD v v , vertices attributes , 1[ ] 0m
i wattrj jv , 1 ,
[] 0ClusterSentroid .
2. Graph creation:
2.1. Add vertex:
If NewNodenot in vertices{ }iv
Vertices{ }iv NewNode
End if
2.2. Add Edge
If ,i jv v in vertices{ }iv
Create ( , )i jv v link & ( , )j iv v link
End if
3. Similarity computation:
For each vertex iv & jv in | |V where i j
( , ) ( , ) ( , )i j i j s i j ASAS v v sim v v sim v v
( , ) 1 ( ( , ))i j i j
SAS D v v Norm SAS v v
End for
4. SAS-Cluster:
Select k randomly from vertices | |V as initial centroids for 1 2, , kC C C
[] ( )kClusterSentroid k c
While not end OR there is no change in the MIN distance](https://image.slidesharecdn.com/7513217-200727025325/75/Community-detection-of-political-blogs-network-based-on-structure-attribute-graph-clustering-model-7-2048.jpg)
![ ISSN: 2088-8708
Int J Elec & Comp Eng, Vol. 9, No. 3, June 2019 : 2121 - 2130
2128
For each | |jv in V
[ ] min { ( , )}ijCluster j D i j for all centroids 1i k
End for
For each cluster ,i i k
If the SUM of distances is minimum
Update [ ]ClusterSentroid i
End if
End for
End While
Return 1 2, , kk clusters C C C
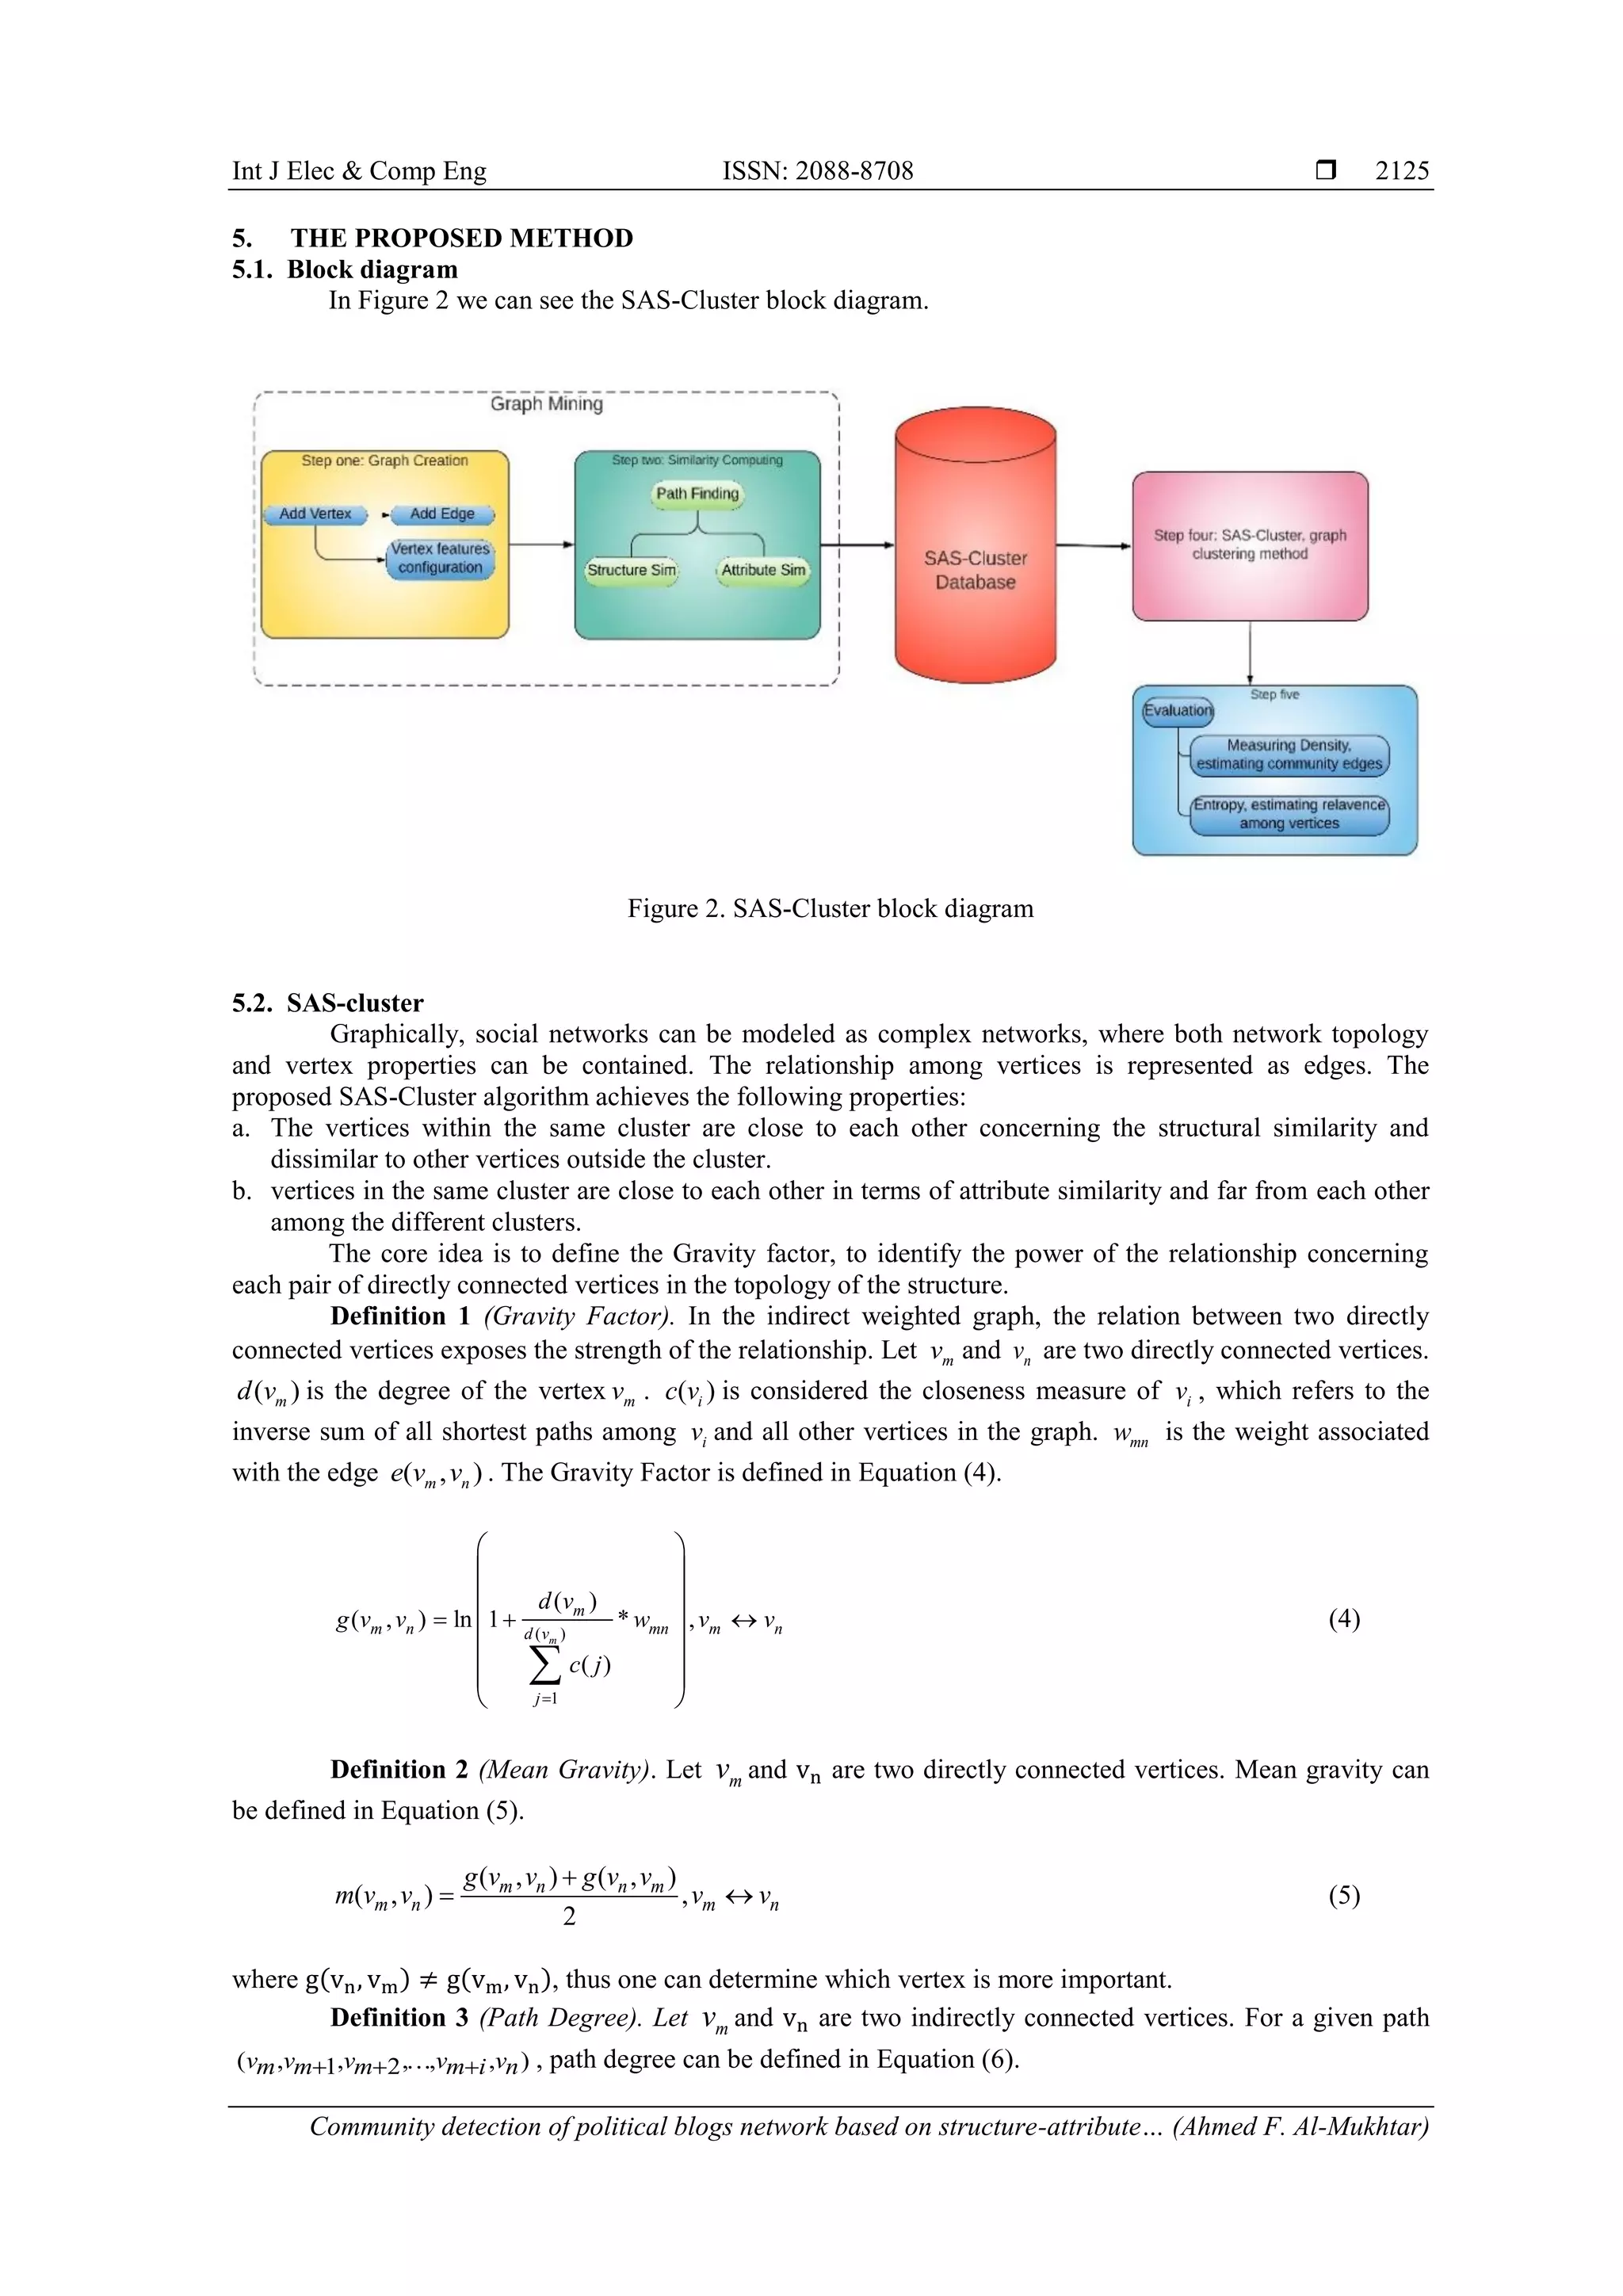
Initially and regarding
Figure 2, SAS-Cluster algorithm requires two predetermined parameters α and number of clusters k.
at step one algorithm reads the raw data to create the network and determines the number of attributes
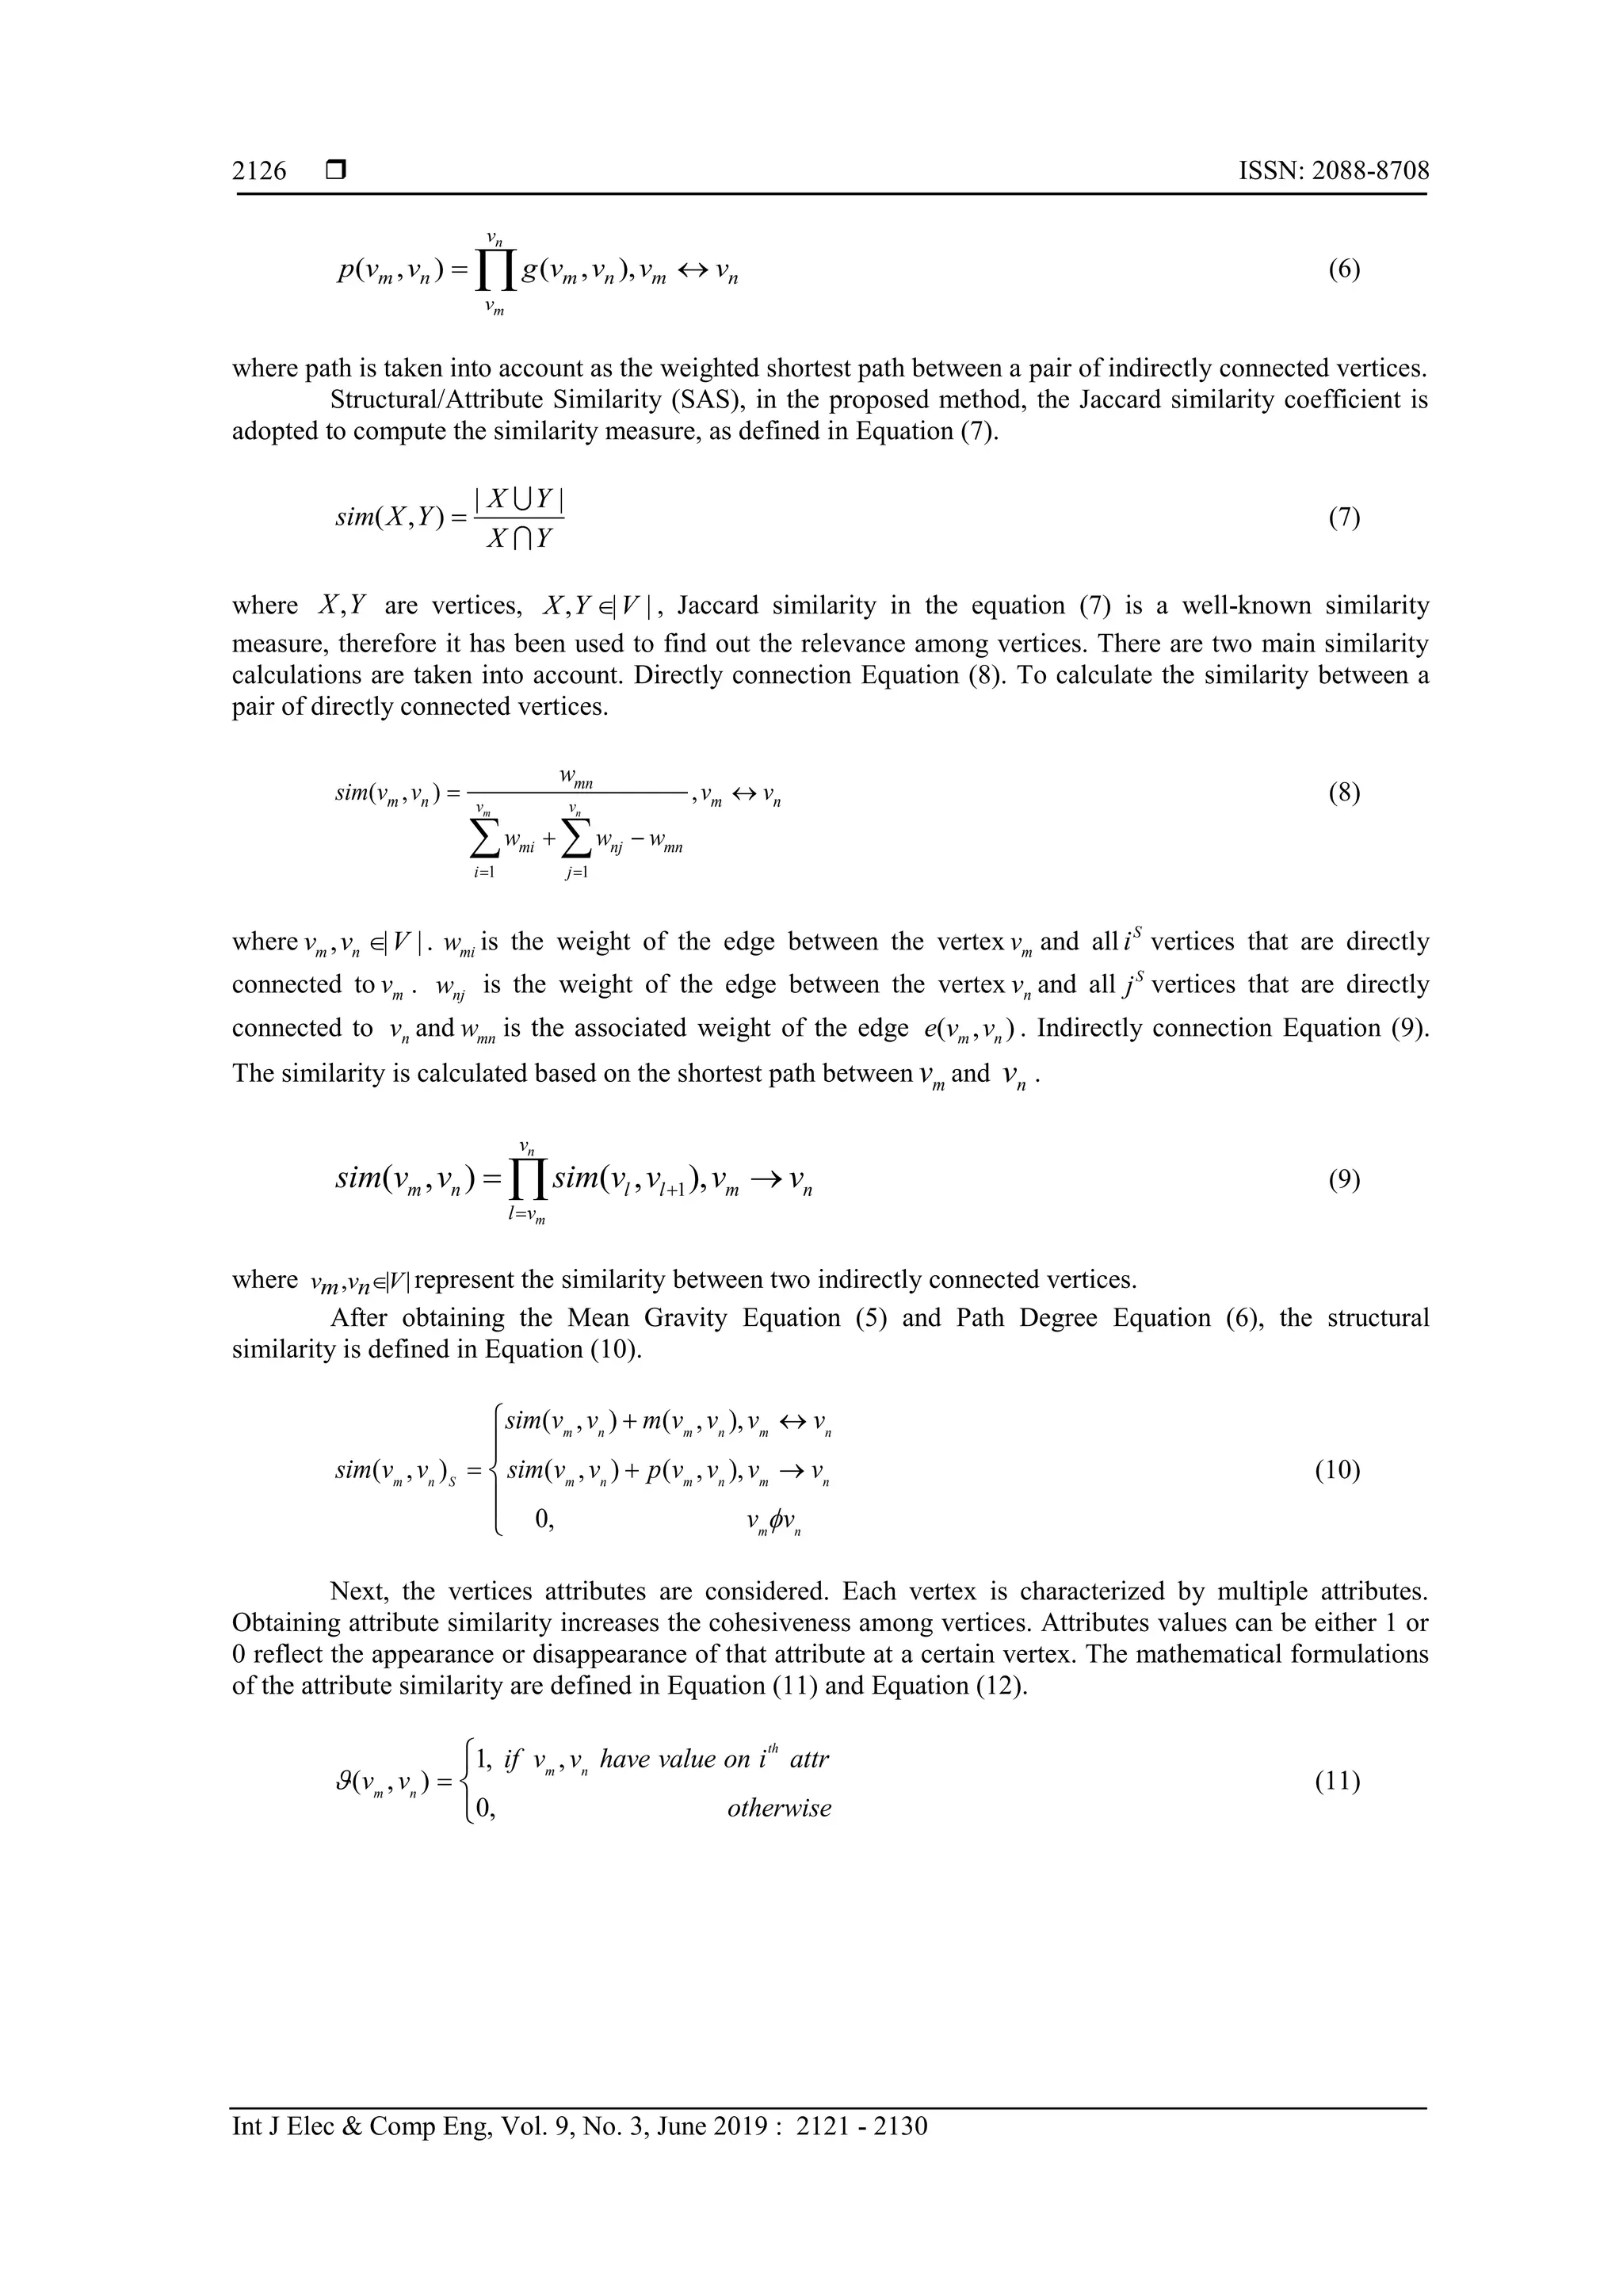
associated with each vertex. Step two multiple paths among nodes are considered, many calculations must be
insured, Mean Gravity Equation (5) and Path Degree Equation (6), are required to establish SAS similarity
calculations as in Equation (13), Distance values among each couple of vertices in Equation (14) are
computed based on SAS similarity results. All data must be stored in the database. Step four and regarding
the number of k and distance values, the communities are extracted from the original graph. Finally, and
concerning the Equations (1), (2) and (3), the results are evaluated using Density and Entropy.
6. EXPERIMENTAL RESULTS
In this section, extensive experiments are performed to evaluate the performance of the SAS-Cluster
method. All experiments are conducted on PC with Windows 10 Pro 64 bit, an i7-6700 HG CPU (260 GHz,
and 16 GB RAM. The programming environment is Python 3.6.2 (MSC v.1900 32 bit (Intel)).
6.1. Dataset
Political Blogs Dataset, as real network dataset, which is used to for the evaluation and analyzing
the proposed method. The dataset is based on blog-blog connection [20]. It consists of 1,490 nodes and each
node contains an attributes description to characterize its political learning, which is either conservative or
democrat.
6.2. Results
The proposed SAS-Cluster algorithm is extensively evaluated with the state-of-art method
W-cluster [9] through well-known evaluating measures, Density, and Entropy. The density as given in
Equation (1), reflects the extent of how tight structure is connected among vertices in each cluster, the higher
density value reflects the community structure cohesiveness. The entropy that is described in Equation (2)
and Equation (3), which is used to rate the attribute relationship among vertices, low entropy reflects better
relevance among vertices in each cluster. Figure 3 and Figure 4 show the performance of SAS-Cluster
concerning Density and Entropy, where the number of clusters 3,5,7,9k . is set in the range [0, 1] and
1 . The algorithm is run for at least three iterations.
Figure 3, reviews the density values. When setting to 0 the density value is the lowest, this
because of the similarity of the structural topology is not taken into account. At 3k the density values
declines when is set to 0.6 or 0.7. At 5,7,9k and 0.5 the density values drops down.
Figure 4, reviews the entropy values, the best-given values when α equal to 0, since the algorithm is
run based on the attribute similarity only. In contrast, when α equal to 1 the given-values is the worst this
because the attribute similarity is not taken into the account. At 3,5,7,9k the best given-results when is
set to 0.5 or 0.8. While the quality of the results tends to decrease when 0.8 . As illustrated in Figure 3
and Figure 4, the best performance for SAS-Cluster when is either 0.5 or 0.8.](https://image.slidesharecdn.com/7513217-200727025325/75/Community-detection-of-political-blogs-network-based-on-structure-attribute-graph-clustering-model-8-2048.jpg)
![Int J Elec & Comp Eng ISSN: 2088-8708
Community detection of political blogs network based on structure-attribute… (Ahmed F. Al-Mukhtar)
2129
Figure 3. Impact factor α on the political blog.
Clarifies Density results for SAS-Cluster
Figure 4. Impact factor α on the political blog.
Clarifies Entropy results for SAS-Cluster
To show the effectiveness of the proposed method, SAS-Cluster is compared with the state-of-art
method, W-cluster. Both methods are tested for a fixed number of clusters 3,5,7,9k and is set to 0.5.
Figure 5 and Figure 6 illustrate the comparison results of the density and the entropy respectively for
each of SAS-Cluster and W-cluster. All results have shown that SAS-Cluster outperformed W-Cluster
concerning the density and the entropy measures.
Figure 5. Density comparison values on political blogs Figure 6. Entropy comparison values on political blogs
7. CONCLUSION
Nowadays, social networks have become more influential in individual’s opinion, decisions, and
their lifestyle. Therefore, and with the accelerated increase in social networks data, it is important to adopt a
more reliable graph clustering methods for community detection. In this paper, a graph clustering method for
community detection is proposed. The method introduces two concepts, Gravity degree and Path degree, to
increase the structural similarities within the detected communities. In addition, the adopted method
combines structural similarities with the multiple attributes of nodes to attain more cohesiveness similarity.
The experimental results have shown that SAS-Cluster is better than W-cluster according to Density and
Entropy evaluation measures.
REFERENCES
[1] P. Mrutyunjaya, et al., “Social Networking,” Book of Springer International Publishing, vol. 65, pp. 45-83, 2014.
[2] S. S. Elisa, “Graph Clustering,” Computer Science Review, vol. 1, pp. 27-64, 2007.
[3] F. Santo and H. Darko, “Community detection in networks: A user guide,” Physics Reports, vol. 659, pp. 1-45,
2016.
[4] Girvan M. and Newman M. E., “Community structure in social and biological networks,” Proceedings of the
national academy of sciences, vol. 99, pp. 7821-7826, 2002.
[5] Clauset, et al., “Finding community structure in very large networks,” Physical review E, vol. 70, pp. 1-6, 2004.
0
0.1
0.2
0.3
0.4
0.5
0.6
0.7
0.8
0.9
0 0.1 0.2 0.3 0.4 0.5 0.6 0.7 0.8 0.9 1
DENSITY
ΑLPHA
k = 3
k = 5
k = 7
k = 9
0
0.1
0.2
0.3
0.4
0.5
0.6
0 0.1 0.2 0.3 0.4 0.5 0.6 0.7 0.8 0.9 1
ENTROPY
ALPHA
k = 3
k = 5
k = 7
k = 9
0
0.1
0.2
0.3
0.4
0.5
0.6
0.7
0.8
0.9
3 5 7 9
Density
No. of clusters k
SAS-Cluster
W-cluster
0
0.1
0.2
0.3
0.4
0.5
0.6
0.7
0.8
0.9
3 5 7 9
Entropy
No. of clustersk
SAS-Cluster
W-cluster](https://image.slidesharecdn.com/7513217-200727025325/75/Community-detection-of-political-blogs-network-based-on-structure-attribute-graph-clustering-model-9-2048.jpg)
![ ISSN: 2088-8708
Int J Elec & Comp Eng, Vol. 9, No. 3, June 2019 : 2121 - 2130
2130
[6] Liu, et al., “Weighted Graph Clustering for Community Detection of Large Social Networks,” Procedia Computer
Science, vol. 31, pp. 85-94, 2014.
[7] Lambiotte, et al., “Random Walks, Markov Processes and the Multiscale Modular Organization of Complex
Networks,” IEEE Transactions on Network Science and Engineering, vol. 1, pp. 76-90, 2014.
[8] Boobalan, et al., “Graph clustering using k-Neighbourhood Attribute Structural similarity,” Applied Soft
Computing, vol. 47, pp. 216-223, 2016.
[9] Cheng, et al., “Clustering Large Attributed Graphs: A Balance between Structural and Attribute Similarities,” ACM
Transactions on Knowledge Discovery from Data, vol. 5, pp. 1-33, 2011.
[10] Moosavi, et al., “Community detection in social networks using user frequent pattern mining,” Knowledge and
Information Systems, vol. 51, pp. 159-186, 2017.
[11] Chen, et al., “Study on similarity based on connection degree in social network,” Cluster Computing, vol. 20, pp.
167-178, 2017.
[12] Parimala, et al., “K-Neighbourhood Structural Similarity Approach for Spatial Clustering,” Indian Journal of
Science and Technology, vol. 8, 2015.
[13] Tian, et al., “Efficient aggregation for graph summarization,” Proceedings of the 2008 ACM SIGMOD
international conference on Management of data - SIGMOD '08, pp. 567-580, 2008.
[14] Yamazaki, et al., “Weighted Micro-Clustering: Application to Community Detection in Large-Scale Co-Purchasing
Networks with User Attributes,” Proceedings of the 25th International Conference Companion on World Wide
Web, pp. 131-132, 2016.
[15] Newman M. E. and Girvan M., “Finding and evaluating community structure in networks,” Physical Review E, vol.
69, pp. 026113, 2004.
[16] Bai, et al., “Fast graph clustering with a new description model for community detection,” Information Sciences,
vol. 388-389, pp. 37-47, 2017.
[17] Mandal J. K. and Roy P., “A novel spectral clustering based on local distribution,” International Journal of
Electrical and Computer Engineering, vol. 5, pp. 361, 2015.
[18] J. Supakpong and H. Choochart, “Graph-Based Concept Clustering for Web Search Results,” International Journal
of Electrical and Computer Engineering, vol. 5, pp. 1536-1544, 2015.
[19] F. Santo, “Community detection in graphs,” Physics Reports, vol. 486, pp. 75-174, 2010.
[20] Adamic, et al., “The political blogosphere and the 2004 US election: divided they blog,” Proceedings of the 3rd
international workshop on Link discovery, pp. 36-43, 2005.](https://image.slidesharecdn.com/7513217-200727025325/75/Community-detection-of-political-blogs-network-based-on-structure-attribute-graph-clustering-model-10-2048.jpg)