The document discusses plans for developing sustainable and carbon-neutral future cities in India. Some key points discussed include:
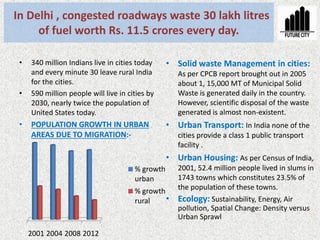
- India's urban population is growing rapidly and will reach 590 million by 2030, bringing challenges around housing, transportation, waste management and other civic issues.
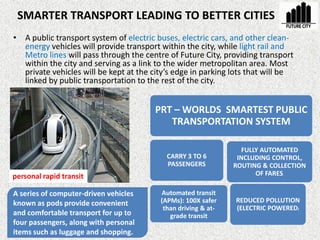
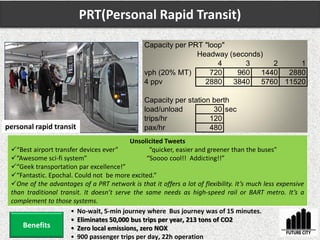
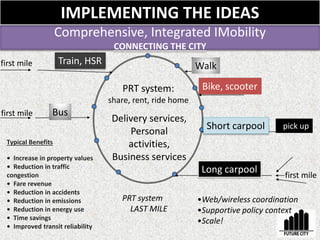
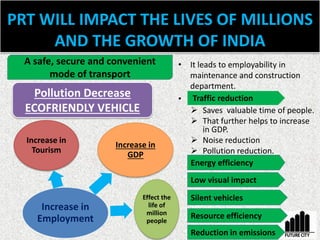
- A proposed future city design includes a personal rapid transit (PRT) system using electric vehicles to provide efficient intra-city transportation, reducing pollution and congestion.
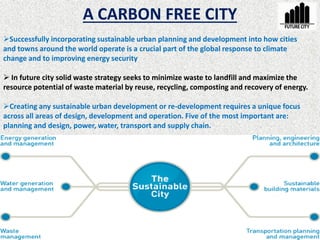
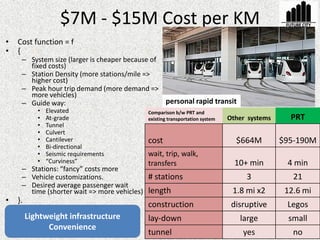
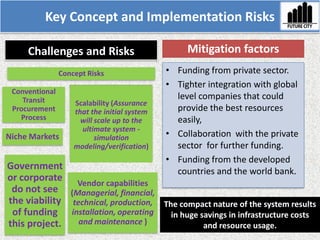
- Developing sustainable systems for areas like transportation, water, waste and energy use will be important for future cities to be environmentally friendly while supporting large populations. Challenges around funding and implementation would need to be addressed.


![Implementing TOD [To Scale] [For All]](https://cdn.slidesharecdn.com/ss_thumbnails/lucnadaltt2017todscreen-170120143550-thumbnail.jpg?width=640&height=640&fit=bounds)


![Getting Started with Apache Spark: Big Data Made Simple [Free Meetup]](https://cdn.slidesharecdn.com/ss_thumbnails/apachesparkgettingstarted-260203175547-8361bcc3-thumbnail.jpg?width=640&height=640&fit=bounds)


