Download as PDF, PPTX


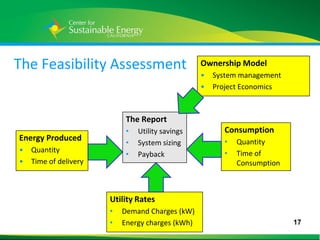


The document summarizes a presentation about assessing the feasibility of distributed solar generation. It discusses evaluating site energy usage, available space for photovoltaics, utility tariffs and incentives to identify economic opportunities and constraints. A feasibility study determines the optimal system size to maximize savings within these parameters through net metering. It compares ownership models to power purchase agreements.


