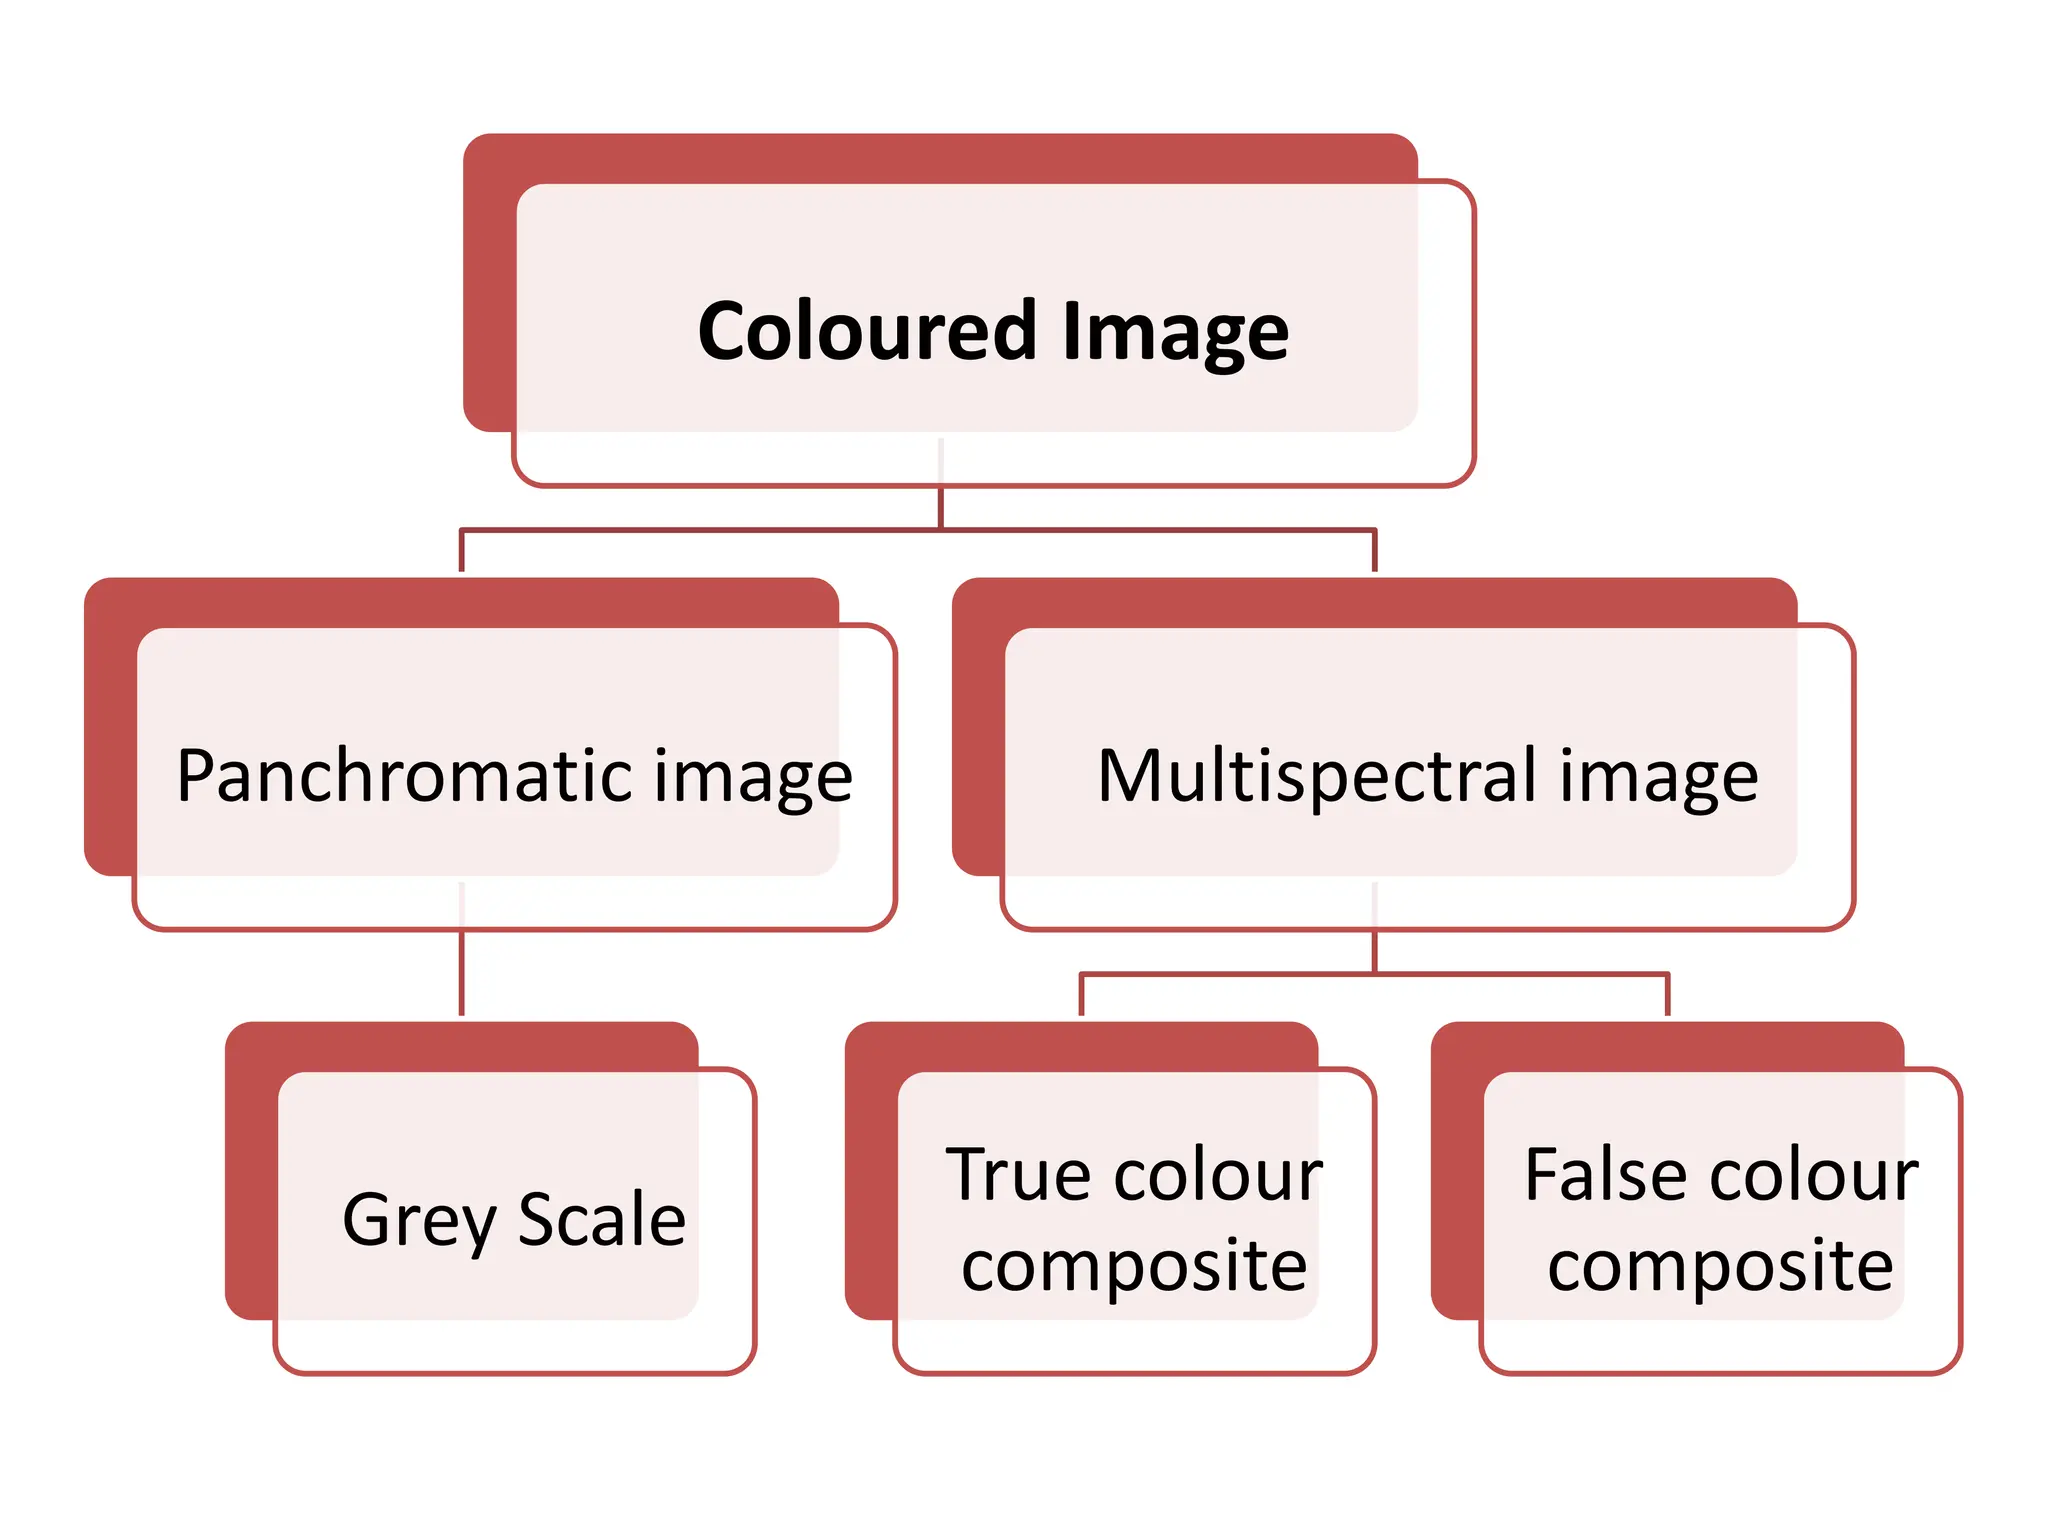
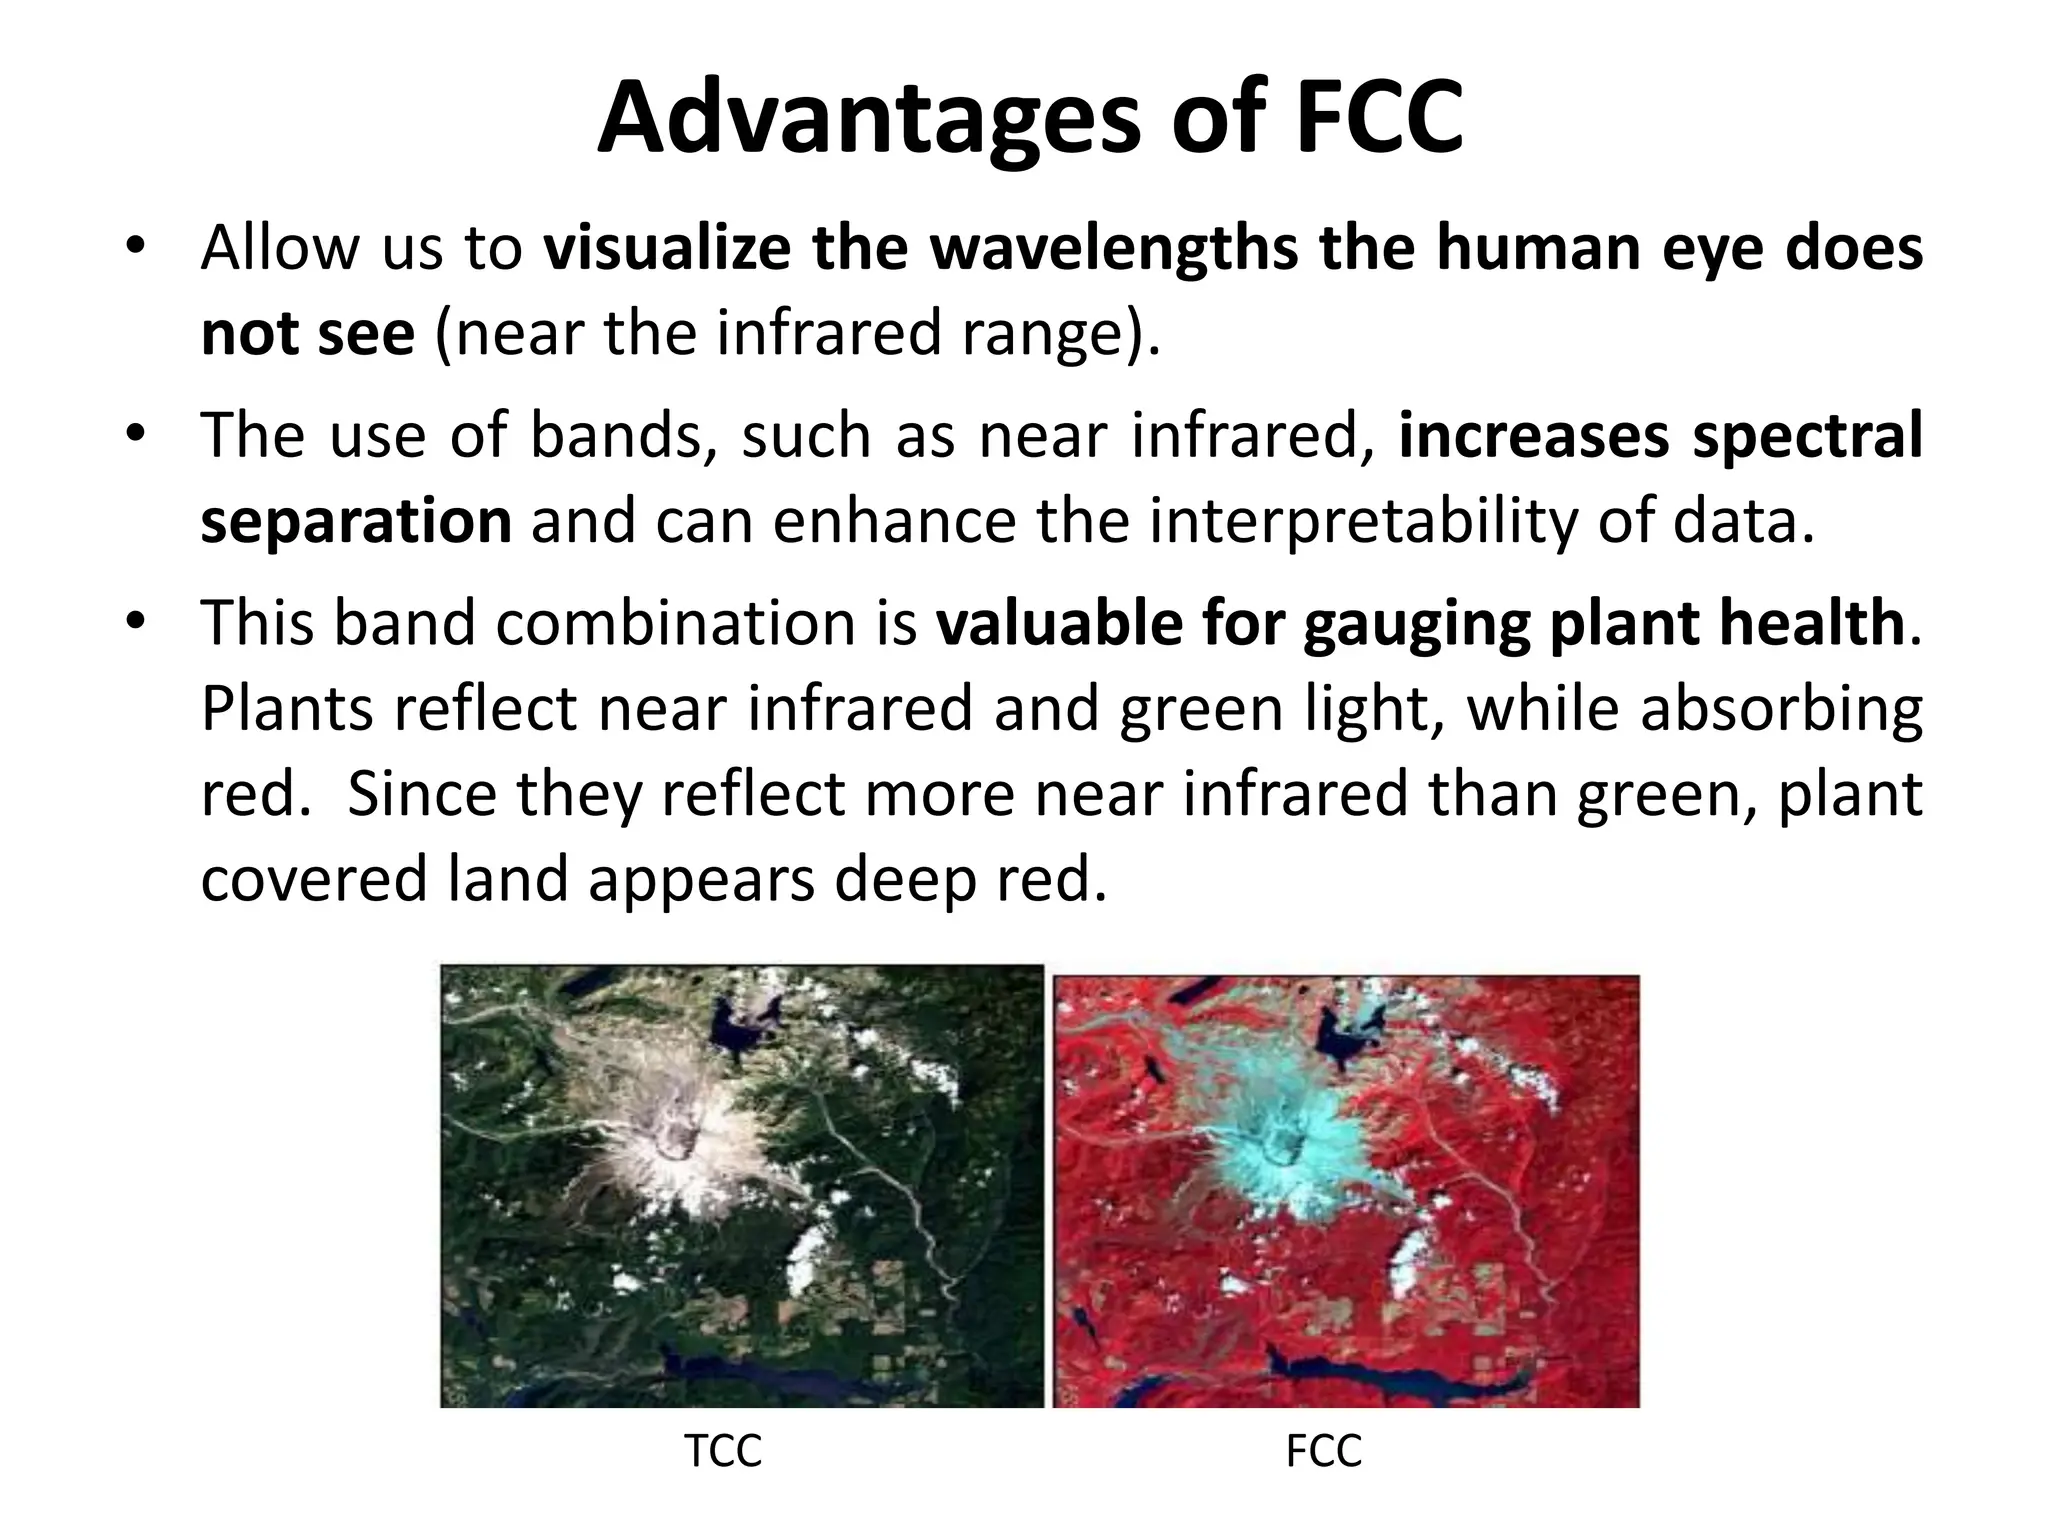
COLOUR COMPOSITES
Submitted by
Contents
• Colour Composites
– True Colour Composite
– False Colour Composite
Introduction
Information contained in an optical image
having colours are often utilized for image
interpretation.
“Colour is defined as the aspect of things that
is caused by differing qualities of light being
reflected or emitted by them.”
Coloured Image
Panchromatic image
Grey Scale
Multispectral image
True colour
composite
False colour
composite
True Colour Composite
• If a multispectral image consists of the three
visual primary colour bands the three bands may
be combined to produce a "true colour" image.
• The colours of the resulting colour composite
image resemble closely what would be observed
by the human eyes.
False Colour Composite
• The most commonly seen false-color images display
the very-near infrared as red, red as green, and green
as blue.
• In this case, the colour of a target in the displayed
image does not have any resemblance to its actual
colour.
• The resulting product is known as a false colour
composite image.
Other False colour composite scheme
R = SWIR band (SPOT4 band 4, Landsat TM band 5)
G = NIR band (SPOT4 band 3, Landsat TM band 4)
B = Red band (SPOT4 band 2, Landsat TM band 3)
• In this display scheme, vegetation
appears in shades of green.
• Bare soils and clear cut areas appear
purplish or magenta.
• The patch of bright red area on the left
is the location of active fires.
• A smoke plume originating from the
active fire site appears faint bluish in
colour.
FCC of SPOT 4
multispectral image
including the SWIR Band.
Advantages of FCC
• Allow us to visualize the wavelengths the human eye does
not see (near the infrared range).
• The use of bands, such as near infrared, increases spectral
separation and can enhance the interpretability of data.
• This band combination is valuable for gauging plant health.
Plants reflect near infrared and green light, while absorbing
red. Since they reflect more near infrared than green, plant
covered land appears deep red.
TCC FCC
Colour signatures on standard false colour Composite of Earth Surface
Earth surface
features
Colours in
standard FCC
Earth surface
features
Colours in
standard FCC
Evergreen Red to magenta Clear water Dark blue to
black
Deciduous Brown to red Turbid water Light blue
Scrubs Light brown with
red patches
Shallow ravines Light green
Cropped land Pink to Bright
red
Wetlands Motelled black
Fallow land Light blue to
white
Built up area
High density
Dark blue to
bluish green
Wetland
vegetation
Blue to grey low density Light blue
Applications of FCC
• The monitoring of forest fires.
• Surfaces with elevated temperatures, such as
forest fires and calderas of volcanoes, saturate
the image in medium IR channels and are
displayed in shades of red or yellow.
• Study of vegetation health.
THANK YOU

COLOUR COMPOSITES in remote sensing.pptx

  • 1.
  • 2.
    Contents • Colour Composites –True Colour Composite – False Colour Composite
  • 3.
    Introduction Information contained inan optical image having colours are often utilized for image interpretation. “Colour is defined as the aspect of things that is caused by differing qualities of light being reflected or emitted by them.”
  • 5.
    Coloured Image Panchromatic image GreyScale Multispectral image True colour composite False colour composite
  • 6.
    True Colour Composite •If a multispectral image consists of the three visual primary colour bands the three bands may be combined to produce a "true colour" image. • The colours of the resulting colour composite image resemble closely what would be observed by the human eyes.
  • 8.
    False Colour Composite •The most commonly seen false-color images display the very-near infrared as red, red as green, and green as blue. • In this case, the colour of a target in the displayed image does not have any resemblance to its actual colour. • The resulting product is known as a false colour composite image.
  • 10.
    Other False colourcomposite scheme R = SWIR band (SPOT4 band 4, Landsat TM band 5) G = NIR band (SPOT4 band 3, Landsat TM band 4) B = Red band (SPOT4 band 2, Landsat TM band 3) • In this display scheme, vegetation appears in shades of green. • Bare soils and clear cut areas appear purplish or magenta. • The patch of bright red area on the left is the location of active fires. • A smoke plume originating from the active fire site appears faint bluish in colour. FCC of SPOT 4 multispectral image including the SWIR Band.
  • 11.
    Advantages of FCC •Allow us to visualize the wavelengths the human eye does not see (near the infrared range). • The use of bands, such as near infrared, increases spectral separation and can enhance the interpretability of data. • This band combination is valuable for gauging plant health. Plants reflect near infrared and green light, while absorbing red. Since they reflect more near infrared than green, plant covered land appears deep red. TCC FCC
  • 12.
    Colour signatures onstandard false colour Composite of Earth Surface Earth surface features Colours in standard FCC Earth surface features Colours in standard FCC Evergreen Red to magenta Clear water Dark blue to black Deciduous Brown to red Turbid water Light blue Scrubs Light brown with red patches Shallow ravines Light green Cropped land Pink to Bright red Wetlands Motelled black Fallow land Light blue to white Built up area High density Dark blue to bluish green Wetland vegetation Blue to grey low density Light blue
  • 13.
    Applications of FCC •The monitoring of forest fires. • Surfaces with elevated temperatures, such as forest fires and calderas of volcanoes, saturate the image in medium IR channels and are displayed in shades of red or yellow. • Study of vegetation health.
  • 14.

Editor's Notes

  • #9 A false color image is one in which the R,G, and B values do not correspond to the true colors of red, green and blue. The display colour assignment for any band of a multispectral image can be done in an entirely arbitrary manner.
  • #10 There could be more false colour combinations such as -next slide