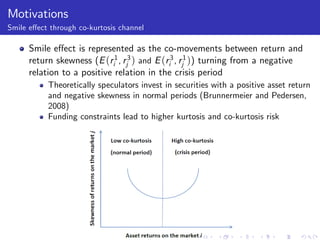
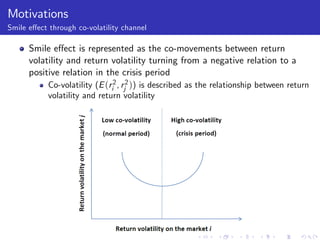
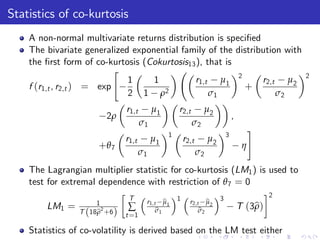
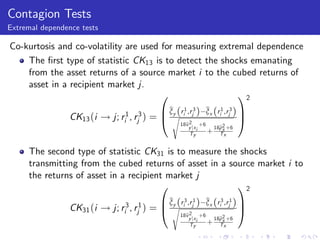
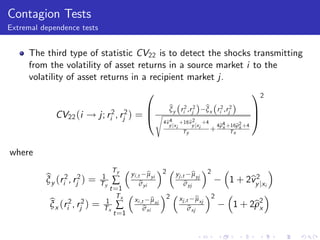
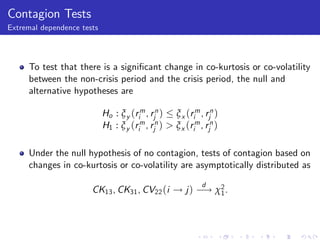
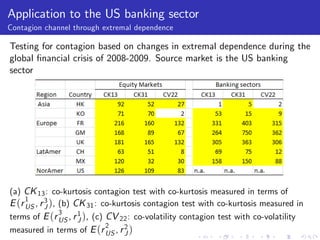
A New Test of Financial Contagion with Application to
               the US Banking Sector

                              Cody Yu-Ling Hsiao
                   Centre For Applied Macroeconomic Analysis
                          Australian National University


                                November 2012


   Cody Hsiao ()                   Contagion Tests             11/27   1 / 18
Outline


   Motivations
   Research questions
   Contribution
   Statistics of co-kurtosis and co-volatility
   Contagion tests (testing for smile e¤ect)
   Application to the US banking sectors
Motivations
Smile e¤ect through co-kurtosis channel

      Smile e¤ect is represented as the co-movements between return and
      return skewness (E (ri1 , rj3 ) and E (ri3 , rj1 )) turning from a negative
      relation to a positive relation in the crisis period
           Theoretically speculators invest in securities with a positive asset return
           and negative skewness in normal periods (Brunnermeier and Pedersen,
           2008)
           Funding constraints lead to higher kurtosis and co-kurtosis risk
Motivations
Smile e¤ect through co-volatility channel

      Smile e¤ect is represented as the co-movements between return
      volatility and return volatility turning from a negative relation to a
      positive relation in the crisis period
           Co-volatility (E (ri2 , rj2 )) is described as the relationship between return
           volatility and return volatility
Research questions


   How to test for …nancial contagion (smile e¤ect) through co-kurtosis
   or co-volatility channels?
   Does …nancial contagion (smile e¤ect) through co-kurtosis or
   co-volatility channels really exist in the …nancial markets during the
   global …nancial crisis of 2008-2009?
Contributions


    A new class of tests of …nancial contagion based on increases in
    co-kurtosis or co-volatility is proposed
De…nition
    Contagion is de…ned as a signi…cant increase in the fourth order co-moments
    of two markets between a non-crisis and a crisis period

    This new approach is applied to test for …nancial contagion (smile
    e¤ect) in equity markets and banking sectors following the global
    …nancial crisis of 2008-2009
Statistics of co-kurtosis
    A non-normal multivariate returns distribution is speci…ed
    The bivariate generalized exponential family of the distribution with
    the …rst form of co-kurtosis (Cokurtosis13 ), that is
                           "
                             1     1          r1,t µ1 2        r2,t µ2                             2
    f (r1,t , r2,t ) = exp            2
                                                          +
                             2 1 ρ                 σ1              σ2
                                r1,t        µ1       r2,t        µ2
                         2ρ                                                       ,
                                       σ1                   σ2
                                                                                           #
                                                 1                            3
                                r1,t        µ1           r2,t        µ2
                       +θ 7                                                            η
                                       σ1                       σ2
    The Lagrangian multiplier statistic for co-kurtosis (LM1 ) is used to
    test for extremal dependence with restriction of θ 7 = 0
                                 T                   1                    3                    2
                      1                 r1,t µ1b           r2,t µ2b
        LM1 =
                 T (18b2 +6 )
                      ρ
                                ∑           b
                                            σ1                 b
                                                               σ2                     T (3b)
                                                                                          ρ
                                t =1

    Statistics of co-volatility is derived based on the LM test either
Contagion Tests
Extremal dependence tests

Co-kurtosis and co-volatility are used for measuring extremal dependence
    The …rst type of statistic CK13 is to detect the shocks emanating
    from the asset returns of a source market i to the cubed returns of
    asset in a recipient market j.
                                      0                   12
                                            B by (r 1 ,r 3 )
                                              ξ                b (r 1 ,r 3 ) C
                                                               ξx i j
                 CK13 (i ! j; ri1 , rj3 ) = @ s i 2j                          A
                                                     18b
                                                       v        +6
                                                         y jx i     18b2 +6
                                                                      ρ
                                                         Ty        + Txx

     The second type of statistic CK31 is to measure the shocks
     transmitting from the cubed returns of asset in a source market i to
     the returns of asset in a recipient market j
                                       0                 12
                                            B by (r 3 ,r 1 )
                                              ξ                b (r 3 ,r 1 ) C
                                                               ξx i j
                 CK31 (i ! j; ri3 , rj1 ) = @ s i 2j                          A
                                                     18b
                                                       v        +6
                                                         y jx i     18b2 +6
                                                                      ρ
                                                         Ty        + Txx
Contagion Tests
Extremal dependence tests


                                   Ty                        m                    n
                                                    b
                                            yi ,t µyi                     b
                                                                  yj ,t µyj
           b rm, rn =
           ξy i j             1
                                   ∑                                                  3by jxi
                                                                                       v
                              Ty                 b
                                                 σyi                   b
                                                                       σyj
                                   t =1
                                     Tx                       m            b
                                                                   xj ,t µxj      n
            b rm, rn =        1                     b
                                            xi ,t µxi
            ξx i j            Tx    ∑            b
                                                 σxi                    b
                                                                        σxj           (3bx ) ,
                                                                                        ρ
                                   t =1

and
                                                         by
                                                         ρ
                            b
                            vy jx =     s
                                                  2       2
                                                                              .
                               i                 sy ,i   sx ,i
                                            1+        2           (1   b2 )
                                                                       ρy
                                                     sx ,i


      b
      vy jx represents the adjusted correlation coe¢ cient proposed by Forbes
           i
      and Rigobon (2002).
      They consider that estimation of cross-market correlation coe¢ cients
      is biased due to heteroscedasticity in market returns.
Contagion Tests
Extremal dependence tests


     The third type of statistic CV22 is to detect the shocks transmitting
     from the volatility of asset returns in a source market i to the
     volatility of asset returns in a recipient market j.
                                                  0                                                 12
                                        B                     b (
                                                              ξy    ri2 ,rj2   )   b r 2 ,r 2
                                                                                       (
                                                                                   ξx i j       )   C
             CV22 (i ! j; ri2 , rj2 ) = @ s                                                         A
                                                          4b4 +16b2 +4
                                                           v           v
                                                             y jx i      y jx i  4b4 +16b2 +4
                                                                                  ρ     ρ
                                                                    Ty          + x Tx x


where
                                     Ty                   2                        2
                                                     b
                                             yi ,t µyi                    b
                                                                  yj ,t µyj
          b (r 2 , r 2 ) =
          ξy i j                1
                                     ∑                                                           v2
                                                                                            1 + 2by jxi
                                Ty                b
                                                  σyi                  b
                                                                       σyj
                                     t =1
                                       Tx                     2            b
                                                                   xj ,t µxj           2
           b (r 2 , r 2 )                             b
                                              xi ,t µxi
           ξx i j           =   1
                                Tx    ∑            b
                                                   σxi                  b
                                                                        σxj                     1 + 2b2
                                                                                                     ρx
                                      t =1
Contagion Tests
Extremal dependence tests


     To test that there is a signi…cant change in co-kurtosis or co-volatility
     between the non-crisis period and the crisis period, the null and
     alternative hypotheses are

                            Ho : ξ y (rim , rjn ) ξ x (rim , rjn )
                            H1 : ξ y (rim , rjn ) > ξ x (rim , rjn )

     Under the null hypothesis of no contagion, tests of contagion based on
     changes in co-kurtosis or co-volatility are asymptotically distributed as
                                                              d
                       CK13 , CK31 , CV22 (i ! j ) ! χ2 .
                                                      1
Application to the US banking sector

    The …nancial crisis of 2008-2009 is escalated into a global
    phenomenon
    The tests of contagion are applied to identify transmission channels
    through changes in extremal dependences during the global …nancial
    crisis of 2008-2009
    Data
        The daily banking equity indices and equity indices are collected for
        four regions
        Asian region (Hong Kong and Korea), European region (France,
        Germany, the UK), Latin American region (Chile and Mexico), North
        American region (the US)
        The non-crisis period is chosen from April 1, 2005 to June 29, 2007
        and the crisis period is from March 3, 2008 to August 31, 2009
    A Vector Autoregressive (VAR) model is estimated in order to control
    for market fundamentals and handle the problems of serial correlation
Application to the US banking sector
Contagion channel through extremal dependence

Testing for contagion based on changes in extremal dependence during the
global …nancial crisis of 2008-2009. Source market is the US banking
sector


(a) CK 13 : co-kurtosis contagion test with co-kurtosis measured in terms of
     1
E (r US , r 3 ), (b) CK 31 : co-kurtosis contagion test with co-kurtosis measured in
            J
                 3
terms of E (r US , r 1 ), (c) CV 22 : co-volatility contagion test with co-volatility
                      J
                              2
measured in terms of E (r US , r 2 )
                                   J
Conclusion


   A new test of …nancial contagion based on changes in co-kurtosis and
   co-volatility is proposed
   This new approach is applied to test for …nancial contagion in equity
   markets and banking sectors following the global …nancial crisis of
   2008-2009
   The results of the tests show that signi…cant contagion e¤ects (smile
   e¤ects) are widespread from the US banking sector to global equity
   markets and global banking sectors through one of the extremal
   dependence channels
Any questions?
Further studies


    A joint test of contagion through the co-skewness channel
    A joint test of contagion through the co-kurtosis and co-volatility
    channel
    Selection of the period of crisis period could a¤ect the results of
    contagion
        Sensitivity tests given the di¤erent periods of the crisis period
        Markov switching model in contagion analysis (the crisis period are
        endogenously by the MS model)
Finite sample properties


    Monte Carlo simulations are performed to calculate the critical values
    due to relative large sample period of the non-crisis period but
    relative short sample period of the crisis.
    To generate the asset returns in the simulation, the parameters are
    chosen for the following non-crisis and crisis variance-covariance
    matrices of returns in two equity market i and j as

                    0.557 0.143                29.195 14.350
            Vx =                    , Vy =                       .
                    0.143 2.660                14.350 16.430
Finite sample properties
    The size of non-crisis period is Tx = 585 and the size of crisis period is
    Ty = 391. α is signi…cant level. Based on 10,000 replications.

              Test statistics   α = 0.025    α = 0.05     α = 0.1
                  CS 12              5.40        4.02        2.73
                  CS 21              4.91        3.81        2.70
                  CK 13              9.33        7.04        4.79
                  CK 31              9.28        7.00        4.81
                  CV 22              5.03        3.82        2.73
                   χ2
                    1                5.02        3.84        2.71

    The statistics for contagion based on co-skewness and co-volatility present a
    good approximation of the …nite sample distribution
    The test statistics for contagion based on co-kurtosis tend to be biased
    The results of contagion tests seem quite robust given relative large sample
    period of the non-crisis period but relative short sample period of the crisis

Cody PhD Conference 2012

  • 1.
    A New Testof Financial Contagion with Application to the US Banking Sector Cody Yu-Ling Hsiao Centre For Applied Macroeconomic Analysis Australian National University November 2012 Cody Hsiao () Contagion Tests 11/27 1 / 18
  • 2.
    Outline Motivations Research questions Contribution Statistics of co-kurtosis and co-volatility Contagion tests (testing for smile e¤ect) Application to the US banking sectors
  • 3.
    Motivations Smile e¤ect throughco-kurtosis channel Smile e¤ect is represented as the co-movements between return and return skewness (E (ri1 , rj3 ) and E (ri3 , rj1 )) turning from a negative relation to a positive relation in the crisis period Theoretically speculators invest in securities with a positive asset return and negative skewness in normal periods (Brunnermeier and Pedersen, 2008) Funding constraints lead to higher kurtosis and co-kurtosis risk
  • 4.
    Motivations Smile e¤ect throughco-volatility channel Smile e¤ect is represented as the co-movements between return volatility and return volatility turning from a negative relation to a positive relation in the crisis period Co-volatility (E (ri2 , rj2 )) is described as the relationship between return volatility and return volatility
  • 5.
    Research questions How to test for …nancial contagion (smile e¤ect) through co-kurtosis or co-volatility channels? Does …nancial contagion (smile e¤ect) through co-kurtosis or co-volatility channels really exist in the …nancial markets during the global …nancial crisis of 2008-2009?
  • 6.
    Contributions A new class of tests of …nancial contagion based on increases in co-kurtosis or co-volatility is proposed De…nition Contagion is de…ned as a signi…cant increase in the fourth order co-moments of two markets between a non-crisis and a crisis period This new approach is applied to test for …nancial contagion (smile e¤ect) in equity markets and banking sectors following the global …nancial crisis of 2008-2009
  • 7.
    Statistics of co-kurtosis A non-normal multivariate returns distribution is speci…ed The bivariate generalized exponential family of the distribution with the …rst form of co-kurtosis (Cokurtosis13 ), that is " 1 1 r1,t µ1 2 r2,t µ2 2 f (r1,t , r2,t ) = exp 2 + 2 1 ρ σ1 σ2 r1,t µ1 r2,t µ2 2ρ , σ1 σ2 # 1 3 r1,t µ1 r2,t µ2 +θ 7 η σ1 σ2 The Lagrangian multiplier statistic for co-kurtosis (LM1 ) is used to test for extremal dependence with restriction of θ 7 = 0 T 1 3 2 1 r1,t µ1b r2,t µ2b LM1 = T (18b2 +6 ) ρ ∑ b σ1 b σ2 T (3b) ρ t =1 Statistics of co-volatility is derived based on the LM test either
  • 8.
    Contagion Tests Extremal dependencetests Co-kurtosis and co-volatility are used for measuring extremal dependence The …rst type of statistic CK13 is to detect the shocks emanating from the asset returns of a source market i to the cubed returns of asset in a recipient market j. 0 12 B by (r 1 ,r 3 ) ξ b (r 1 ,r 3 ) C ξx i j CK13 (i ! j; ri1 , rj3 ) = @ s i 2j A 18b v +6 y jx i 18b2 +6 ρ Ty + Txx The second type of statistic CK31 is to measure the shocks transmitting from the cubed returns of asset in a source market i to the returns of asset in a recipient market j 0 12 B by (r 3 ,r 1 ) ξ b (r 3 ,r 1 ) C ξx i j CK31 (i ! j; ri3 , rj1 ) = @ s i 2j A 18b v +6 y jx i 18b2 +6 ρ Ty + Txx
  • 9.
    Contagion Tests Extremal dependencetests Ty m n b yi ,t µyi b yj ,t µyj b rm, rn = ξy i j 1 ∑ 3by jxi v Ty b σyi b σyj t =1 Tx m b xj ,t µxj n b rm, rn = 1 b xi ,t µxi ξx i j Tx ∑ b σxi b σxj (3bx ) , ρ t =1 and by ρ b vy jx = s 2 2 . i sy ,i sx ,i 1+ 2 (1 b2 ) ρy sx ,i b vy jx represents the adjusted correlation coe¢ cient proposed by Forbes i and Rigobon (2002). They consider that estimation of cross-market correlation coe¢ cients is biased due to heteroscedasticity in market returns.
  • 10.
    Contagion Tests Extremal dependencetests The third type of statistic CV22 is to detect the shocks transmitting from the volatility of asset returns in a source market i to the volatility of asset returns in a recipient market j. 0 12 B b ( ξy ri2 ,rj2 ) b r 2 ,r 2 ( ξx i j ) C CV22 (i ! j; ri2 , rj2 ) = @ s A 4b4 +16b2 +4 v v y jx i y jx i 4b4 +16b2 +4 ρ ρ Ty + x Tx x where Ty 2 2 b yi ,t µyi b yj ,t µyj b (r 2 , r 2 ) = ξy i j 1 ∑ v2 1 + 2by jxi Ty b σyi b σyj t =1 Tx 2 b xj ,t µxj 2 b (r 2 , r 2 ) b xi ,t µxi ξx i j = 1 Tx ∑ b σxi b σxj 1 + 2b2 ρx t =1
  • 11.
    Contagion Tests Extremal dependencetests To test that there is a signi…cant change in co-kurtosis or co-volatility between the non-crisis period and the crisis period, the null and alternative hypotheses are Ho : ξ y (rim , rjn ) ξ x (rim , rjn ) H1 : ξ y (rim , rjn ) > ξ x (rim , rjn ) Under the null hypothesis of no contagion, tests of contagion based on changes in co-kurtosis or co-volatility are asymptotically distributed as d CK13 , CK31 , CV22 (i ! j ) ! χ2 . 1
  • 12.
    Application to theUS banking sector The …nancial crisis of 2008-2009 is escalated into a global phenomenon The tests of contagion are applied to identify transmission channels through changes in extremal dependences during the global …nancial crisis of 2008-2009 Data The daily banking equity indices and equity indices are collected for four regions Asian region (Hong Kong and Korea), European region (France, Germany, the UK), Latin American region (Chile and Mexico), North American region (the US) The non-crisis period is chosen from April 1, 2005 to June 29, 2007 and the crisis period is from March 3, 2008 to August 31, 2009 A Vector Autoregressive (VAR) model is estimated in order to control for market fundamentals and handle the problems of serial correlation
  • 13.
    Application to theUS banking sector Contagion channel through extremal dependence Testing for contagion based on changes in extremal dependence during the global …nancial crisis of 2008-2009. Source market is the US banking sector (a) CK 13 : co-kurtosis contagion test with co-kurtosis measured in terms of 1 E (r US , r 3 ), (b) CK 31 : co-kurtosis contagion test with co-kurtosis measured in J 3 terms of E (r US , r 1 ), (c) CV 22 : co-volatility contagion test with co-volatility J 2 measured in terms of E (r US , r 2 ) J
  • 14.
    Conclusion A new test of …nancial contagion based on changes in co-kurtosis and co-volatility is proposed This new approach is applied to test for …nancial contagion in equity markets and banking sectors following the global …nancial crisis of 2008-2009 The results of the tests show that signi…cant contagion e¤ects (smile e¤ects) are widespread from the US banking sector to global equity markets and global banking sectors through one of the extremal dependence channels
  • 15.
  • 16.
    Further studies A joint test of contagion through the co-skewness channel A joint test of contagion through the co-kurtosis and co-volatility channel Selection of the period of crisis period could a¤ect the results of contagion Sensitivity tests given the di¤erent periods of the crisis period Markov switching model in contagion analysis (the crisis period are endogenously by the MS model)
  • 17.
    Finite sample properties Monte Carlo simulations are performed to calculate the critical values due to relative large sample period of the non-crisis period but relative short sample period of the crisis. To generate the asset returns in the simulation, the parameters are chosen for the following non-crisis and crisis variance-covariance matrices of returns in two equity market i and j as 0.557 0.143 29.195 14.350 Vx = , Vy = . 0.143 2.660 14.350 16.430
  • 18.
    Finite sample properties The size of non-crisis period is Tx = 585 and the size of crisis period is Ty = 391. α is signi…cant level. Based on 10,000 replications. Test statistics α = 0.025 α = 0.05 α = 0.1 CS 12 5.40 4.02 2.73 CS 21 4.91 3.81 2.70 CK 13 9.33 7.04 4.79 CK 31 9.28 7.00 4.81 CV 22 5.03 3.82 2.73 χ2 1 5.02 3.84 2.71 The statistics for contagion based on co-skewness and co-volatility present a good approximation of the …nite sample distribution The test statistics for contagion based on co-kurtosis tend to be biased The results of contagion tests seem quite robust given relative large sample period of the non-crisis period but relative short sample period of the crisis