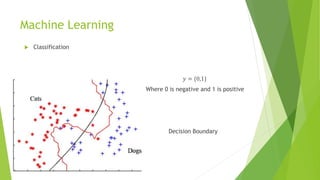
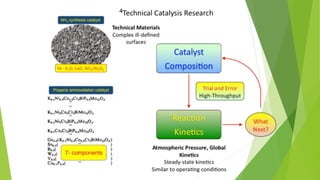
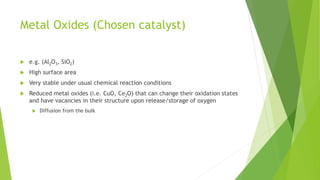
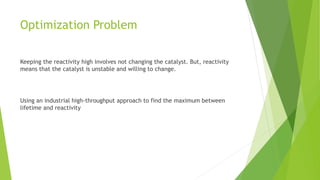
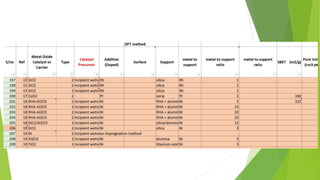
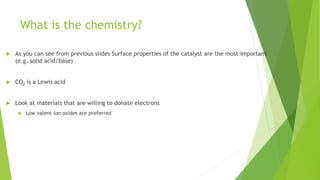
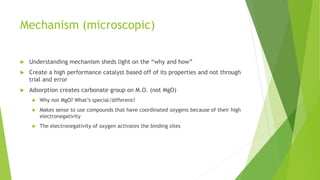
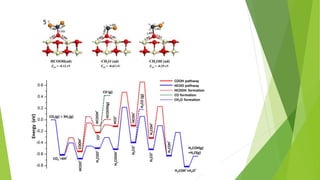
This document outlines research into catalyzing the hydrogenation of CO2 using metal oxides. It discusses the background and challenges, investigating the reaction mechanism and factors that influence catalyst performance. The research aims to understand the process at a microscopic level to optimize catalyst design without trial and error. Methods explored include comparing catalysts in a database, mapping electron density changes during reaction, and applying machine learning to understand structure-activity relationships. Future work involves further computational modeling and analysis to refine rate constants and transition state theory.


![% use ode45 first and then compare to ode15s, this is a 'stiff' problem
% (concentrations are changing at different time scales) so I want to
% measure the accuracy between the two
x0=0; xf=40; %start at time zero and go for 40 seconds
%assume 1:1 molar ratio of CO2 and H2 with the number active sites being 7
y0=[5 0 0 0 0 0 0 0 0 0 0 0 0 0 0 0 0 0 0 0 0 0 5 0 5]; %last point is active sites
options = odeset('RelTol',1e-3,'NonNegative',ones(25,1));
[x,y] = ode15s(@f,[x0 xf],y0,options);
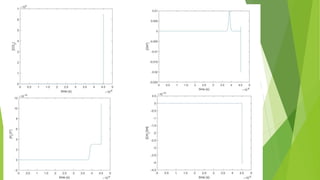
%plot methanol as a function of time
figure
plot(x,y(:,19))
xlabel('time (s)')
ylabel('[CH_3OH]')
%plot adsorbed hrdroxyl
figure
plot(x,y(:,20))
xlabel('time (s)')
ylabel('[OH*]')
%adsorbed water
figure
plot(x,y(:,21))
xlabel('time (s)')](https://image.slidesharecdn.com/e83a3014-799b-4022-b697-92712ee2653e-160225032627/85/CO2-Presentation-29-320.jpg)
![function dC = f(~,y)
% all rate constants are in INVERSE SECONDS
global ratesk
load myparam
% ratesk = [1.95e4 3.23e1
% 2.67e4 5.19e4
% 6.31e3 3.13e5
% 3.11e1 1.78e2
% 2.17e3 4.21e3
% 1.02e1 3.57e3
% 4.24e6 3.82e6
% 3.82e-3 1.31e-2
% 7.33e-4 5.41e-5
% 6.55e-2 8.21e-4
% 3.91e4 3.55e2
% 5.11e3 8.26e5
% 7.63e3 5.19e2
% 4.55e-4 1.98e-2
% 1.02e1 2.82e3
% 3.76e1 5.43e-1
% 9.21 2.13e-1
% 8.33e1 4.08e2
% 5.91e-3 3.41e-5
% 7.32e2 2.45e2
% 5.89e1 2.87e1];](https://image.slidesharecdn.com/e83a3014-799b-4022-b697-92712ee2653e-160225032627/85/CO2-Presentation-30-320.jpg)