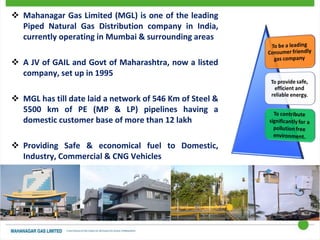
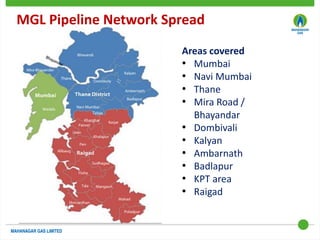
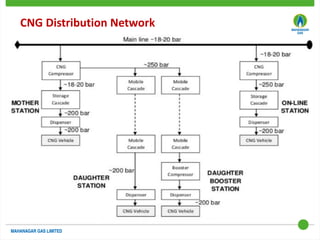
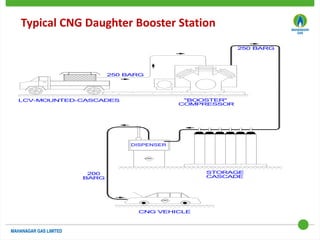
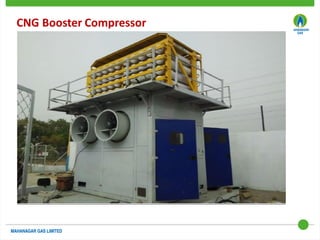
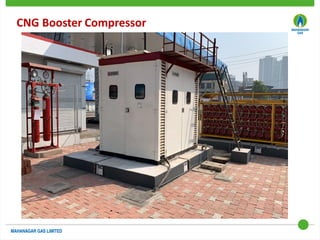
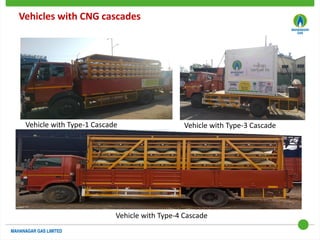
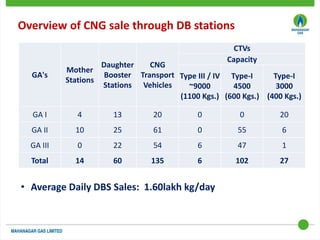
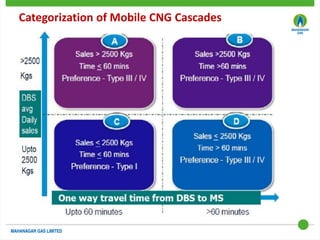
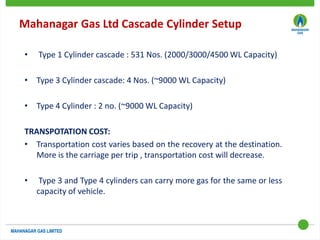
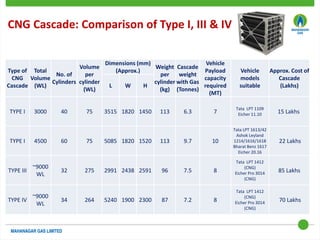
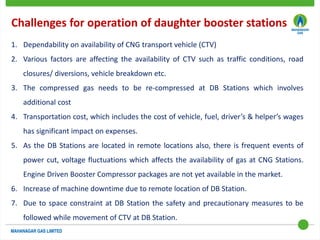
A presentation
on
Daughter Booster stations, CNG
Transportation and operational
Challenges
 Mahanagar Gas Limited (MGL) is one of the leading
Piped Natural Gas Distribution company in India,
currently operating in Mumbai & surrounding areas
 A JV of GAIL and Govt of Maharashtra, now a listed
company, set up in 1995
 MGL has till date laid a network of 546 Km of Steel &
5500 km of PE (MP & LP) pipelines having a
domestic customer base of more than 12 lakh
 Providing Safe & economical fuel to Domestic,
Industry, Commercial & CNG Vehicles
 ISO 9001 and ISO 45001 Certified
MGL Pipeline Network Spread
Areas covered
• Mumbai
• Navi Mumbai
• Thane
• Mira Road /
Bhayandar
• Dombivali
• Kalyan
• Ambarnath
• Badlapur
• KPT area
• Raigad
CNG Distribution Network
250 BARG
250 BARG
LCV-MOUNTED-CASCADES "BOOSTER"
COMPRESSOR
STORAGE
CASCADE
200
BARG
CNG VEHICLE
Typical CNG Daughter Booster Station
CNG Booster Compressor
P&ID of Booster Compressor
Suction Pressure V/s Compression Capacity Curve
Inlet Pressure V/s Energy Consumption Curve
Vehicles with CNG cascades
Vehicle with Type-1 Cascade Vehicle with Type-3 Cascade
Vehicle with Type-4 Cascade
Overview of CNG sale through DB stations
GA's
Mother
Stations
Daughter
Booster
Stations
CNG
Transport
Vehicles
CTVs
Capacity
Type III / IV
~9000
(1100 Kgs.)
Type-I
4500
(600 Kgs.)
Type-I
3000
(400 Kgs.)
GA I 4 13 20 0 0 20
GA II 10 25 61 0 55 6
GA III 0 22 54 6 47 1
Total 14 60 135 6 102 27
• Average Daily DBS Sales: 1.60lakh kg/day
Categorization of Mobile CNG Cascades
Mahanagar Gas Ltd Cascade Cylinder Setup
• Type 1 Cylinder cascade : 531 Nos. (2000/3000/4500 WL Capacity)
• Type 3 Cylinder cascade: 4 Nos. (~9000 WL Capacity)
• Type 4 Cylinder : 2 no. (~9000 WL Capacity)
TRANSPOTATION COST:
• Transportation cost varies based on the recovery at the destination.
More is the carriage per trip , transportation cost will decrease.
• Type 3 and Type 4 cylinders can carry more gas for the same or less
capacity of vehicle.
Comparison of types of CNG cylinders
Description Type-I Type-III Type-IV
Material of construction of
cylinders
All steel
All carbon full wrap metallic
liner
Fiberglass/carbon full wrap,
Plastic liner (HDPE)
Design codes
Steel - EN 1964 & ISO 9809 EN 12245 EN 12245
Aluminium - ISO 7866 ISO 11119-2 ISO 11119-3
Weight of CNG cylinders
(kg/litre)
Modified CrMo Steel - 0.72
kg/litre
Aluminum & Carbon Fibre -
0.41 kg/litre
HDPE/Carbon fibre based -
0.31 kg/litre
% Weight reduction -10% -50% -60%
Lifetime
20 years
Hydraulic Pressure test every
3 years
20 years
Hydraulic Pressure test
every 3 years
20 years
Hydraulic Pressure test every 3
years
Corrosion (Internal) High Low Very Low
Safety
Pressure build up will lead to
explosion
Pressure build up will lead
to rupture
Pressure build up will lead to
rupture
CNG Cascade: Comparison of Type I, III & IV
Type of
CNG
Cascade
Total
Volume
(WL)
No. of
Cylinders
Volume
per
cylinder
(WL)
Dimensions (mm)
(Approx.)
Weight
per
cylinder
(kg)
Cascade
weight
with Gas
(Tonnes)
Vehicle
Payload
capacity
required
(MT)
Vehicle
models
suitable
Approx. Cost of
Cascade
(Lakhs)
L W H
TYPE I 3000 40 75 3515 1820 1450 113 6.3 7
Tata LPT 1109
Eicher 11.10 15 Lakhs
TYPE I 4500 60 75 5085 1820 1520 113 9.7 10
Tata LPT 1613/42
Ashok Leyland
1214/1616/1618
Bharat Benz 1617
Eicher 20.16
22 Lakhs
TYPE III
~9000
WL
32 275 2991 2438 2591 96 7.5 8
Tata LPT 1412
(CNG)
Eicher Pro 3014
(CNG)
85 Lakhs
TYPE IV
~9000
WL
34 264 5240 1900 2300 87 7.2 8
Tata LPT 1412
(CNG)
Eicher Pro 3014
(CNG)
70 Lakhs
 Advantages of Type III & IV
 Higher Gas carrying capacity, significant savings in transportation cost
 Corrosion free, less prone to leakages
 Safe operations
 Limitations of Type III & IV
 Higher capacity cascade requires more space at CNG stations as per OISD
Guidelines
 High Initial cost
 Limited Type III/Type IV cylinder manufacturers are available in India
Type 3/ Type 4 cylinders
CTV Monitoring methodology
IVMS WEBSITE
(VEHICLE LOCATION –
STATUS)
CTV SOFTWARE
(STOCK STATUS)
SCADA SERVER
(PRESSURE STATUS)
1. CTV Software outcome of Stock Status is used to check requirement of CTV Diversion
2. Verification of SCADA Pressure & Software stock is done to check accuracy of Stock
3. IVMS is used to check Vehicle location/direction & accordingly conveyed to DBS
19
© 2019 KPMG Advisory Services Private Limited,an Indian private limited company and a member firm of the KPMG network of independentmember firms affiliatedwith KPMG InternationalCooperative,a Swiss entity. All rights reserved.
Document Classification: KPMG Confidential
CTV Network Optimization
MS-1
MS-n
MS-3
MS-2
Filling point
Filling
point
** All distances and time are illustrative
20
© 2019 KPMG Advisory Services Private Limited,an Indian private limited company and a member firm of the KPMG network of independentmember firms affiliatedwith KPMG InternationalCooperative,a Swiss entity. All rights reserved.
Document Classification: KPMG Confidential
CTV Network Optimization: Key Considerations
Stock-Outs at DBS
Long CTV waiting
time at DBS
Sub-Optimal
utilization of 2000
km contract limit
Lack of visibility of available CNG at DBS on a real-
time basis
Difficulty in predicting stock-out time at DBS
Difficulty in optimal allocation and scheduling of
CTVs on a ‘minimized cost basis’
Key Challenges Reasons for these challenges Proposed Solution
DBS Stock-Out
Prediction
Decision Support
System / Advisor for
allocation and
scheduling
Forecasting
Optimization
Schedule Advisor Software
21
© 2019 KPMG Advisory Services Private Limited,an Indian private limited company and a member firm of the KPMG network of independentmember firms affiliatedwith KPMG InternationalCooperative,a Swiss entity. All rights reserved.
Document Classification: KPMG Confidential
CTV Network Optimization: Increase forecast visibility
to improve planning
FORECASTING FRAMEWORK
Use of Historical SCADA data: This will be used to understand historical
consumption pattern at each of the DBS using factors such as season,
month, day of week, time of day etc.
Use of Real Time SCADA Data: This will leverage latest consumption
pattern at each DBS (last 2-3 hours). This data may have time lag of ~15
mins. This along with trends identified from historical data will help
forecast stock-out times at each DBS.
Model Building: Models developed using time series and causal models
Key Objective: Forecasting the time of stock-out at each DBS
22
© 2019 KPMG Advisory Services Private Limited,an Indian private limited company and a member firm of the KPMG network of independentmember firms affiliatedwith KPMG InternationalCooperative,a Swiss entity. All rights reserved.
Document Classification: KPMG Confidential
CTV Network Optimization: Information and
Analytics Architecture
 Predefined routes: CTV routes are predefined post route risk assessment. CTV drivers are not allowed to take any diversions without
prior approval from Transport team.
 Limitation of switching CTV routes: CTVs are contracted under Km slab terms. There is less flexibility of changing the CTVs between
different routes.
 Restrictions of heavy vehicle movements: Restrictions by Traffic Department on movement of heavy vehicles in certain areas like
expressways further restricts CTV movement.
Data
from
dispensers
SCADA Forecasting Model DBS Dry-out Time
Optimization Model
IVMS
Data from CTV tracker
Constraints
Optimized CTV scheduling
and monitoring
Forecasting model will use SCADA
data for forecasting stock out time
FM will help in identification of
stock levels in various DBS
Vehicle data, stock (NG) forecast will
be used to optimize CTV movement
Dynamic scheduling of CTV
movement and monitoring
Inlet pressure of dispenser
Time stamp
CTV current location
Geo fencing status
Ignition Status
CTV moving status
Illustrative
REPORT GENERATION
Mother Station Reports:
Waiting Time at MS
Vehicle Status at MS
Average filling time of a CTV at MS
Average number of vehicles getting
filled at MS
Total number of vehicles filled at MS
Total number of trips at DBS/MS across
time & date range
Daughter Booster Station Reports:
Stock status at DBS
Peak vs Non-peak demand at all DBS
Route Reports:
Traffic Status
Rerouting
Estimated Travel Time
CTV Reports:
Daily/Monthly Schedule of CTV
Planned vs Actual Distance Travelled
Notifications:
DBS stock levels
Travel time of CTVs
Standing time of CTVs at MS
Challenges for operation of daughter booster stations
1. Dependability on availability of CNG transport vehicle (CTV)
2. Various factors are affecting the availability of CTV such as traffic conditions, road
closures/ diversions, vehicle breakdown etc.
3. The compressed gas needs to be re-compressed at DB Stations which involves
additional cost
4. Transportation cost, which includes the cost of vehicle, fuel, driver’s & helper’s wages
has significant impact on expenses.
5. As the DB Stations are located in remote locations also, there is frequent events of
power cut, voltage fluctuations which affects the availability of gas at CNG Stations.
Engine Driven Booster Compressor packages are not yet available in the market.
6. Increase of machine downtime due to remote location of DB Station.
7. Due to space constraint at DB Station the safety and precautionary measures to be
followed while movement of CTV at DB Station.
Actions taken to reduce dry-out instances
1. CTV Software outcomes utilized for CTV diversion to mitigate dry-out scenarios.
2. Visits to Mother Station to understand idle time by witnessing filling cycles.
3. Deployment of CTV supervisors at Mother station to identify and control the delays
occurred by CTV Drivers & Helpers.
4. Visits by CTV Engineer at DBS due to repeated dry outs to analyze stationary cascade
usage & shortcomings during CTV movement.
5. Scheduled maintenances of DBS & MS are planned on weekends to avoid impact on
sales.
6. Implemented live pressure tracking of Mobile Cascades at DB stations for effective
allocation of CTV’s to reduce dry-outs.
CNG NETWORK PPT.pdf

CNG NETWORK PPT.pdf

  • 1.
    A presentation on Daughter Boosterstations, CNG Transportation and operational Challenges
  • 2.
     Mahanagar GasLimited (MGL) is one of the leading Piped Natural Gas Distribution company in India, currently operating in Mumbai & surrounding areas  A JV of GAIL and Govt of Maharashtra, now a listed company, set up in 1995  MGL has till date laid a network of 546 Km of Steel & 5500 km of PE (MP & LP) pipelines having a domestic customer base of more than 12 lakh  Providing Safe & economical fuel to Domestic, Industry, Commercial & CNG Vehicles  ISO 9001 and ISO 45001 Certified
  • 3.
    MGL Pipeline NetworkSpread Areas covered • Mumbai • Navi Mumbai • Thane • Mira Road / Bhayandar • Dombivali • Kalyan • Ambarnath • Badlapur • KPT area • Raigad
  • 4.
  • 5.
    250 BARG 250 BARG LCV-MOUNTED-CASCADES"BOOSTER" COMPRESSOR STORAGE CASCADE 200 BARG CNG VEHICLE Typical CNG Daughter Booster Station
  • 6.
  • 7.
  • 8.
    P&ID of BoosterCompressor
  • 9.
    Suction Pressure V/sCompression Capacity Curve
  • 10.
    Inlet Pressure V/sEnergy Consumption Curve
  • 11.
    Vehicles with CNGcascades Vehicle with Type-1 Cascade Vehicle with Type-3 Cascade Vehicle with Type-4 Cascade
  • 12.
    Overview of CNGsale through DB stations GA's Mother Stations Daughter Booster Stations CNG Transport Vehicles CTVs Capacity Type III / IV ~9000 (1100 Kgs.) Type-I 4500 (600 Kgs.) Type-I 3000 (400 Kgs.) GA I 4 13 20 0 0 20 GA II 10 25 61 0 55 6 GA III 0 22 54 6 47 1 Total 14 60 135 6 102 27 • Average Daily DBS Sales: 1.60lakh kg/day
  • 13.
  • 14.
    Mahanagar Gas LtdCascade Cylinder Setup • Type 1 Cylinder cascade : 531 Nos. (2000/3000/4500 WL Capacity) • Type 3 Cylinder cascade: 4 Nos. (~9000 WL Capacity) • Type 4 Cylinder : 2 no. (~9000 WL Capacity) TRANSPOTATION COST: • Transportation cost varies based on the recovery at the destination. More is the carriage per trip , transportation cost will decrease. • Type 3 and Type 4 cylinders can carry more gas for the same or less capacity of vehicle.
  • 15.
    Comparison of typesof CNG cylinders Description Type-I Type-III Type-IV Material of construction of cylinders All steel All carbon full wrap metallic liner Fiberglass/carbon full wrap, Plastic liner (HDPE) Design codes Steel - EN 1964 & ISO 9809 EN 12245 EN 12245 Aluminium - ISO 7866 ISO 11119-2 ISO 11119-3 Weight of CNG cylinders (kg/litre) Modified CrMo Steel - 0.72 kg/litre Aluminum & Carbon Fibre - 0.41 kg/litre HDPE/Carbon fibre based - 0.31 kg/litre % Weight reduction -10% -50% -60% Lifetime 20 years Hydraulic Pressure test every 3 years 20 years Hydraulic Pressure test every 3 years 20 years Hydraulic Pressure test every 3 years Corrosion (Internal) High Low Very Low Safety Pressure build up will lead to explosion Pressure build up will lead to rupture Pressure build up will lead to rupture
  • 16.
    CNG Cascade: Comparisonof Type I, III & IV Type of CNG Cascade Total Volume (WL) No. of Cylinders Volume per cylinder (WL) Dimensions (mm) (Approx.) Weight per cylinder (kg) Cascade weight with Gas (Tonnes) Vehicle Payload capacity required (MT) Vehicle models suitable Approx. Cost of Cascade (Lakhs) L W H TYPE I 3000 40 75 3515 1820 1450 113 6.3 7 Tata LPT 1109 Eicher 11.10 15 Lakhs TYPE I 4500 60 75 5085 1820 1520 113 9.7 10 Tata LPT 1613/42 Ashok Leyland 1214/1616/1618 Bharat Benz 1617 Eicher 20.16 22 Lakhs TYPE III ~9000 WL 32 275 2991 2438 2591 96 7.5 8 Tata LPT 1412 (CNG) Eicher Pro 3014 (CNG) 85 Lakhs TYPE IV ~9000 WL 34 264 5240 1900 2300 87 7.2 8 Tata LPT 1412 (CNG) Eicher Pro 3014 (CNG) 70 Lakhs
  • 17.
     Advantages ofType III & IV  Higher Gas carrying capacity, significant savings in transportation cost  Corrosion free, less prone to leakages  Safe operations  Limitations of Type III & IV  Higher capacity cascade requires more space at CNG stations as per OISD Guidelines  High Initial cost  Limited Type III/Type IV cylinder manufacturers are available in India Type 3/ Type 4 cylinders
  • 18.
    CTV Monitoring methodology IVMSWEBSITE (VEHICLE LOCATION – STATUS) CTV SOFTWARE (STOCK STATUS) SCADA SERVER (PRESSURE STATUS) 1. CTV Software outcome of Stock Status is used to check requirement of CTV Diversion 2. Verification of SCADA Pressure & Software stock is done to check accuracy of Stock 3. IVMS is used to check Vehicle location/direction & accordingly conveyed to DBS
  • 19.
    19 © 2019 KPMGAdvisory Services Private Limited,an Indian private limited company and a member firm of the KPMG network of independentmember firms affiliatedwith KPMG InternationalCooperative,a Swiss entity. All rights reserved. Document Classification: KPMG Confidential CTV Network Optimization MS-1 MS-n MS-3 MS-2 Filling point Filling point ** All distances and time are illustrative
  • 20.
    20 © 2019 KPMGAdvisory Services Private Limited,an Indian private limited company and a member firm of the KPMG network of independentmember firms affiliatedwith KPMG InternationalCooperative,a Swiss entity. All rights reserved. Document Classification: KPMG Confidential CTV Network Optimization: Key Considerations Stock-Outs at DBS Long CTV waiting time at DBS Sub-Optimal utilization of 2000 km contract limit Lack of visibility of available CNG at DBS on a real- time basis Difficulty in predicting stock-out time at DBS Difficulty in optimal allocation and scheduling of CTVs on a ‘minimized cost basis’ Key Challenges Reasons for these challenges Proposed Solution DBS Stock-Out Prediction Decision Support System / Advisor for allocation and scheduling Forecasting Optimization Schedule Advisor Software
  • 21.
    21 © 2019 KPMGAdvisory Services Private Limited,an Indian private limited company and a member firm of the KPMG network of independentmember firms affiliatedwith KPMG InternationalCooperative,a Swiss entity. All rights reserved. Document Classification: KPMG Confidential CTV Network Optimization: Increase forecast visibility to improve planning FORECASTING FRAMEWORK Use of Historical SCADA data: This will be used to understand historical consumption pattern at each of the DBS using factors such as season, month, day of week, time of day etc. Use of Real Time SCADA Data: This will leverage latest consumption pattern at each DBS (last 2-3 hours). This data may have time lag of ~15 mins. This along with trends identified from historical data will help forecast stock-out times at each DBS. Model Building: Models developed using time series and causal models Key Objective: Forecasting the time of stock-out at each DBS
  • 22.
    22 © 2019 KPMGAdvisory Services Private Limited,an Indian private limited company and a member firm of the KPMG network of independentmember firms affiliatedwith KPMG InternationalCooperative,a Swiss entity. All rights reserved. Document Classification: KPMG Confidential CTV Network Optimization: Information and Analytics Architecture  Predefined routes: CTV routes are predefined post route risk assessment. CTV drivers are not allowed to take any diversions without prior approval from Transport team.  Limitation of switching CTV routes: CTVs are contracted under Km slab terms. There is less flexibility of changing the CTVs between different routes.  Restrictions of heavy vehicle movements: Restrictions by Traffic Department on movement of heavy vehicles in certain areas like expressways further restricts CTV movement. Data from dispensers SCADA Forecasting Model DBS Dry-out Time Optimization Model IVMS Data from CTV tracker Constraints Optimized CTV scheduling and monitoring Forecasting model will use SCADA data for forecasting stock out time FM will help in identification of stock levels in various DBS Vehicle data, stock (NG) forecast will be used to optimize CTV movement Dynamic scheduling of CTV movement and monitoring Inlet pressure of dispenser Time stamp CTV current location Geo fencing status Ignition Status CTV moving status Illustrative
  • 23.
    REPORT GENERATION Mother StationReports: Waiting Time at MS Vehicle Status at MS Average filling time of a CTV at MS Average number of vehicles getting filled at MS Total number of vehicles filled at MS Total number of trips at DBS/MS across time & date range Daughter Booster Station Reports: Stock status at DBS Peak vs Non-peak demand at all DBS Route Reports: Traffic Status Rerouting Estimated Travel Time CTV Reports: Daily/Monthly Schedule of CTV Planned vs Actual Distance Travelled Notifications: DBS stock levels Travel time of CTVs Standing time of CTVs at MS
  • 24.
    Challenges for operationof daughter booster stations 1. Dependability on availability of CNG transport vehicle (CTV) 2. Various factors are affecting the availability of CTV such as traffic conditions, road closures/ diversions, vehicle breakdown etc. 3. The compressed gas needs to be re-compressed at DB Stations which involves additional cost 4. Transportation cost, which includes the cost of vehicle, fuel, driver’s & helper’s wages has significant impact on expenses. 5. As the DB Stations are located in remote locations also, there is frequent events of power cut, voltage fluctuations which affects the availability of gas at CNG Stations. Engine Driven Booster Compressor packages are not yet available in the market. 6. Increase of machine downtime due to remote location of DB Station. 7. Due to space constraint at DB Station the safety and precautionary measures to be followed while movement of CTV at DB Station.
  • 25.
    Actions taken toreduce dry-out instances 1. CTV Software outcomes utilized for CTV diversion to mitigate dry-out scenarios. 2. Visits to Mother Station to understand idle time by witnessing filling cycles. 3. Deployment of CTV supervisors at Mother station to identify and control the delays occurred by CTV Drivers & Helpers. 4. Visits by CTV Engineer at DBS due to repeated dry outs to analyze stationary cascade usage & shortcomings during CTV movement. 5. Scheduled maintenances of DBS & MS are planned on weekends to avoid impact on sales. 6. Implemented live pressure tracking of Mobile Cascades at DB stations for effective allocation of CTV’s to reduce dry-outs.