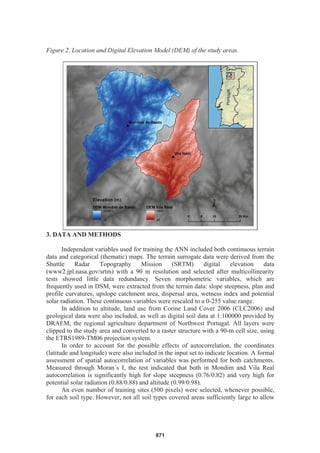
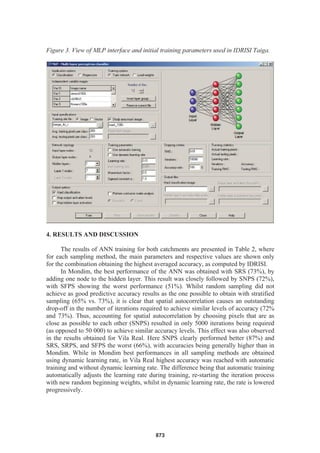
SlideShare a Scribd company logo
1 of 10
Download to read offline
THE IMPORTANCE OF SAMPLING FOR THE EFFICIENCY OF
ARTIFICIAL NEURAL NETWORKS IN DIGITAL SOIL MAPPING
FREIRE, SÉRGIO
e-GEO, Centro de Estudos de Geografia e Planeamento Regional, Faculdade de
Ciências Sociais e Humanas da Universidade Nova de Lisboa.
sfreire@fcsh.unl.pt
FONSECA, INÊS
Centro de Estudos Geográficos, Universidade de Lisboa, Alameda da Universidade.
BRASIL, RICARDO
Centro de Estudos Geográficos, Universidade de Lisboa, Alameda da Universidade.
ROCHA, JORGE
Centro de Estudos Geográficos, Universidade de Lisboa, Alameda da Universidade.
TENEDÓRIO, JOSÉ A.
e-GEO, Centro de Estudos de Geografia e Planeamento Regional, Faculdade de
Ciências Sociais e Humanas da Universidade Nova de Lisboa.
Abstract
In Portugal, soil mapping remains incomplete, and there are also significant
problems with the existing cartography. Digital Soil Mapping uses advanced computer-
based techniques such as Artificial Neural Networks (ANN) for mapping soil classes in
a cheaper, more consistent and flexible way, using surrogate landscape data. This work
used five different training sets to evaluate the impact that sampling has on the
predictive accuracy of ANNs. The testes were carried out in IDRISI Taiga for two
catchments in northern Portugal, using an ANN method known as multi-layer
perceptron. Results show that sampling design is very important for the accuracy of soil
mapping with ANNs.
Keywords: Digital Soil Mapping, AutoMAPticS, IDRISI Taiga, Mondim de Basto,
Vila Real
Resumo
A IMPORTÂNCIA DA AMOSTRAGEM NA EFICIÊNCIA DE REDES
NEURONAIS ARTIFICIAIS EM CARTOGRAFIA DIGITAL DE SOLOS.
Portugal não dispõe ainda de uma cobertura completa e harmonizada de cartas de
solos. A cartografia automática de solos utiliza técnicas digitais avançadas como as
Redes Neuronais Artificiais (RNA) para prever a distribuição espacial de tipos de solos
de forma mais económica e consistente, usando variáveis responsáveis pela formação e
desenvolvimento dos solos. Neste trabalho são usadas cinco amostras para avaliar o
impacto que diferentes métodos de amostragem têm na exactidão da modelação por uma
RNA. O teste realizou-se em IDRISI Taiga para duas bacias no Norte de Portugal, com
recurso ao método multi-layer perceptron. Verificou-se que a amostragem é
determinante para a performance da RNA.
867
Palavras-chave: cartografia digital de solos, AutoMAPticS, IDRISI Taiga, Mondim de
Basto, Vila Real
1. INTRODUCTION
Soils are an important non-renewable resource crucial for human activities
(POTOCNIK & DIMAS, 2005). By supporting valuable services, such as food
production, biodiversity, and pollution buffering, soils play a fundamental role in
sustainable land use. The simple absence of soil information adds to the uncertainties of
predicting food production, and lack of reliable and harmonized soil data has
considerably hampered land degradation assessments, environmental impact studies and
adapted sustainable land management interventions (MULLER & NILSSON, 2009).
Although soil surveys have been carried out in many countries, the scale and area
coverage of resulting soil maps are not ideal for planning applications at national level
(DOBOS et al., 2006). Additionally, there is a lack of consistency between soil
classifications and legends across countries, which contributes towards a slow
progression in integrating soil datasets, even in Europe (ESBN, 2005).
Portugal, like most European Union member states, only has a fraction of its
territory covered with soil maps at semi-detailed or reconnaissance scales
(MCBRATNEY et al., 2003). While 55% of continental Portugal has soil maps at
1:50000 produced by traditional methods of soil survey before the 1970s, only about
40% of the territory has more recent soil map coverage at 1:100000 with some degree
of overlap (Figure 1). Thus, not only the published coverage remains incomplete, but
there are also significant problems with the existing cartography. There is a lack of
cartographic uniformity between the different regions: (1) scales are different, (2) four
different taxonomic systems were used, and (3) the framework behind the mapping of
soil units at the two scales is different: the 1:100000 maps have a physiographic basis
whereas the 1:50000 maps have a taxonomic basis. Moreover, using taxonomy as the
basis of map design often results in high intra-unit variability of soil properties
(MULLA & MCBRATNEY, 2000) and limited correlation between soil type and soil
hydrologic parameters (WESTERN & GRAYSON, 2000). Therefore, only 43% of the
area of Portugal has high standards of soil cartography.
868
Figure 1. Scale and legends of regional soil maps of continental Portugal.
In order to bridge the gap between existing soil maps based on traditional soil
survey and the increasing demand for soil information, the technique of Digital Soil
Mapping (DSM) has been developed for mapping soil classes and/or soil properties
(DOBOS et al., 2006). By combining computer-based technologies such as
Geographical Information Systems (GIS) with advanced techniques such as Artificial
Neural Networks (ANN) and Fuzzy Logic (FL), DSM has enabled mapping the spatial
distribution of soils in a cheaper, more consistent and flexible way, using surrogate
landscape data. Thus, ANN models provide the means to predict soil types at locations
without soil spatial data by combining existing soil maps with landscape features known
to be responsible for the spatial variation of soils (MCBRATNEY et al., 2003). The
process uses a set of variables related to soil forming factors and the respective soil type
as training data for the ANN, which constructs rules (TSO & MATHER, 2001) that can
be extended to the unmapped areas.
Whilst the literature provides a number of examples where DSM is presented as
an efficient mapping technique (e.g., ZHU, 2000; BEHRENS et al., 2005; CARVALHO
JÚNIOR et al., 2011) and soil spatial variation is shown to be induced by a limited
number of soil forming factors (MORA-VALLEJO et al., 2008), still little is known
about the impact that the training sites have on the predictive accuracy of the models.
The sampling method and location of training sites appears particularly important
for ANNs because their rate of learning, convergence to a solution, network
performance and ability to generalize depend on the efficiency of the layout of the
sampling pattern which, in turn, depends on the presence of spatial periodicity of the
phenomena. Despite the fact that all environmental variables exhibit spatial
autocorrelation at some scale (ENGLUND, 1988), high values found in the spatial
distribution of the variables used to train an ANN is likely to affect is performance.
869
Therefore, in applying ANN for DSM, the likelihood that the sampling design used to
select training areas has a relevant effect on the classification effectiveness is our main
hypothesis. Hence, some of the main objectives of AutoMAPticS (Automatic Mapping
of Soils), a research project carried out at national level and based on the development
of artificial neural network (ANN) models, are to (i) predict soil classes in currently
unmapped areas of mainland Portugal, and (ii) harmonize soil legends across regions
with distinct soil mapping classifications, using Portuguese and Spanish soil spatial
datasets to a) improve the level of transnational data integration and b) assess existing
data.
The present work aims at evaluating the impact that different sampling
approaches used to select training areas for an ANN have on their predictive accuracy.
2. STUDY AREA
In order to assess the impact of sampling, two study areas in northern Portugal
were selected: a catchment in Mondim de Basto (Rio Tâmega), in the Douro-Minho
region (911 km2
), and another in Vila Real (Rio Corgo) in the Northeast region (468
km2
) as shown in Figure 2.
These catchments were chosen because they present diverse geomorphological
and ecological characteristics and include soil types that are well representative of those
found in each respective region. Soil types occurring in Mondim include Anthrosols,
Fluvisols, Leptosols, and Regosols, while those in Vila Real include Anthrosols,
Cambisols, Fluvisols, and Leptosols.
870
Figure 2. Location and Digital Elevation Model (DEM) of the study areas.
3. DATA AND METHODS
Independent variables used for training the ANN included both continuous terrain
data and categorical (thematic) maps. The terrain surrogate data were derived from the
Shuttle Radar Topography Mission (SRTM) digital elevation data
(www2.jpl.nasa.gov/srtm) with a 90 m resolution and selected after multicollinearity
tests showed little data redundancy. Seven morphometric variables, which are
frequently used in DSM, were extracted from the terrain data: slope steepness, plan and
profile curvatures, upslope catchment area, dispersal area, wetness index and potential
solar radiation. These continuous variables were rescaled to a 0-255 value range.
In addition to altitude, land use from Corine Land Cover 2006 (CLC2006) and
geological data were also included, as well as digital soil data at 1:100000 provided by
DRAEM, the regional agriculture department of Northwest Portugal. All layers were
clipped to the study area and converted to a raster structure with a 90-m cell size, using
the ETRS1989-TM06 projection system.
In order to account for the possible effects of autocorrelation, the coordinates
(latitude and longitude) were also included in the input set to indicate location. A formal
assessment of spatial autocorrelation of variables was performed for both catchments.
Measured through Moran´s I, the test indicated that both in Mondim and Vila Real
autocorrelation is significantly high for slope steepness (0.76/0.82) and very high for
potential solar radiation (0.88/0.88) and altitude (0.99/0.98).
An even number of training sites (500 pixels) were selected, whenever possible,
for each soil type. However, not all soil types covered areas sufficiently large to allow
871
the selection of the same number of pixels. Thus, 1689 pixels (out of 112 416) were
selected in Mondim and 2040 (out of 57 788) were selected in Vila Real. For their
selection, two different sampling strategies were implemented. The ANN was trained by
presenting it a number of different examples of the same soil type drawn either (i)
randomly (RS), or (ii) in a stratified fashion (SS). For the latter, training pixel vectors
were located by choosing (a) random coordinates within soil types strata (SRS), (b)
random coordinates within soil types and chosen evenly in the frequency space (SRPS),
(c) nearest coordinates within soil types and chosen evenly in the frequency space
(SNPS), and (d) farthest coordinates within soil types and chosen evenly in the
frequency space (SFPS).
The neural network was trained in IDRISI Taiga (Clark Labs), using a highly
popular supervised method known as multi-layer perceptron (MLP), run in hard
classification mode. The MLP classifier is based on the back-propagation algorithm
(HAYKIN, 1999). The experimental setup for each training set used the default
specifications presented in Table 1 as initial values.
Table 1. Characteristics and parameters of the ANN MLP in IDRISI Taiga.
MLP parameters
Group Parameter Default value
Input specifications Avrg. training pixels per class 200 / 250
Avrg. testing pixels per class 200 / 250
Network topology Hidden layers 1
Layer 1 nodes 7
Training parameters Automatic training no
Dynamic learning rate no
Learning rate 0.01
End learning rate 0.001
Momentum factor 0.5
Sigmoid constant “a” 1
Stopping criteria RMS 0.01
Iterations 10000
Accuracy rate 100%
In the Mondim catchment, an average of 200 pixels per class were used for
training and testing, while 250 were used for Vila Real, due to constraints in the total
area covered by some soil types. Some of these parameters were progressively changed
and the network performance monitored, namely: number of layer 1 nodes, use of
automatic training, use of dynamic learning rate, and number of iterations (maximum of
100 000). Training ended when one of the stopping criteria was achieved: either a
RMSE ” 0.01, an accuracy of 100%, or the defined maximum number of iterations.
Therefore the default neural network included 12 input layer nodes, 4 output layer
nodes, and one hidden layer with 7 nodes (see Figure 3).
In a study area, for a given combination of sampling method and parameters,
results of different runs can vary due to different seeding of training pixels. Thus, five
model runs were performed for each combination, in order to average their accuracies,
as calculated by IDRISI.
872
Figure 3. View of MLP interface and initial training parameters used in IDRISI Taiga.
4. RESULTS AND DISCUSSION
The results of ANN training for both catchments are presented in Table 2, where
for each sampling method, the main parameters and respective values are shown only
for the combination obtaining the highest averaged accuracy, as computed by IDRISI.
In Mondim, the best performance of the ANN was obtained with SRS (73%), by
adding one node to the hidden layer. This result was closely followed by SNPS (72%),
with SFPS showing the worst performance (51%). Whilst random sampling did not
achieve as good predictive accuracy results as the one possible to obtain with stratified
sampling (65% vs. 73%), it is clear that spatial autocorrelation causes an outstanding
drop-off in the number of iterations required to achieve similar levels of accuracy (72%
and 73%). Thus, accounting for spatial autocorrelation by choosing pixels that are as
close as possible to each other (SNPS) resulted in only 5000 iterations being required
(as opposed to 50 000) to achieve similar accuracy levels. This effect was also observed
in the results obtained for Vila Real. Here SNPS clearly performed better (87%) and
SRS, SRPS, and SFPS the worst (66%), with accuracies being generally higher than in
Mondim. While in Mondim best performances in all sampling methods are obtained
using dynamic learning rate, in Vila Real highest accuracy was reached with automatic
training and without dynamic learning rate. The difference being that automatic training
automatically adjusts the learning rate during training, re-starting the iteration process
with new random beginning weights, whilst in dynamic learning rate, the rate is lowered
progressively.
873
Table 2. Impact of sampling method on the performance of ANN models.
Sampling Method Iterations
Layer 1
nodes
Automatic
training
Dynamic
learning rate
Accuracy
(%)
Mondim de Basto
RS 100000 8 N Y 64.9
SRS 50000 8 N Y 73.3
SRPS 100000 7 N Y 58.9
SNPS 5000 7 N Y 71.8
SFPS 90000 7 N Y 51.3
Vila Real
RS 90000 7 N N 74.4
SRS 90000 7 N N 65.5
SRPS 50000 7 N Y 65.7
SNPS 30000 7 Y N 86.9
SFPS 90000 8 N Y 66.4
Although results are slightly different for each catchment, they show that the
predictive accuracy of the ANN models in supervised mode is highly dependent on the
sampling method used to select training sites.
5. CONCLUSIONS
There is a growing demand for high-resolution spatial soil information for
environmental planning and modelling. Portugal does not have complete soil-map
coverage because soil surveys are field and labour intensive, and therefore very
expensive.
Digital Soil Mapping approaches are based on emerging powerful techniques such
as ANN which can provide high-quality digital soil maps in a fast and cost-effective
way. However, not much is known about the impact that the selection of training sites
have on the accuracy of the models. This work evaluated that impact for two catchments
in northern Portugal, and conclusions are that (1) sampling strategy has a very important
impact on the accuracy of soil predictive maps developed using ANNs and (2) sampling
strategy benefits from reflecting high autocorrelation of factors of soil formation
because the ANN learns faster that close neighbouring positions are more likely to have
similar soil types, allowing the model to converge faster to a better solution. Therefore
different sampling strategies should be assessed and tested prior to using ANN for
modeling the spatial distribution of soils classes.
Subsequent work will involve the testing of different types of ANNs applied in the
same catchment areas and the comparison with the MLP results presented here.
Classification of soils using ANNs will also be tested at different spatial resolutions,
and additional study areas will be included.
Future work will also explore the hybridization power of using Fuzzy Logic for
DSM, and results obtained using both methodologies will be compared and validated
874
using existing maps and soil profile data. The best model will be used to map soil
classes across areas which are currently lacking spatial soil data, ultimately enabling the
completion of the Portuguese soil map coverage at 1:100000.
REFERENCES
BEHRENS T., FORSTER H., SCHOLTEN T., STEINRUCKEN U., SPIES E.,
GOLDSCHMITT M. (2005): “Digital soil mapping using artificial neural networks”, J.
Plant. Nutr. Soil Sci. 168: 1-13.
CARVALHO JUNIOR, W. et al . (2011): “Digital soilscape mapping of tropical
hillslope areas by neural networks”, Sci. Agric. (Piracicaba, Braz.), 68(6): 691-696.
DOBOS E., CARRÉ F., HENGL T., REUTER H.I. & TÓTH G. (2006): “Digital Soil
Mapping as a Support to Production of Functional Maps”, EUR 22123 EN. Office for
Official Publications of the European Communities, Luxemburg, 68 p.
ENGLUND E.J. (1988): “Spatial Autocorrelation: Implications for Sampling and
Estimation”, in LIGGETT W. (Ed.) Proceedings of the ASA/EPA Conferences on
Interpretation of Environmental Data, III Sampling and Site Selection in Environmental
Studies, EPA 230/8-88/035, 31-39
ESBN (European Soil Bureau Network) (2005): “Soil Atlas of Europe”. European
Commission, Office for Official Publications of the European Communities, L-2995
Luxemburg, 128 p.
HAYKIN S. (1999): Neural Networks – a Comprehensive Foundation. Prentice Hall,
New Jersey, 842 p.
MCBRATNEY A.B., MENDONÇA SANTOS M.L., MINASNY B. (2003): “On digital
soil mapping”, Geoderma, 117, 3-52.
MORA-VALLEJO A., CLAESSENS L., STOONVOGEL J. & HEUVELINK G.B.M.
(2008): “Small scale digital soil mapping in southeastern Kenya”, Catena, 76, 44-53.
MULLA D.J. & MCBRATNEY A.B. (2000): “Soil spatial variability”, in M.E.
SUMNER (Ed.) Handbook of Soil Science, A 321-352. CRC Press, Boca Raton.
MULLER A.J., NILSSON S., (2009): “Foreword to FAO/IIASA/ISRIC/ISS-CAS/JRC,
Harmonized World Soil Database (version 1.1)”. FAO, Rome, Italy and IIASA,
Laxenburg, Austria, 43 p.
POTOCNIK J. & DIMAS S. (2005): Preface. In Soil Atlas of Europe. European Soil
Bureau Network. European Commission, Office for Official Publications of the
European Communities, L-2995 Luxemburg, 128 p.
TSO B. & MATHER P.M. (2001): Classification Methods for Remotely Sensed Data.
Taylor and Francis, London, 332 p.
WESTERN A. & GRAYSON R. (2000): “Soil moisture and runoff processes at
Tarrawarra”, in R. GRAYSON & G. BLÖSCHL (Eds.) Spatial Patterns in Catchment
Hydrology: Observations and Modelling. Cambridge University Press, Cambridge, 209-
246.
ZHU A.-X. (2000): “Mapping soil landscape as spatial continua: The neural network
approach”, Water Resources Research, 36(3): 663-677.
875
ACKNOWLEDGEMENTS
The authors thank the Direcção Regional de Agricultura de Entre Douro e Minho for
providing the digital soil data used in this work. This work was produced in the
framework of AutoMAPticS (Automatic Mapping of Soils), a project supported by
PTDC/CS-GEO/111929/2009, a grant from FCT – Foundation for Science and
Technology (Portugal), whose principal investigator is employed under the FCT
Science 2008 Programme. The authors also acknowledge the support of the strategic
project of e-GEO, funded by FCT.
876

More Related Content

What's hot

2. Technical introduction to the GSOC Map
2. Technical introduction to the GSOC Map2. Technical introduction to the GSOC Map
2. Technical introduction to the GSOC MapFAO
 
5. Introduction to Digital Soil Mapping
5. Introduction to Digital Soil Mapping5. Introduction to Digital Soil Mapping
5. Introduction to Digital Soil MappingExternalEvents
 
Data preparation for Digital Soil Mapping
Data preparation for Digital Soil MappingData preparation for Digital Soil Mapping
Data preparation for Digital Soil MappingExternalEvents
 
Soil Organic Carbon mapping by geo- and class- matching
Soil Organic Carbon mapping by geo- and class- matchingSoil Organic Carbon mapping by geo- and class- matching
Soil Organic Carbon mapping by geo- and class- matchingExternalEvents
 
Digital Soil Mapping/ Pedomterics
Digital Soil Mapping/ Pedomterics Digital Soil Mapping/ Pedomterics
Digital Soil Mapping/ Pedomterics Soils FAO-GSP
 
Urban Land Cover Change Detection Analysis and Modelling Spatio-Temporal Grow...
Urban Land Cover Change Detection Analysis and Modelling Spatio-Temporal Grow...Urban Land Cover Change Detection Analysis and Modelling Spatio-Temporal Grow...
Urban Land Cover Change Detection Analysis and Modelling Spatio-Temporal Grow...Bayes Ahmed
 
OnTheUseOfMultitemporalSeriesOfCOSMODataForClassificationAndSurfaceParameterR...
OnTheUseOfMultitemporalSeriesOfCOSMODataForClassificationAndSurfaceParameterR...OnTheUseOfMultitemporalSeriesOfCOSMODataForClassificationAndSurfaceParameterR...
OnTheUseOfMultitemporalSeriesOfCOSMODataForClassificationAndSurfaceParameterR...grssieee
 
BPS001 Final Rept, Ch 8, BPS001 Driving PA forward Aug 2011 - 150917
BPS001 Final Rept, Ch 8, BPS001 Driving PA forward Aug 2011 - 150917BPS001 Final Rept, Ch 8, BPS001 Driving PA forward Aug 2011 - 150917
BPS001 Final Rept, Ch 8, BPS001 Driving PA forward Aug 2011 - 150917Don Pollock
 
Aitf 2014 pem_introduction_presentation_feb28_ram_version2
Aitf 2014 pem_introduction_presentation_feb28_ram_version2Aitf 2014 pem_introduction_presentation_feb28_ram_version2
Aitf 2014 pem_introduction_presentation_feb28_ram_version2Bob MacMillan
 
Digital Soil Mapping–Capacity Building Course- Introduction
Digital Soil Mapping–Capacity Building Course- IntroductionDigital Soil Mapping–Capacity Building Course- Introduction
Digital Soil Mapping–Capacity Building Course- IntroductionFAO
 
Mapping of degraded lands using remote sensing and
Mapping of degraded lands using remote sensing andMapping of degraded lands using remote sensing and
Mapping of degraded lands using remote sensing andsethupathi siva
 
Pedometrics2013 book of abstracts 14
Pedometrics2013 book of abstracts 14Pedometrics2013 book of abstracts 14
Pedometrics2013 book of abstracts 14Ricardo Brasil
 
2. virat arora, s. s. rao, e. amminedu and p. jagadeeswara rao
2. virat arora, s. s. rao, e. amminedu and p. jagadeeswara rao2. virat arora, s. s. rao, e. amminedu and p. jagadeeswara rao
2. virat arora, s. s. rao, e. amminedu and p. jagadeeswara raoJournal of Global Resources
 
Item 12: Preparation of global maps of soil salinity, soil erosion, and GLOSI...
Item 12: Preparation of global maps of soil salinity, soil erosion, and GLOSI...Item 12: Preparation of global maps of soil salinity, soil erosion, and GLOSI...
Item 12: Preparation of global maps of soil salinity, soil erosion, and GLOSI...FAO
 
Spatial analysis for the assessment of the environmental changes in the lands...
Spatial analysis for the assessment of the environmental changes in the lands...Spatial analysis for the assessment of the environmental changes in the lands...
Spatial analysis for the assessment of the environmental changes in the lands...Universität Salzburg
 
Land use land cover
Land use land coverLand use land cover
Land use land coverJATIN KUMAR
 
e-SOTER Regional pilot platform as EU contribution to a Global Soil Observing...
e-SOTER Regional pilot platform as EU contribution to a Global Soil Observing...e-SOTER Regional pilot platform as EU contribution to a Global Soil Observing...
e-SOTER Regional pilot platform as EU contribution to a Global Soil Observing...FAO
 

What's hot (20)

2. Technical introduction to the GSOC Map
2. Technical introduction to the GSOC Map2. Technical introduction to the GSOC Map
2. Technical introduction to the GSOC Map
 
5. Introduction to Digital Soil Mapping
5. Introduction to Digital Soil Mapping5. Introduction to Digital Soil Mapping
5. Introduction to Digital Soil Mapping
 
Data preparation for Digital Soil Mapping
Data preparation for Digital Soil MappingData preparation for Digital Soil Mapping
Data preparation for Digital Soil Mapping
 
Soil Organic Carbon mapping by geo- and class- matching
Soil Organic Carbon mapping by geo- and class- matchingSoil Organic Carbon mapping by geo- and class- matching
Soil Organic Carbon mapping by geo- and class- matching
 
Digital Soil Mapping/ Pedomterics
Digital Soil Mapping/ Pedomterics Digital Soil Mapping/ Pedomterics
Digital Soil Mapping/ Pedomterics
 
Urban Land Cover Change Detection Analysis and Modelling Spatio-Temporal Grow...
Urban Land Cover Change Detection Analysis and Modelling Spatio-Temporal Grow...Urban Land Cover Change Detection Analysis and Modelling Spatio-Temporal Grow...
Urban Land Cover Change Detection Analysis and Modelling Spatio-Temporal Grow...
 
Land cover and Land Use
Land cover and Land UseLand cover and Land Use
Land cover and Land Use
 
OnTheUseOfMultitemporalSeriesOfCOSMODataForClassificationAndSurfaceParameterR...
OnTheUseOfMultitemporalSeriesOfCOSMODataForClassificationAndSurfaceParameterR...OnTheUseOfMultitemporalSeriesOfCOSMODataForClassificationAndSurfaceParameterR...
OnTheUseOfMultitemporalSeriesOfCOSMODataForClassificationAndSurfaceParameterR...
 
BPS001 Final Rept, Ch 8, BPS001 Driving PA forward Aug 2011 - 150917
BPS001 Final Rept, Ch 8, BPS001 Driving PA forward Aug 2011 - 150917BPS001 Final Rept, Ch 8, BPS001 Driving PA forward Aug 2011 - 150917
BPS001 Final Rept, Ch 8, BPS001 Driving PA forward Aug 2011 - 150917
 
Aitf 2014 pem_introduction_presentation_feb28_ram_version2
Aitf 2014 pem_introduction_presentation_feb28_ram_version2Aitf 2014 pem_introduction_presentation_feb28_ram_version2
Aitf 2014 pem_introduction_presentation_feb28_ram_version2
 
FINAL REPORT
FINAL REPORTFINAL REPORT
FINAL REPORT
 
Land use cover pptx.
Land use cover pptx.Land use cover pptx.
Land use cover pptx.
 
Digital Soil Mapping–Capacity Building Course- Introduction
Digital Soil Mapping–Capacity Building Course- IntroductionDigital Soil Mapping–Capacity Building Course- Introduction
Digital Soil Mapping–Capacity Building Course- Introduction
 
Mapping of degraded lands using remote sensing and
Mapping of degraded lands using remote sensing andMapping of degraded lands using remote sensing and
Mapping of degraded lands using remote sensing and
 
Pedometrics2013 book of abstracts 14
Pedometrics2013 book of abstracts 14Pedometrics2013 book of abstracts 14
Pedometrics2013 book of abstracts 14
 
2. virat arora, s. s. rao, e. amminedu and p. jagadeeswara rao
2. virat arora, s. s. rao, e. amminedu and p. jagadeeswara rao2. virat arora, s. s. rao, e. amminedu and p. jagadeeswara rao
2. virat arora, s. s. rao, e. amminedu and p. jagadeeswara rao
 
Item 12: Preparation of global maps of soil salinity, soil erosion, and GLOSI...
Item 12: Preparation of global maps of soil salinity, soil erosion, and GLOSI...Item 12: Preparation of global maps of soil salinity, soil erosion, and GLOSI...
Item 12: Preparation of global maps of soil salinity, soil erosion, and GLOSI...
 
Spatial analysis for the assessment of the environmental changes in the lands...
Spatial analysis for the assessment of the environmental changes in the lands...Spatial analysis for the assessment of the environmental changes in the lands...
Spatial analysis for the assessment of the environmental changes in the lands...
 
Land use land cover
Land use land coverLand use land cover
Land use land cover
 
e-SOTER Regional pilot platform as EU contribution to a Global Soil Observing...
e-SOTER Regional pilot platform as EU contribution to a Global Soil Observing...e-SOTER Regional pilot platform as EU contribution to a Global Soil Observing...
e-SOTER Regional pilot platform as EU contribution to a Global Soil Observing...
 

Similar to THE IMPORTANCE OF SAMPLING FOR THE EFFICIENCY OF ARTIFICIAL NEURAL NETWORKS IN DIGITAL SOIL MAPPING

Building capacities for digital soil organic carbon mapping
Building capacities for digital soil organic carbon mappingBuilding capacities for digital soil organic carbon mapping
Building capacities for digital soil organic carbon mappingExternalEvents
 
Soil mapping approach in gis
Soil mapping approach in gisSoil mapping approach in gis
Soil mapping approach in gisSakthivel R
 
Diffuse reflectance spectroscopy to estimate soil attributes of Brazilian wet...
Diffuse reflectance spectroscopy to estimate soil attributes of Brazilian wet...Diffuse reflectance spectroscopy to estimate soil attributes of Brazilian wet...
Diffuse reflectance spectroscopy to estimate soil attributes of Brazilian wet...Agriculture Journal IJOEAR
 
Regression_Presentation2
Regression_Presentation2Regression_Presentation2
Regression_Presentation2Drake Sprague
 
Isprsarchives xl-7-w3-897-2015
Isprsarchives xl-7-w3-897-2015Isprsarchives xl-7-w3-897-2015
Isprsarchives xl-7-w3-897-2015bayrmgl
 
Introduction to soil property mapping
Introduction to soil property mappingIntroduction to soil property mapping
Introduction to soil property mappingExternalEvents
 
Supervised and unsupervised classification techniques for satellite imagery i...
Supervised and unsupervised classification techniques for satellite imagery i...Supervised and unsupervised classification techniques for satellite imagery i...
Supervised and unsupervised classification techniques for satellite imagery i...gaup_geo
 
Ilf euregeo 2012 poster 1
Ilf euregeo 2012 poster 1Ilf euregeo 2012 poster 1
Ilf euregeo 2012 poster 1Ricardo Brasil
 
T6 lutfi qasem remote sensing and gis applications executive summary
T6 lutfi qasem remote sensing and gis applications  executive summaryT6 lutfi qasem remote sensing and gis applications  executive summary
T6 lutfi qasem remote sensing and gis applications executive summaryNENAwaterscarcity
 
wasteland mapping
wasteland mappingwasteland mapping
wasteland mappingjosnarajp
 
Role of remote sensing and gis in infrastructural plan and identifying ecolog...
Role of remote sensing and gis in infrastructural plan and identifying ecolog...Role of remote sensing and gis in infrastructural plan and identifying ecolog...
Role of remote sensing and gis in infrastructural plan and identifying ecolog...PRADEEP M.S
 
Mapping spatial variability of soil physical properties for site-specific man...
Mapping spatial variability of soil physical properties for site-specific man...Mapping spatial variability of soil physical properties for site-specific man...
Mapping spatial variability of soil physical properties for site-specific man...IRJET Journal
 
3. Technical introduction to the Digital Soil Mapping
3. Technical introduction to the Digital Soil Mapping3. Technical introduction to the Digital Soil Mapping
3. Technical introduction to the Digital Soil MappingFAO
 
Land Use/Land Cover Mapping Of Allahabad City by Using Remote Sensing & GIS
Land Use/Land Cover Mapping Of Allahabad City by Using  Remote Sensing & GIS Land Use/Land Cover Mapping Of Allahabad City by Using  Remote Sensing & GIS
Land Use/Land Cover Mapping Of Allahabad City by Using Remote Sensing & GIS IJMER
 
Accuracy Assessment of Land Use/Land Cover Classification using multi tempora...
Accuracy Assessment of Land Use/Land Cover Classification using multi tempora...Accuracy Assessment of Land Use/Land Cover Classification using multi tempora...
Accuracy Assessment of Land Use/Land Cover Classification using multi tempora...IRJET Journal
 
Landuse landcover and ndvi analysis for halia catchment
Landuse landcover and ndvi analysis for halia catchmentLanduse landcover and ndvi analysis for halia catchment
Landuse landcover and ndvi analysis for halia catchmentIAEME Publication
 

Similar to THE IMPORTANCE OF SAMPLING FOR THE EFFICIENCY OF ARTIFICIAL NEURAL NETWORKS IN DIGITAL SOIL MAPPING (20)

Wf sblm2012 ilf
Wf sblm2012 ilfWf sblm2012 ilf
Wf sblm2012 ilf
 
Building capacities for digital soil organic carbon mapping
Building capacities for digital soil organic carbon mappingBuilding capacities for digital soil organic carbon mapping
Building capacities for digital soil organic carbon mapping
 
Soil mapping approach in gis
Soil mapping approach in gisSoil mapping approach in gis
Soil mapping approach in gis
 
Diffuse reflectance spectroscopy to estimate soil attributes of Brazilian wet...
Diffuse reflectance spectroscopy to estimate soil attributes of Brazilian wet...Diffuse reflectance spectroscopy to estimate soil attributes of Brazilian wet...
Diffuse reflectance spectroscopy to estimate soil attributes of Brazilian wet...
 
Regression_Presentation2
Regression_Presentation2Regression_Presentation2
Regression_Presentation2
 
Isprsarchives xl-7-w3-897-2015
Isprsarchives xl-7-w3-897-2015Isprsarchives xl-7-w3-897-2015
Isprsarchives xl-7-w3-897-2015
 
Introduction to soil property mapping
Introduction to soil property mappingIntroduction to soil property mapping
Introduction to soil property mapping
 
Supervised and unsupervised classification techniques for satellite imagery i...
Supervised and unsupervised classification techniques for satellite imagery i...Supervised and unsupervised classification techniques for satellite imagery i...
Supervised and unsupervised classification techniques for satellite imagery i...
 
Ilf euregeo 2012 poster 1
Ilf euregeo 2012 poster 1Ilf euregeo 2012 poster 1
Ilf euregeo 2012 poster 1
 
T6 lutfi qasem remote sensing and gis applications executive summary
T6 lutfi qasem remote sensing and gis applications  executive summaryT6 lutfi qasem remote sensing and gis applications  executive summary
T6 lutfi qasem remote sensing and gis applications executive summary
 
wasteland mapping
wasteland mappingwasteland mapping
wasteland mapping
 
Role of remote sensing and gis in infrastructural plan and identifying ecolog...
Role of remote sensing and gis in infrastructural plan and identifying ecolog...Role of remote sensing and gis in infrastructural plan and identifying ecolog...
Role of remote sensing and gis in infrastructural plan and identifying ecolog...
 
Mapping spatial variability of soil physical properties for site-specific man...
Mapping spatial variability of soil physical properties for site-specific man...Mapping spatial variability of soil physical properties for site-specific man...
Mapping spatial variability of soil physical properties for site-specific man...
 
Ar24289294
Ar24289294Ar24289294
Ar24289294
 
3. Technical introduction to the Digital Soil Mapping
3. Technical introduction to the Digital Soil Mapping3. Technical introduction to the Digital Soil Mapping
3. Technical introduction to the Digital Soil Mapping
 
Land Use/Land Cover Mapping Of Allahabad City by Using Remote Sensing & GIS
Land Use/Land Cover Mapping Of Allahabad City by Using  Remote Sensing & GIS Land Use/Land Cover Mapping Of Allahabad City by Using  Remote Sensing & GIS
Land Use/Land Cover Mapping Of Allahabad City by Using Remote Sensing & GIS
 
Accuracy Assessment of Land Use/Land Cover Classification using multi tempora...
Accuracy Assessment of Land Use/Land Cover Classification using multi tempora...Accuracy Assessment of Land Use/Land Cover Classification using multi tempora...
Accuracy Assessment of Land Use/Land Cover Classification using multi tempora...
 
1. mohammed aslam, b. mahalingam
1. mohammed aslam,  b. mahalingam1. mohammed aslam,  b. mahalingam
1. mohammed aslam, b. mahalingam
 
Landuse landcover and ndvi analysis for halia catchment
Landuse landcover and ndvi analysis for halia catchmentLanduse landcover and ndvi analysis for halia catchment
Landuse landcover and ndvi analysis for halia catchment
 
Research paper
Research paperResearch paper
Research paper
 

More from Ricardo Brasil

Carta-rec-3-Ricardo_Brasil
Carta-rec-3-Ricardo_BrasilCarta-rec-3-Ricardo_Brasil
Carta-rec-3-Ricardo_BrasilRicardo Brasil
 
Carta rec 2_ricardo_brasil
Carta rec 2_ricardo_brasilCarta rec 2_ricardo_brasil
Carta rec 2_ricardo_brasilRicardo Brasil
 
Carta rec 1_ricardo_brasil
Carta rec 1_ricardo_brasilCarta rec 1_ricardo_brasil
Carta rec 1_ricardo_brasilRicardo Brasil
 
Poster geostat r_brasil_fgutierres_jpsantos_pcanário
Poster geostat r_brasil_fgutierres_jpsantos_pcanárioPoster geostat r_brasil_fgutierres_jpsantos_pcanário
Poster geostat r_brasil_fgutierres_jpsantos_pcanárioRicardo Brasil
 
Formação mig ricardo brasi1l
Formação mig ricardo brasi1lFormação mig ricardo brasi1l
Formação mig ricardo brasi1lRicardo Brasil
 
Formação cenjor ricardo brasil
Formação cenjor ricardo brasilFormação cenjor ricardo brasil
Formação cenjor ricardo brasilRicardo Brasil
 
Formação icgpr ricardo brasil
Formação icgpr ricardo brasilFormação icgpr ricardo brasil
Formação icgpr ricardo brasilRicardo Brasil
 
Formação cenjor (frente) ricardo brasil
Formação cenjor (frente) ricardo brasilFormação cenjor (frente) ricardo brasil
Formação cenjor (frente) ricardo brasilRicardo Brasil
 
Curso de informática 2001
Curso de informática 2001Curso de informática 2001
Curso de informática 2001Ricardo Brasil
 
Análise à Rede do Metropolitano de Lisboa
Análise à Rede do Metropolitano de LisboaAnálise à Rede do Metropolitano de Lisboa
Análise à Rede do Metropolitano de LisboaRicardo Brasil
 
Aplicação das Redes Neuronais Artificiais do software STATISTICA 7.0: O caso ...
Aplicação das Redes Neuronais Artificiais do software STATISTICA 7.0: O caso ...Aplicação das Redes Neuronais Artificiais do software STATISTICA 7.0: O caso ...
Aplicação das Redes Neuronais Artificiais do software STATISTICA 7.0: O caso ...Ricardo Brasil
 
Simulação da evolução da classe de ocupação e uso do solo - urbano (contínuo ...
Simulação da evolução da classe de ocupação e uso do solo - urbano (contínuo ...Simulação da evolução da classe de ocupação e uso do solo - urbano (contínuo ...
Simulação da evolução da classe de ocupação e uso do solo - urbano (contínuo ...Ricardo Brasil
 
Modelação 3D e Ecologia
Modelação 3D e EcologiaModelação 3D e Ecologia
Modelação 3D e EcologiaRicardo Brasil
 
Identificação das áreas de potencial em termos de negócio para o BANIF em Ben...
Identificação das áreas de potencial em termos de negócio para o BANIF em Ben...Identificação das áreas de potencial em termos de negócio para o BANIF em Ben...
Identificação das áreas de potencial em termos de negócio para o BANIF em Ben...Ricardo Brasil
 
Análise do universo das plataformas WebSIG na CCDR do Norte de acordo com a a...
Análise do universo das plataformas WebSIG na CCDR do Norte de acordo com a a...Análise do universo das plataformas WebSIG na CCDR do Norte de acordo com a a...
Análise do universo das plataformas WebSIG na CCDR do Norte de acordo com a a...Ricardo Brasil
 
Apresentacao ix conggeogport_rev
Apresentacao ix conggeogport_revApresentacao ix conggeogport_rev
Apresentacao ix conggeogport_revRicardo Brasil
 
Certificado de Competências Pedagógicas
Certificado de Competências PedagógicasCertificado de Competências Pedagógicas
Certificado de Competências PedagógicasRicardo Brasil
 

More from Ricardo Brasil (17)

Carta-rec-3-Ricardo_Brasil
Carta-rec-3-Ricardo_BrasilCarta-rec-3-Ricardo_Brasil
Carta-rec-3-Ricardo_Brasil
 
Carta rec 2_ricardo_brasil
Carta rec 2_ricardo_brasilCarta rec 2_ricardo_brasil
Carta rec 2_ricardo_brasil
 
Carta rec 1_ricardo_brasil
Carta rec 1_ricardo_brasilCarta rec 1_ricardo_brasil
Carta rec 1_ricardo_brasil
 
Poster geostat r_brasil_fgutierres_jpsantos_pcanário
Poster geostat r_brasil_fgutierres_jpsantos_pcanárioPoster geostat r_brasil_fgutierres_jpsantos_pcanário
Poster geostat r_brasil_fgutierres_jpsantos_pcanário
 
Formação mig ricardo brasi1l
Formação mig ricardo brasi1lFormação mig ricardo brasi1l
Formação mig ricardo brasi1l
 
Formação cenjor ricardo brasil
Formação cenjor ricardo brasilFormação cenjor ricardo brasil
Formação cenjor ricardo brasil
 
Formação icgpr ricardo brasil
Formação icgpr ricardo brasilFormação icgpr ricardo brasil
Formação icgpr ricardo brasil
 
Formação cenjor (frente) ricardo brasil
Formação cenjor (frente) ricardo brasilFormação cenjor (frente) ricardo brasil
Formação cenjor (frente) ricardo brasil
 
Curso de informática 2001
Curso de informática 2001Curso de informática 2001
Curso de informática 2001
 
Análise à Rede do Metropolitano de Lisboa
Análise à Rede do Metropolitano de LisboaAnálise à Rede do Metropolitano de Lisboa
Análise à Rede do Metropolitano de Lisboa
 
Aplicação das Redes Neuronais Artificiais do software STATISTICA 7.0: O caso ...
Aplicação das Redes Neuronais Artificiais do software STATISTICA 7.0: O caso ...Aplicação das Redes Neuronais Artificiais do software STATISTICA 7.0: O caso ...
Aplicação das Redes Neuronais Artificiais do software STATISTICA 7.0: O caso ...
 
Simulação da evolução da classe de ocupação e uso do solo - urbano (contínuo ...
Simulação da evolução da classe de ocupação e uso do solo - urbano (contínuo ...Simulação da evolução da classe de ocupação e uso do solo - urbano (contínuo ...
Simulação da evolução da classe de ocupação e uso do solo - urbano (contínuo ...
 
Modelação 3D e Ecologia
Modelação 3D e EcologiaModelação 3D e Ecologia
Modelação 3D e Ecologia
 
Identificação das áreas de potencial em termos de negócio para o BANIF em Ben...
Identificação das áreas de potencial em termos de negócio para o BANIF em Ben...Identificação das áreas de potencial em termos de negócio para o BANIF em Ben...
Identificação das áreas de potencial em termos de negócio para o BANIF em Ben...
 
Análise do universo das plataformas WebSIG na CCDR do Norte de acordo com a a...
Análise do universo das plataformas WebSIG na CCDR do Norte de acordo com a a...Análise do universo das plataformas WebSIG na CCDR do Norte de acordo com a a...
Análise do universo das plataformas WebSIG na CCDR do Norte de acordo com a a...
 
Apresentacao ix conggeogport_rev
Apresentacao ix conggeogport_revApresentacao ix conggeogport_rev
Apresentacao ix conggeogport_rev
 
Certificado de Competências Pedagógicas
Certificado de Competências PedagógicasCertificado de Competências Pedagógicas
Certificado de Competências Pedagógicas
 

Recently uploaded

BASLIQ CURRENT LOOKBOOK LOOKBOOK(1) (1).pdf
BASLIQ CURRENT LOOKBOOK  LOOKBOOK(1) (1).pdfBASLIQ CURRENT LOOKBOOK  LOOKBOOK(1) (1).pdf
BASLIQ CURRENT LOOKBOOK LOOKBOOK(1) (1).pdfSoniaTolstoy
 
Contemporary philippine arts from the regions_PPT_Module_12 [Autosaved] (1).pptx
Contemporary philippine arts from the regions_PPT_Module_12 [Autosaved] (1).pptxContemporary philippine arts from the regions_PPT_Module_12 [Autosaved] (1).pptx
Contemporary philippine arts from the regions_PPT_Module_12 [Autosaved] (1).pptxRoyAbrique
 
Privatization and Disinvestment - Meaning, Objectives, Advantages and Disadva...
Privatization and Disinvestment - Meaning, Objectives, Advantages and Disadva...Privatization and Disinvestment - Meaning, Objectives, Advantages and Disadva...
Privatization and Disinvestment - Meaning, Objectives, Advantages and Disadva...RKavithamani
 
SOCIAL AND HISTORICAL CONTEXT - LFTVD.pptx
SOCIAL AND HISTORICAL CONTEXT - LFTVD.pptxSOCIAL AND HISTORICAL CONTEXT - LFTVD.pptx
SOCIAL AND HISTORICAL CONTEXT - LFTVD.pptxiammrhaywood
 
CARE OF CHILD IN INCUBATOR..........pptx
CARE OF CHILD IN INCUBATOR..........pptxCARE OF CHILD IN INCUBATOR..........pptx
CARE OF CHILD IN INCUBATOR..........pptxGaneshChakor2
 
mini mental status format.docx
mini    mental       status     format.docxmini    mental       status     format.docx
mini mental status format.docxPoojaSen20
 
Arihant handbook biology for class 11 .pdf
Arihant handbook biology for class 11 .pdfArihant handbook biology for class 11 .pdf
Arihant handbook biology for class 11 .pdfchloefrazer622
 
Measures of Central Tendency: Mean, Median and Mode
Measures of Central Tendency: Mean, Median and ModeMeasures of Central Tendency: Mean, Median and Mode
Measures of Central Tendency: Mean, Median and ModeThiyagu K
 
Mastering the Unannounced Regulatory Inspection
Mastering the Unannounced Regulatory InspectionMastering the Unannounced Regulatory Inspection
Mastering the Unannounced Regulatory InspectionSafetyChain Software
 
The basics of sentences session 2pptx copy.pptx
The basics of sentences session 2pptx copy.pptxThe basics of sentences session 2pptx copy.pptx
The basics of sentences session 2pptx copy.pptxheathfieldcps1
 
Web & Social Media Analytics Previous Year Question Paper.pdf
Web & Social Media Analytics Previous Year Question Paper.pdfWeb & Social Media Analytics Previous Year Question Paper.pdf
Web & Social Media Analytics Previous Year Question Paper.pdfJayanti Pande
 
POINT- BIOCHEMISTRY SEM 2 ENZYMES UNIT 5.pptx
POINT- BIOCHEMISTRY SEM 2 ENZYMES UNIT 5.pptxPOINT- BIOCHEMISTRY SEM 2 ENZYMES UNIT 5.pptx
POINT- BIOCHEMISTRY SEM 2 ENZYMES UNIT 5.pptxSayali Powar
 
Activity 01 - Artificial Culture (1).pdf
Activity 01 - Artificial Culture (1).pdfActivity 01 - Artificial Culture (1).pdf
Activity 01 - Artificial Culture (1).pdfciinovamais
 
Q4-W6-Restating Informational Text Grade 3
Q4-W6-Restating Informational Text Grade 3Q4-W6-Restating Informational Text Grade 3
Q4-W6-Restating Informational Text Grade 3JemimahLaneBuaron
 
Industrial Policy - 1948, 1956, 1973, 1977, 1980, 1991
Industrial Policy - 1948, 1956, 1973, 1977, 1980, 1991Industrial Policy - 1948, 1956, 1973, 1977, 1980, 1991
Industrial Policy - 1948, 1956, 1973, 1977, 1980, 1991RKavithamani
 
Employee wellbeing at the workplace.pptx
Employee wellbeing at the workplace.pptxEmployee wellbeing at the workplace.pptx
Employee wellbeing at the workplace.pptxNirmalaLoungPoorunde1
 

Recently uploaded (20)

BASLIQ CURRENT LOOKBOOK LOOKBOOK(1) (1).pdf
BASLIQ CURRENT LOOKBOOK  LOOKBOOK(1) (1).pdfBASLIQ CURRENT LOOKBOOK  LOOKBOOK(1) (1).pdf
BASLIQ CURRENT LOOKBOOK LOOKBOOK(1) (1).pdf
 
TataKelola dan KamSiber Kecerdasan Buatan v022.pdf
TataKelola dan KamSiber Kecerdasan Buatan v022.pdfTataKelola dan KamSiber Kecerdasan Buatan v022.pdf
TataKelola dan KamSiber Kecerdasan Buatan v022.pdf
 
Contemporary philippine arts from the regions_PPT_Module_12 [Autosaved] (1).pptx
Contemporary philippine arts from the regions_PPT_Module_12 [Autosaved] (1).pptxContemporary philippine arts from the regions_PPT_Module_12 [Autosaved] (1).pptx
Contemporary philippine arts from the regions_PPT_Module_12 [Autosaved] (1).pptx
 
Privatization and Disinvestment - Meaning, Objectives, Advantages and Disadva...
Privatization and Disinvestment - Meaning, Objectives, Advantages and Disadva...Privatization and Disinvestment - Meaning, Objectives, Advantages and Disadva...
Privatization and Disinvestment - Meaning, Objectives, Advantages and Disadva...
 
SOCIAL AND HISTORICAL CONTEXT - LFTVD.pptx
SOCIAL AND HISTORICAL CONTEXT - LFTVD.pptxSOCIAL AND HISTORICAL CONTEXT - LFTVD.pptx
SOCIAL AND HISTORICAL CONTEXT - LFTVD.pptx
 
CARE OF CHILD IN INCUBATOR..........pptx
CARE OF CHILD IN INCUBATOR..........pptxCARE OF CHILD IN INCUBATOR..........pptx
CARE OF CHILD IN INCUBATOR..........pptx
 
mini mental status format.docx
mini    mental       status     format.docxmini    mental       status     format.docx
mini mental status format.docx
 
INDIA QUIZ 2024 RLAC DELHI UNIVERSITY.pptx
INDIA QUIZ 2024 RLAC DELHI UNIVERSITY.pptxINDIA QUIZ 2024 RLAC DELHI UNIVERSITY.pptx
INDIA QUIZ 2024 RLAC DELHI UNIVERSITY.pptx
 
Arihant handbook biology for class 11 .pdf
Arihant handbook biology for class 11 .pdfArihant handbook biology for class 11 .pdf
Arihant handbook biology for class 11 .pdf
 
Measures of Central Tendency: Mean, Median and Mode
Measures of Central Tendency: Mean, Median and ModeMeasures of Central Tendency: Mean, Median and Mode
Measures of Central Tendency: Mean, Median and Mode
 
Mastering the Unannounced Regulatory Inspection
Mastering the Unannounced Regulatory InspectionMastering the Unannounced Regulatory Inspection
Mastering the Unannounced Regulatory Inspection
 
The basics of sentences session 2pptx copy.pptx
The basics of sentences session 2pptx copy.pptxThe basics of sentences session 2pptx copy.pptx
The basics of sentences session 2pptx copy.pptx
 
Web & Social Media Analytics Previous Year Question Paper.pdf
Web & Social Media Analytics Previous Year Question Paper.pdfWeb & Social Media Analytics Previous Year Question Paper.pdf
Web & Social Media Analytics Previous Year Question Paper.pdf
 
POINT- BIOCHEMISTRY SEM 2 ENZYMES UNIT 5.pptx
POINT- BIOCHEMISTRY SEM 2 ENZYMES UNIT 5.pptxPOINT- BIOCHEMISTRY SEM 2 ENZYMES UNIT 5.pptx
POINT- BIOCHEMISTRY SEM 2 ENZYMES UNIT 5.pptx
 
Activity 01 - Artificial Culture (1).pdf
Activity 01 - Artificial Culture (1).pdfActivity 01 - Artificial Culture (1).pdf
Activity 01 - Artificial Culture (1).pdf
 
Código Creativo y Arte de Software | Unidad 1
Código Creativo y Arte de Software | Unidad 1Código Creativo y Arte de Software | Unidad 1
Código Creativo y Arte de Software | Unidad 1
 
Q4-W6-Restating Informational Text Grade 3
Q4-W6-Restating Informational Text Grade 3Q4-W6-Restating Informational Text Grade 3
Q4-W6-Restating Informational Text Grade 3
 
Industrial Policy - 1948, 1956, 1973, 1977, 1980, 1991
Industrial Policy - 1948, 1956, 1973, 1977, 1980, 1991Industrial Policy - 1948, 1956, 1973, 1977, 1980, 1991
Industrial Policy - 1948, 1956, 1973, 1977, 1980, 1991
 
Mattingly "AI & Prompt Design: Structured Data, Assistants, & RAG"
Mattingly "AI & Prompt Design: Structured Data, Assistants, & RAG"Mattingly "AI & Prompt Design: Structured Data, Assistants, & RAG"
Mattingly "AI & Prompt Design: Structured Data, Assistants, & RAG"
 
Employee wellbeing at the workplace.pptx
Employee wellbeing at the workplace.pptxEmployee wellbeing at the workplace.pptx
Employee wellbeing at the workplace.pptx
 

THE IMPORTANCE OF SAMPLING FOR THE EFFICIENCY OF ARTIFICIAL NEURAL NETWORKS IN DIGITAL SOIL MAPPING

  • 1. THE IMPORTANCE OF SAMPLING FOR THE EFFICIENCY OF ARTIFICIAL NEURAL NETWORKS IN DIGITAL SOIL MAPPING FREIRE, SÉRGIO e-GEO, Centro de Estudos de Geografia e Planeamento Regional, Faculdade de Ciências Sociais e Humanas da Universidade Nova de Lisboa. sfreire@fcsh.unl.pt FONSECA, INÊS Centro de Estudos Geográficos, Universidade de Lisboa, Alameda da Universidade. BRASIL, RICARDO Centro de Estudos Geográficos, Universidade de Lisboa, Alameda da Universidade. ROCHA, JORGE Centro de Estudos Geográficos, Universidade de Lisboa, Alameda da Universidade. TENEDÓRIO, JOSÉ A. e-GEO, Centro de Estudos de Geografia e Planeamento Regional, Faculdade de Ciências Sociais e Humanas da Universidade Nova de Lisboa. Abstract In Portugal, soil mapping remains incomplete, and there are also significant problems with the existing cartography. Digital Soil Mapping uses advanced computer- based techniques such as Artificial Neural Networks (ANN) for mapping soil classes in a cheaper, more consistent and flexible way, using surrogate landscape data. This work used five different training sets to evaluate the impact that sampling has on the predictive accuracy of ANNs. The testes were carried out in IDRISI Taiga for two catchments in northern Portugal, using an ANN method known as multi-layer perceptron. Results show that sampling design is very important for the accuracy of soil mapping with ANNs. Keywords: Digital Soil Mapping, AutoMAPticS, IDRISI Taiga, Mondim de Basto, Vila Real Resumo A IMPORTÂNCIA DA AMOSTRAGEM NA EFICIÊNCIA DE REDES NEURONAIS ARTIFICIAIS EM CARTOGRAFIA DIGITAL DE SOLOS. Portugal não dispõe ainda de uma cobertura completa e harmonizada de cartas de solos. A cartografia automática de solos utiliza técnicas digitais avançadas como as Redes Neuronais Artificiais (RNA) para prever a distribuição espacial de tipos de solos de forma mais económica e consistente, usando variáveis responsáveis pela formação e desenvolvimento dos solos. Neste trabalho são usadas cinco amostras para avaliar o impacto que diferentes métodos de amostragem têm na exactidão da modelação por uma RNA. O teste realizou-se em IDRISI Taiga para duas bacias no Norte de Portugal, com recurso ao método multi-layer perceptron. Verificou-se que a amostragem é determinante para a performance da RNA. 867
  • 2. Palavras-chave: cartografia digital de solos, AutoMAPticS, IDRISI Taiga, Mondim de Basto, Vila Real 1. INTRODUCTION Soils are an important non-renewable resource crucial for human activities (POTOCNIK & DIMAS, 2005). By supporting valuable services, such as food production, biodiversity, and pollution buffering, soils play a fundamental role in sustainable land use. The simple absence of soil information adds to the uncertainties of predicting food production, and lack of reliable and harmonized soil data has considerably hampered land degradation assessments, environmental impact studies and adapted sustainable land management interventions (MULLER & NILSSON, 2009). Although soil surveys have been carried out in many countries, the scale and area coverage of resulting soil maps are not ideal for planning applications at national level (DOBOS et al., 2006). Additionally, there is a lack of consistency between soil classifications and legends across countries, which contributes towards a slow progression in integrating soil datasets, even in Europe (ESBN, 2005). Portugal, like most European Union member states, only has a fraction of its territory covered with soil maps at semi-detailed or reconnaissance scales (MCBRATNEY et al., 2003). While 55% of continental Portugal has soil maps at 1:50000 produced by traditional methods of soil survey before the 1970s, only about 40% of the territory has more recent soil map coverage at 1:100000 with some degree of overlap (Figure 1). Thus, not only the published coverage remains incomplete, but there are also significant problems with the existing cartography. There is a lack of cartographic uniformity between the different regions: (1) scales are different, (2) four different taxonomic systems were used, and (3) the framework behind the mapping of soil units at the two scales is different: the 1:100000 maps have a physiographic basis whereas the 1:50000 maps have a taxonomic basis. Moreover, using taxonomy as the basis of map design often results in high intra-unit variability of soil properties (MULLA & MCBRATNEY, 2000) and limited correlation between soil type and soil hydrologic parameters (WESTERN & GRAYSON, 2000). Therefore, only 43% of the area of Portugal has high standards of soil cartography. 868
  • 3. Figure 1. Scale and legends of regional soil maps of continental Portugal. In order to bridge the gap between existing soil maps based on traditional soil survey and the increasing demand for soil information, the technique of Digital Soil Mapping (DSM) has been developed for mapping soil classes and/or soil properties (DOBOS et al., 2006). By combining computer-based technologies such as Geographical Information Systems (GIS) with advanced techniques such as Artificial Neural Networks (ANN) and Fuzzy Logic (FL), DSM has enabled mapping the spatial distribution of soils in a cheaper, more consistent and flexible way, using surrogate landscape data. Thus, ANN models provide the means to predict soil types at locations without soil spatial data by combining existing soil maps with landscape features known to be responsible for the spatial variation of soils (MCBRATNEY et al., 2003). The process uses a set of variables related to soil forming factors and the respective soil type as training data for the ANN, which constructs rules (TSO & MATHER, 2001) that can be extended to the unmapped areas. Whilst the literature provides a number of examples where DSM is presented as an efficient mapping technique (e.g., ZHU, 2000; BEHRENS et al., 2005; CARVALHO JÚNIOR et al., 2011) and soil spatial variation is shown to be induced by a limited number of soil forming factors (MORA-VALLEJO et al., 2008), still little is known about the impact that the training sites have on the predictive accuracy of the models. The sampling method and location of training sites appears particularly important for ANNs because their rate of learning, convergence to a solution, network performance and ability to generalize depend on the efficiency of the layout of the sampling pattern which, in turn, depends on the presence of spatial periodicity of the phenomena. Despite the fact that all environmental variables exhibit spatial autocorrelation at some scale (ENGLUND, 1988), high values found in the spatial distribution of the variables used to train an ANN is likely to affect is performance. 869
  • 4. Therefore, in applying ANN for DSM, the likelihood that the sampling design used to select training areas has a relevant effect on the classification effectiveness is our main hypothesis. Hence, some of the main objectives of AutoMAPticS (Automatic Mapping of Soils), a research project carried out at national level and based on the development of artificial neural network (ANN) models, are to (i) predict soil classes in currently unmapped areas of mainland Portugal, and (ii) harmonize soil legends across regions with distinct soil mapping classifications, using Portuguese and Spanish soil spatial datasets to a) improve the level of transnational data integration and b) assess existing data. The present work aims at evaluating the impact that different sampling approaches used to select training areas for an ANN have on their predictive accuracy. 2. STUDY AREA In order to assess the impact of sampling, two study areas in northern Portugal were selected: a catchment in Mondim de Basto (Rio Tâmega), in the Douro-Minho region (911 km2 ), and another in Vila Real (Rio Corgo) in the Northeast region (468 km2 ) as shown in Figure 2. These catchments were chosen because they present diverse geomorphological and ecological characteristics and include soil types that are well representative of those found in each respective region. Soil types occurring in Mondim include Anthrosols, Fluvisols, Leptosols, and Regosols, while those in Vila Real include Anthrosols, Cambisols, Fluvisols, and Leptosols. 870
  • 5. Figure 2. Location and Digital Elevation Model (DEM) of the study areas. 3. DATA AND METHODS Independent variables used for training the ANN included both continuous terrain data and categorical (thematic) maps. The terrain surrogate data were derived from the Shuttle Radar Topography Mission (SRTM) digital elevation data (www2.jpl.nasa.gov/srtm) with a 90 m resolution and selected after multicollinearity tests showed little data redundancy. Seven morphometric variables, which are frequently used in DSM, were extracted from the terrain data: slope steepness, plan and profile curvatures, upslope catchment area, dispersal area, wetness index and potential solar radiation. These continuous variables were rescaled to a 0-255 value range. In addition to altitude, land use from Corine Land Cover 2006 (CLC2006) and geological data were also included, as well as digital soil data at 1:100000 provided by DRAEM, the regional agriculture department of Northwest Portugal. All layers were clipped to the study area and converted to a raster structure with a 90-m cell size, using the ETRS1989-TM06 projection system. In order to account for the possible effects of autocorrelation, the coordinates (latitude and longitude) were also included in the input set to indicate location. A formal assessment of spatial autocorrelation of variables was performed for both catchments. Measured through Moran´s I, the test indicated that both in Mondim and Vila Real autocorrelation is significantly high for slope steepness (0.76/0.82) and very high for potential solar radiation (0.88/0.88) and altitude (0.99/0.98). An even number of training sites (500 pixels) were selected, whenever possible, for each soil type. However, not all soil types covered areas sufficiently large to allow 871
  • 6. the selection of the same number of pixels. Thus, 1689 pixels (out of 112 416) were selected in Mondim and 2040 (out of 57 788) were selected in Vila Real. For their selection, two different sampling strategies were implemented. The ANN was trained by presenting it a number of different examples of the same soil type drawn either (i) randomly (RS), or (ii) in a stratified fashion (SS). For the latter, training pixel vectors were located by choosing (a) random coordinates within soil types strata (SRS), (b) random coordinates within soil types and chosen evenly in the frequency space (SRPS), (c) nearest coordinates within soil types and chosen evenly in the frequency space (SNPS), and (d) farthest coordinates within soil types and chosen evenly in the frequency space (SFPS). The neural network was trained in IDRISI Taiga (Clark Labs), using a highly popular supervised method known as multi-layer perceptron (MLP), run in hard classification mode. The MLP classifier is based on the back-propagation algorithm (HAYKIN, 1999). The experimental setup for each training set used the default specifications presented in Table 1 as initial values. Table 1. Characteristics and parameters of the ANN MLP in IDRISI Taiga. MLP parameters Group Parameter Default value Input specifications Avrg. training pixels per class 200 / 250 Avrg. testing pixels per class 200 / 250 Network topology Hidden layers 1 Layer 1 nodes 7 Training parameters Automatic training no Dynamic learning rate no Learning rate 0.01 End learning rate 0.001 Momentum factor 0.5 Sigmoid constant “a” 1 Stopping criteria RMS 0.01 Iterations 10000 Accuracy rate 100% In the Mondim catchment, an average of 200 pixels per class were used for training and testing, while 250 were used for Vila Real, due to constraints in the total area covered by some soil types. Some of these parameters were progressively changed and the network performance monitored, namely: number of layer 1 nodes, use of automatic training, use of dynamic learning rate, and number of iterations (maximum of 100 000). Training ended when one of the stopping criteria was achieved: either a RMSE ” 0.01, an accuracy of 100%, or the defined maximum number of iterations. Therefore the default neural network included 12 input layer nodes, 4 output layer nodes, and one hidden layer with 7 nodes (see Figure 3). In a study area, for a given combination of sampling method and parameters, results of different runs can vary due to different seeding of training pixels. Thus, five model runs were performed for each combination, in order to average their accuracies, as calculated by IDRISI. 872
  • 7. Figure 3. View of MLP interface and initial training parameters used in IDRISI Taiga. 4. RESULTS AND DISCUSSION The results of ANN training for both catchments are presented in Table 2, where for each sampling method, the main parameters and respective values are shown only for the combination obtaining the highest averaged accuracy, as computed by IDRISI. In Mondim, the best performance of the ANN was obtained with SRS (73%), by adding one node to the hidden layer. This result was closely followed by SNPS (72%), with SFPS showing the worst performance (51%). Whilst random sampling did not achieve as good predictive accuracy results as the one possible to obtain with stratified sampling (65% vs. 73%), it is clear that spatial autocorrelation causes an outstanding drop-off in the number of iterations required to achieve similar levels of accuracy (72% and 73%). Thus, accounting for spatial autocorrelation by choosing pixels that are as close as possible to each other (SNPS) resulted in only 5000 iterations being required (as opposed to 50 000) to achieve similar accuracy levels. This effect was also observed in the results obtained for Vila Real. Here SNPS clearly performed better (87%) and SRS, SRPS, and SFPS the worst (66%), with accuracies being generally higher than in Mondim. While in Mondim best performances in all sampling methods are obtained using dynamic learning rate, in Vila Real highest accuracy was reached with automatic training and without dynamic learning rate. The difference being that automatic training automatically adjusts the learning rate during training, re-starting the iteration process with new random beginning weights, whilst in dynamic learning rate, the rate is lowered progressively. 873
  • 8. Table 2. Impact of sampling method on the performance of ANN models. Sampling Method Iterations Layer 1 nodes Automatic training Dynamic learning rate Accuracy (%) Mondim de Basto RS 100000 8 N Y 64.9 SRS 50000 8 N Y 73.3 SRPS 100000 7 N Y 58.9 SNPS 5000 7 N Y 71.8 SFPS 90000 7 N Y 51.3 Vila Real RS 90000 7 N N 74.4 SRS 90000 7 N N 65.5 SRPS 50000 7 N Y 65.7 SNPS 30000 7 Y N 86.9 SFPS 90000 8 N Y 66.4 Although results are slightly different for each catchment, they show that the predictive accuracy of the ANN models in supervised mode is highly dependent on the sampling method used to select training sites. 5. CONCLUSIONS There is a growing demand for high-resolution spatial soil information for environmental planning and modelling. Portugal does not have complete soil-map coverage because soil surveys are field and labour intensive, and therefore very expensive. Digital Soil Mapping approaches are based on emerging powerful techniques such as ANN which can provide high-quality digital soil maps in a fast and cost-effective way. However, not much is known about the impact that the selection of training sites have on the accuracy of the models. This work evaluated that impact for two catchments in northern Portugal, and conclusions are that (1) sampling strategy has a very important impact on the accuracy of soil predictive maps developed using ANNs and (2) sampling strategy benefits from reflecting high autocorrelation of factors of soil formation because the ANN learns faster that close neighbouring positions are more likely to have similar soil types, allowing the model to converge faster to a better solution. Therefore different sampling strategies should be assessed and tested prior to using ANN for modeling the spatial distribution of soils classes. Subsequent work will involve the testing of different types of ANNs applied in the same catchment areas and the comparison with the MLP results presented here. Classification of soils using ANNs will also be tested at different spatial resolutions, and additional study areas will be included. Future work will also explore the hybridization power of using Fuzzy Logic for DSM, and results obtained using both methodologies will be compared and validated 874
  • 9. using existing maps and soil profile data. The best model will be used to map soil classes across areas which are currently lacking spatial soil data, ultimately enabling the completion of the Portuguese soil map coverage at 1:100000. REFERENCES BEHRENS T., FORSTER H., SCHOLTEN T., STEINRUCKEN U., SPIES E., GOLDSCHMITT M. (2005): “Digital soil mapping using artificial neural networks”, J. Plant. Nutr. Soil Sci. 168: 1-13. CARVALHO JUNIOR, W. et al . (2011): “Digital soilscape mapping of tropical hillslope areas by neural networks”, Sci. Agric. (Piracicaba, Braz.), 68(6): 691-696. DOBOS E., CARRÉ F., HENGL T., REUTER H.I. & TÓTH G. (2006): “Digital Soil Mapping as a Support to Production of Functional Maps”, EUR 22123 EN. Office for Official Publications of the European Communities, Luxemburg, 68 p. ENGLUND E.J. (1988): “Spatial Autocorrelation: Implications for Sampling and Estimation”, in LIGGETT W. (Ed.) Proceedings of the ASA/EPA Conferences on Interpretation of Environmental Data, III Sampling and Site Selection in Environmental Studies, EPA 230/8-88/035, 31-39 ESBN (European Soil Bureau Network) (2005): “Soil Atlas of Europe”. European Commission, Office for Official Publications of the European Communities, L-2995 Luxemburg, 128 p. HAYKIN S. (1999): Neural Networks – a Comprehensive Foundation. Prentice Hall, New Jersey, 842 p. MCBRATNEY A.B., MENDONÇA SANTOS M.L., MINASNY B. (2003): “On digital soil mapping”, Geoderma, 117, 3-52. MORA-VALLEJO A., CLAESSENS L., STOONVOGEL J. & HEUVELINK G.B.M. (2008): “Small scale digital soil mapping in southeastern Kenya”, Catena, 76, 44-53. MULLA D.J. & MCBRATNEY A.B. (2000): “Soil spatial variability”, in M.E. SUMNER (Ed.) Handbook of Soil Science, A 321-352. CRC Press, Boca Raton. MULLER A.J., NILSSON S., (2009): “Foreword to FAO/IIASA/ISRIC/ISS-CAS/JRC, Harmonized World Soil Database (version 1.1)”. FAO, Rome, Italy and IIASA, Laxenburg, Austria, 43 p. POTOCNIK J. & DIMAS S. (2005): Preface. In Soil Atlas of Europe. European Soil Bureau Network. European Commission, Office for Official Publications of the European Communities, L-2995 Luxemburg, 128 p. TSO B. & MATHER P.M. (2001): Classification Methods for Remotely Sensed Data. Taylor and Francis, London, 332 p. WESTERN A. & GRAYSON R. (2000): “Soil moisture and runoff processes at Tarrawarra”, in R. GRAYSON & G. BLÖSCHL (Eds.) Spatial Patterns in Catchment Hydrology: Observations and Modelling. Cambridge University Press, Cambridge, 209- 246. ZHU A.-X. (2000): “Mapping soil landscape as spatial continua: The neural network approach”, Water Resources Research, 36(3): 663-677. 875
  • 10. ACKNOWLEDGEMENTS The authors thank the Direcção Regional de Agricultura de Entre Douro e Minho for providing the digital soil data used in this work. This work was produced in the framework of AutoMAPticS (Automatic Mapping of Soils), a project supported by PTDC/CS-GEO/111929/2009, a grant from FCT – Foundation for Science and Technology (Portugal), whose principal investigator is employed under the FCT Science 2008 Programme. The authors also acknowledge the support of the strategic project of e-GEO, funded by FCT. 876