The document does not contain any text to summarize. It only contains the letter "Q" which provides no context or content to effectively summarize in 3 sentences or less.
Q 1 2007
IAL RE PORT
F INANC
Lars-Johan Jarnheimer
President and CEO
2.
TELE2: Q1 2007RESULTS
SEK MILLION 2007 2006
Q1 Q1
Continuing operations
Operating revenue 12,837 12,243
Net customer intake (thousands) 281 617
EBITDA 1,488 1,221
• Mobile revenues in Q1 2007 increased by 29 percent to SEK 5.2
billion
• Strong broadband intake during Q1 2007, adding a total of 254,000
new broadband customers
• Fixed telephony EBITDA margin improved to 14 percent in Q1 2007
2
3.
UP DATE ONTHE CURRENT STRATEGIC
REVIEW
• We will see result of the current strategic review in the
second quarter
• The first transaction is likely in the next couple of weeks
• The transaction between Tele2 and SFR will receive a
preliminary indication from the EU competition authorities
in May
• There is now a firm action plan for the MVNO businesses
Current
Strategic
Review is
progressing
according to
plan 3
4.
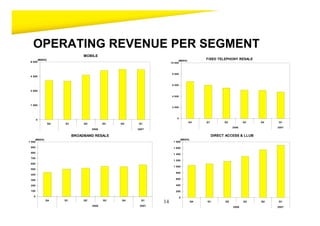
CONTINUED SHIFT TOWARDS
INFRASTRUCTUREBASED SERVICES
Sales - Q1 2007 Sales - Q1 2006
35%
39%
42%
51%
14%
19%
Mobile Mobile
Broadband (resale & direct access) Broadband (resale & direct access)
Fixed telephony resale Fixed telephony resale
4
CONTINUED STRONG PERFORMANCE
INMOBILE TELEPHONY
SEK MILLION 2007 2006
Q1 Q1
Mobile Telephony
Operating revenue 5,219 4,038
Net customer intake (thousands) 747 909
EBITDA 1,088 746
• Mobile revenues in Q1 2007 increased by 29 percent to SEK 5.2
billion
• Russia and Baltic developing above expectations.
Total customer base for the market area
in excess of 10.8 million
• Mixed development in MVNO.
• Clean up of customer base in the Nordic market area by
approximately 900,000 in Q2 2007
6
7.
STRONG BROADBAND INTAKE
SEKMILLION 2007 2006
Q1 Q1
Broadband resale, DA/LLUB
Operating revenue 2,276 1,602
Net customer intake (thousands) 255 144
EBITDA -361 -295
• Strong broadband intake during Q1 2007, adding a total of
254,000 new broadband customers
• Broadband is being evaluated market by market.
– Italy showing strong gross margin development in the
quarter
7
8.
TELE2 ITALY: DIRECTACCESS
ITA D
LY A ITA D
LY A
60% 52 %
40%
20%
0%
Q -06
3 Q -06
4 Q -07
1
-20%
-40%
-60%
-80%
-100%
Q -06
3 Q -06
4 Q -07
1
-120%
N Intake
et Gross Margin 2
• Coverage improved to 40 % of Italian households.
• Tele2 looks to expand beyond 50 %
• Up-selling from single to dual play services
• Larger customer base leading to scale effects
8
9.
STABLE MARGIN –INCREASED
COMPETITION
SEK MILLION 2007 2006
Q1 Q1
Fixed telephony resale
Operating revenue 4,796 6,017
Net customer intake (thousands) -720 -436
EBITDA 649 662
• Fixed telephony EBITDA margin improved to 14 percent in Q1
2007
• Higher level of competition from primarily mobile operators
– Larger net customer outflow
– Stronger ARPU decline than expected
• Cross selling still an important opportunity
9
10.
Q1 2007 SUMMERIZED
•Strong development in Mobile
Telephony, with a revenue growth
of 29 % in Q1
• Continued strong broadband
intake during Q1 2007, adding
254,000 new broadband
customers
• Improving EBITDA margins in
fixed line. However, competition is
increasing
TELE2: CONTINUED OPERATIONS
– Important for Tele2 to move
swiftly into more infrastructure MSEK Q1 2007 Q1 2006
based operations
Operating revenue* 12,837 12,243 +5 %
EBITDA* 1,488 1,221 +22 %
Net intake (‘000) 281 617 -54 %
*Excluding non-recurring items
10
11.
NO CHANGE TOFINANCIAL GUIDENCE ON 2007
• Outlook for 2007 remains unchanged:
“We expect significantly higher EBITDA and higher organic
growth compared to 2006”
11
12.
Q 1 2007
IAL RE PORT
F INANC
Donna Cordner
EVP Corporate Finance & Treasury
RUSSIA SALES +135%
Russia Mobile Russia Mobile
MSEK MSEK '000
1 200 350 1 200
300
1 000 1 000
250
800 800
200
600 150 600
400 100
400
50
200
200
0
0
-50 0
Q4 Q1 Q2 Q3 Q4 Q1
Q4 Q1 Q2 Q3 Q4 Q1
2006 2007
2006 2007
Sales EBITDA Net intake
• Net intake of 644,000 customers to a total of 7,1 million customers
• ARPU of 52 SEK in Q1 2007 compared to 42 SEK in Q1 2006
• EBITDA margin 28 %
18
19.
BALTIC MOBILE SALES+18 %
Baltic Mobile Baltic Mobile
MSEK MSEK '000
1 200 450 250
400
1 000 200
350
300
800 150
250
200
600 100
150
400 100 50
50
200 0 0
Q4 Q1 Q2 Q3 Q4 Q1 Q4 Q1 Q2 Q3 Q4 Q1
2006 2007 2006 2007
Sales EBITDA Net intake
• Revenue growth for the Baltic region was strong at 19 percent
– All 3 countries had double digit sales growth
• EBITDA for the Baltic region grew 25 percent
• In Lithuania Tele2 has been able to capture 11 percent
of the corporate market 19
20.
SWEDEN MOBILE SALES+8 %
Sweden Mobile Sweden Mobile
MSEK MSEK '000
1 000 80
2 000 60
800
40
1 500
600
20
1 000 0
400
-20
500 200
-40
0 -60
0
Q4 Q1 Q2 Q3 Q4 Q1
Q4 Q1 Q2 Q3 Q4 Q1
2006 2007
2006 2007
Sales EBITDA Net intake
• EBITDA-margin effected by higher marketing costs in Q1 2007
• More than 48 000 post-paid net adds in Q1
20
21.
NORDIC EXCL. SWEDEN
MOBILE SALES +30 %
Nordic excl. Sweden - Mobile Nordic excl. Sweden - Mobile
MSEK MSEK '000
800 80 100
60 80
600
60
40
40
400 20
20
0
Q4 Q1 Q2 Q3 Q4 Q1 0
200
-20 2006 2007
-20
-40
0 -40
Q4 Q1 Q2 Q3 Q4 Q1
-60 -60
2006 2007
Sales EBITDA Net intake
21
22.
NET DEBT
Net debt
MSEK
18 000 3,6
3,2
15 000
2,8
12 000 2,4
2,0
9 000
1,6
6 000 1,2
0,8
3 000
0,4
0 0,0
Q1 Q2 Q3 Q4 Q1 Q2 Q3 Q4 Q1
2005 2006 2007
Net Debt Net Debt to EBITDA
22
23.
DO NOT FORGET
Contacts
Visit www.tele2.com Lars-Johan Jarnheimer
Telephone: + 46 (0)8 562 640 00
• Conference call today
President and CEO, Tele2 AB
at 15.00 CET
Web-cast at www.tele2.com Lars Torstensson
Telephone: + 46 (0) 702 73 48 79
• Q2 2007: 25 July 2007 IR Director, Tele2 AB
23