Download to read offline


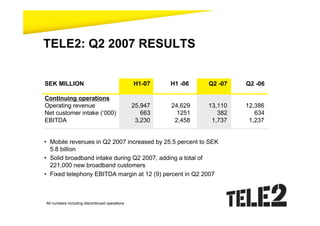
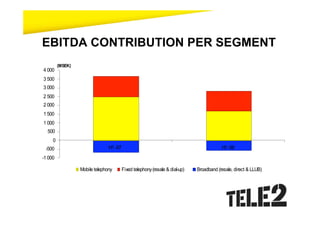
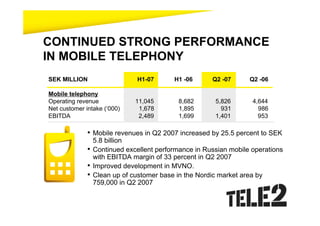
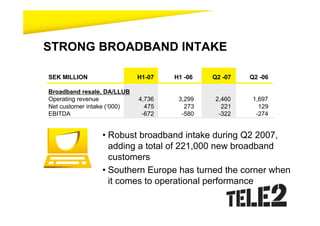
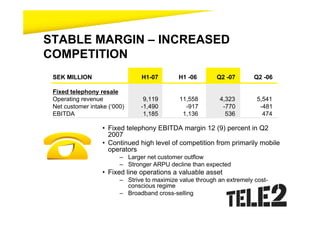
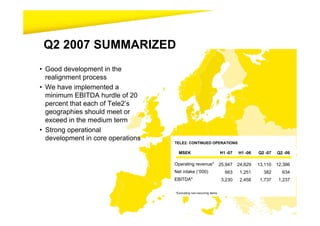
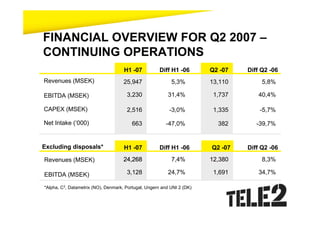
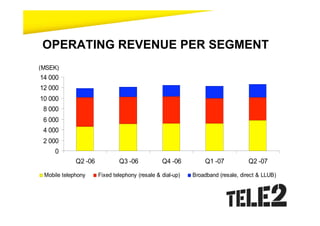
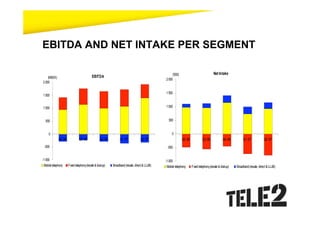


Tele2 reported its Q2 2007 results, which showed continued progress in realigning its operations. Key highlights included strong performance in mobile operations, particularly in Russia, solid broadband intake, and stable margins in fixed telephony despite increased competition. Tele2 remained focused on meeting its minimum 20% EBITDA hurdle for each geography.


