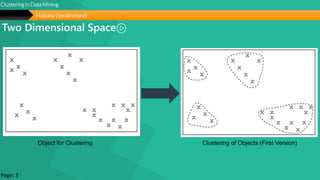
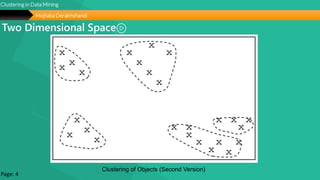
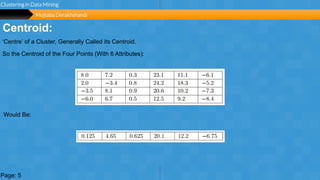
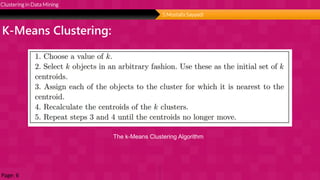
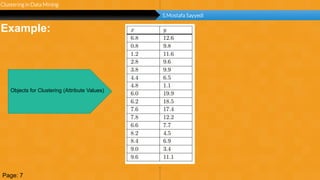
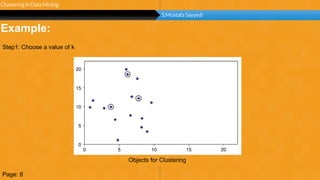
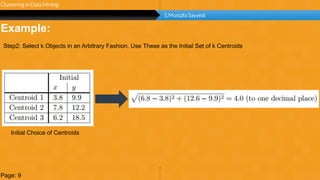
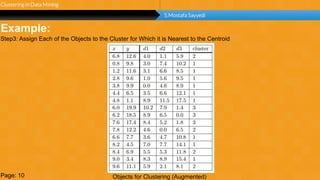
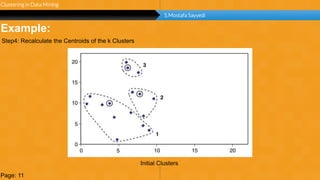
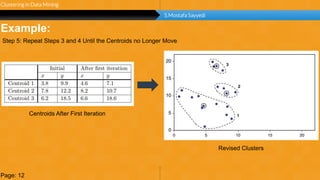
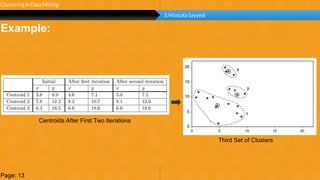
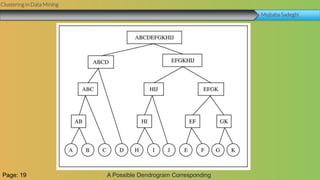
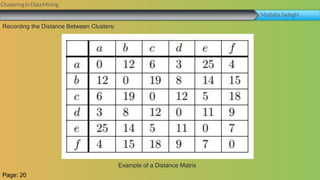
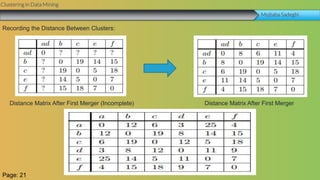
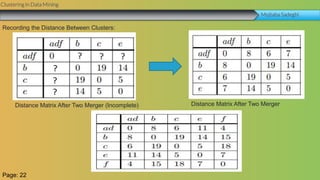
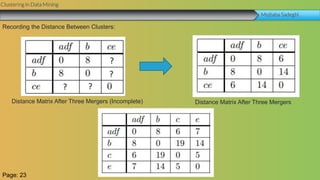
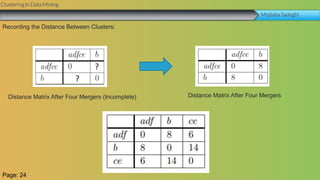
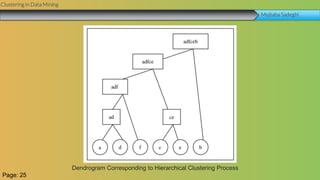
This document summarizes a group project report on clustering in data mining. It discusses different types of clustering algorithms including K-means clustering and agglomerative hierarchical clustering. For K-means clustering, it provides an example showing how clusters are formed by assigning objects to centroids and recalculating centroids over iterations. For hierarchical clustering, it shows how clusters are merged based on distances recorded in a distance matrix and represented through a dendrogram. The document contains examples and diagrams to illustrate key steps and concepts in clustering techniques.
Elasticsearch: Getting Started Part 3 AggregationsSuyog Kale
To know more about What is aggregations in Elasticsearch?
- Metrics aggregations
- Avg aggregation
- Cardinality aggregation
- Extended stats aggregation
- Min & Max aggregation
- Sum aggregation
- Bucket aggregations
- Nested Bucket aggregations
Elasticsearch is a distributed, RESTful search and analytics engine capable of solving a growing number of use cases. As the heart of the Elastic Stack, it centrally stores your data so you can discover the expected and uncover the unexpected.
MongoDB is one of the most popular NoSQL databases written in C++. In 2015, MongoDB was found as the fourth most popular database management system. It was developed by the company 10gen which is now named as MongoDB Inc.
MongoDB is a document-oriented database that stores data in JSON-like documents that can vary in structure. It implies that you can store your records without bothering about the data structure such as the number of fields or types of fields to store values. MongoDB documents are related to JSON objects.
Presentation about http://worldwidesemanticweb.org/ given at SugarCamp#3 in Paris on April 12-13. The slides introduce the activities of the WWSW group centred around adapting Semantic Web technologies to be usable in challenging conditions.
This is the complete detail of MongoDB vs Hadoop (https://programmershelper.com) the volumes of big data that can be handled by NoSQL systems, like MongoDB vs Hadoop, outstriphttps://programmershelper.com/mongodb-vs-hadoop
What's So Unique About a Columnar Database?FlyData Inc.
Looking for the right database technology to use? Luckily there are many database technologies to choose from, including relational databases (MySQL, Postgres), NoSQL (MongoDB), columnar databases (Amazon Redshift, BigQuery), and others. Each choice has its own pros and cons, but today let’s walk through how columnar databases are unique, by comparing it against the more traditional row-oriented database (e.g., MySQL).
It Don’t Mean a Thing If It Ain’t Got SemanticsOntotext
With the tons of bits of data around enterprises and the challenge to turn these data into knowledge, meaning is arguably in the systems of the best database holder.
Turning data pieces into actionable knowledge and data-driven decisions takes a good and reliable database. The RDF database is one such solution.
It captures and analyzes large volumes of diverse data while at the same time is able to manage and retrieve each and every connection these data ever get to enter in.
In our latest slides, you will find out why we believe RDF graph databases work wonders with serving information needs and handling the growing amounts of diverse data every organization faces today.
Linked Data Experiences at Springer NatureMichele Pasin
An overview of how we're using semantic technologies at Springer Nature, and an introduction to our latest product: www.scigraph.com
(Keynote given at http://2016.semantics.cc/, Leipzig, Sept 2016)
Introduction to Redis Data Structures: HashesScaleGrid.io
Learn about Redis data structures: hashes and contact us for hassle-free hosting for mongodb® and Redis®
Retrieve your connection string and start using your cluster.
For the course Web Search, together with a teammate I made a tool to analyse online political election news, using web crawling techniques. Specifically, we were interested in whether online political news coverage was correlated with election results.
Providing open data is of interest for its societal and commercial value, for transparency, and because more people can do fun things with data. There is a growing number of initiatives to provide open data, from, for example, the UK government and the World Bank. However, much of this data is provided in formats such as Excel files, or even PDF files. This raises the question of
- How best to provide access to data so it can be most easily reused?
- How to enable the discovery of relevant data within the multitude of available data sets?
- How to enable applications to integrate data from large numbers of formerly unknown data sources?
One way to address these issues to to use the design principles of linked data (http://www.w3.org/DesignIssues/LinkedData.html), which suggest best practices for how to publish and connect structured data on the Web. This presentation gives an overview of linked data technologies (such as RDF and SPARQL), examples of how they can be used, as well as some starting points for people who want to provide and use linked data.
The presentation was given on August 8, at the Hacknight event (http://hacknight.se/) of Forskningsavdelningen (http://forskningsavd.se/) (Swedish: “Research Department”) a hackerspace in Malmö.
Mining the Web of Linked Data with RapidMinerHeiko Paulheim
Lots of data from different domains is published as Linked Open Data. While there are quite a few browsers for that data, as well as intelligent tools for particular purposes, a versatile tool for deriving additional knowledge by mining the Web of Linked Data is still missing. In this challenge entry, we introduce the RapidMiner Linked Open Data extension. The extension hooks into the powerful data mining platform RapidMiner, and offers operators for accessing Linked Open Data in RapidMiner, allowing for using it in sophisticated data analysis workflows without the need to know SPARQL or RDF. As an example, we show how statistical data on scientific publications, published as an RDF data cube, can be linked to further datasets and analyzed using additional background knowledge from various LOD datasets.
Data mining refers to the process of analysing the data from different perspectives and summarizing it into useful information.
Data mining software is one of the number of tools used for analysing data. It allows users to analyse from many different dimensions and angles, categorize it, and summarize the relationship identified.
Data mining is about technique for finding and describing Structural Patterns in data.
Clustering: Introduction, Types of clustering;
Partition-based clustering: K-Means, K-Medoids;
Density based clustering: DBSCAN, Clustering evaluation.
Mining Data Stream, Mining Time-Series Data, Mining Sequence Patterns in Transactional Database,
Social Network analysis and Multirelational Data Mining.
Applied Data Science Course Part 1: Concepts & your first ML modelDataiku
In this first course of our Applied Data Science online course series, you'll learn about the mindset shift of going from small to big data, basic definitions and concepts, and an overview of the data science workflow.
An Efficient Compressed Data Structure Based Method for Frequent Item Set Miningijsrd.com
Frequent pattern mining is very important for business organizations. The major applications of frequent pattern mining include disease prediction and analysis, rain forecasting, profit maximization, etc. In this paper, we are presenting a new method for mining frequent patterns. Our method is based on a new compact data structure. This data structure will help in reducing the execution time.
This lecture gives various definitions of Data Mining. It also gives why Data Mining is required. Various examples on Classification , Cluster and Association rules are given.
Updated live Mtech CSE Academic IEEE Major Data Mining Projects in Hyderabad for Final Year Students of Engineering. Computer Science and Engineering latest major Data Mining Projects.
Exploring Innovations in Data Repository Solutions - Insights from the U.S. G...Globus
The U.S. Geological Survey (USGS) has made substantial investments in meeting evolving scientific, technical, and policy driven demands on storing, managing, and delivering data. As these demands continue to grow in complexity and scale, the USGS must continue to explore innovative solutions to improve its management, curation, sharing, delivering, and preservation approaches for large-scale research data. Supporting these needs, the USGS has partnered with the University of Chicago-Globus to research and develop advanced repository components and workflows leveraging its current investment in Globus. The primary outcome of this partnership includes the development of a prototype enterprise repository, driven by USGS Data Release requirements, through exploration and implementation of the entire suite of the Globus platform offerings, including Globus Flow, Globus Auth, Globus Transfer, and Globus Search. This presentation will provide insights into this research partnership, introduce the unique requirements and challenges being addressed and provide relevant project progress.
Top Features to Include in Your Winzo Clone App for Business Growth (4).pptxrickgrimesss22
Discover the essential features to incorporate in your Winzo clone app to boost business growth, enhance user engagement, and drive revenue. Learn how to create a compelling gaming experience that stands out in the competitive market.
How Recreation Management Software Can Streamline Your Operations.pptxwottaspaceseo
Recreation management software streamlines operations by automating key tasks such as scheduling, registration, and payment processing, reducing manual workload and errors. It provides centralized management of facilities, classes, and events, ensuring efficient resource allocation and facility usage. The software offers user-friendly online portals for easy access to bookings and program information, enhancing customer experience. Real-time reporting and data analytics deliver insights into attendance and preferences, aiding in strategic decision-making. Additionally, effective communication tools keep participants and staff informed with timely updates. Overall, recreation management software enhances efficiency, improves service delivery, and boosts customer satisfaction.
Cyaniclab : Software Development Agency Portfolio.pdfCyanic lab
CyanicLab, an offshore custom software development company based in Sweden,India, Finland, is your go-to partner for startup development and innovative web design solutions. Our expert team specializes in crafting cutting-edge software tailored to meet the unique needs of startups and established enterprises alike. From conceptualization to execution, we offer comprehensive services including web and mobile app development, UI/UX design, and ongoing software maintenance. Ready to elevate your business? Contact CyanicLab today and let us propel your vision to success with our top-notch IT solutions.
Enterprise Resource Planning System includes various modules that reduce any business's workload. Additionally, it organizes the workflows, which drives towards enhancing productivity. Here are a detailed explanation of the ERP modules. Going through the points will help you understand how the software is changing the work dynamics.
To know more details here: https://blogs.nyggs.com/nyggs/enterprise-resource-planning-erp-system-modules/
Globus Compute wth IRI Workflows - GlobusWorld 2024Globus
As part of the DOE Integrated Research Infrastructure (IRI) program, NERSC at Lawrence Berkeley National Lab and ALCF at Argonne National Lab are working closely with General Atomics on accelerating the computing requirements of the DIII-D experiment. As part of the work the team is investigating ways to speedup the time to solution for many different parts of the DIII-D workflow including how they run jobs on HPC systems. One of these routes is looking at Globus Compute as a way to replace the current method for managing tasks and we describe a brief proof of concept showing how Globus Compute could help to schedule jobs and be a tool to connect compute at different facilities.
In software engineering, the right architecture is essential for robust, scalable platforms. Wix has undergone a pivotal shift from event sourcing to a CRUD-based model for its microservices. This talk will chart the course of this pivotal journey.
Event sourcing, which records state changes as immutable events, provided robust auditing and "time travel" debugging for Wix Stores' microservices. Despite its benefits, the complexity it introduced in state management slowed development. Wix responded by adopting a simpler, unified CRUD model. This talk will explore the challenges of event sourcing and the advantages of Wix's new "CRUD on steroids" approach, which streamlines API integration and domain event management while preserving data integrity and system resilience.
Participants will gain valuable insights into Wix's strategies for ensuring atomicity in database updates and event production, as well as caching, materialization, and performance optimization techniques within a distributed system.
Join us to discover how Wix has mastered the art of balancing simplicity and extensibility, and learn how the re-adoption of the modest CRUD has turbocharged their development velocity, resilience, and scalability in a high-growth environment.
Check out the webinar slides to learn more about how XfilesPro transforms Salesforce document management by leveraging its world-class applications. For more details, please connect with sales@xfilespro.com
If you want to watch the on-demand webinar, please click here: https://www.xfilespro.com/webinars/salesforce-document-management-2-0-smarter-faster-better/
Providing Globus Services to Users of JASMIN for Environmental Data AnalysisGlobus
JASMIN is the UK’s high-performance data analysis platform for environmental science, operated by STFC on behalf of the UK Natural Environment Research Council (NERC). In addition to its role in hosting the CEDA Archive (NERC’s long-term repository for climate, atmospheric science & Earth observation data in the UK), JASMIN provides a collaborative platform to a community of around 2,000 scientists in the UK and beyond, providing nearly 400 environmental science projects with working space, compute resources and tools to facilitate their work. High-performance data transfer into and out of JASMIN has always been a key feature, with many scientists bringing model outputs from supercomputers elsewhere in the UK, to analyse against observational or other model data in the CEDA Archive. A growing number of JASMIN users are now realising the benefits of using the Globus service to provide reliable and efficient data movement and other tasks in this and other contexts. Further use cases involve long-distance (intercontinental) transfers to and from JASMIN, and collecting results from a mobile atmospheric radar system, pushing data to JASMIN via a lightweight Globus deployment. We provide details of how Globus fits into our current infrastructure, our experience of the recent migration to GCSv5.4, and of our interest in developing use of the wider ecosystem of Globus services for the benefit of our user community.
Essentials of Automations: The Art of Triggers and Actions in FMESafe Software
In this second installment of our Essentials of Automations webinar series, we’ll explore the landscape of triggers and actions, guiding you through the nuances of authoring and adapting workspaces for seamless automations. Gain an understanding of the full spectrum of triggers and actions available in FME, empowering you to enhance your workspaces for efficient automation.
We’ll kick things off by showcasing the most commonly used event-based triggers, introducing you to various automation workflows like manual triggers, schedules, directory watchers, and more. Plus, see how these elements play out in real scenarios.
Whether you’re tweaking your current setup or building from the ground up, this session will arm you with the tools and insights needed to transform your FME usage into a powerhouse of productivity. Join us to discover effective strategies that simplify complex processes, enhancing your productivity and transforming your data management practices with FME. Let’s turn complexity into clarity and make your workspaces work wonders!
Code reviews are vital for ensuring good code quality. They serve as one of our last lines of defense against bugs and subpar code reaching production.
Yet, they often turn into annoying tasks riddled with frustration, hostility, unclear feedback and lack of standards. How can we improve this crucial process?
In this session we will cover:
- The Art of Effective Code Reviews
- Streamlining the Review Process
- Elevating Reviews with Automated Tools
By the end of this presentation, you'll have the knowledge on how to organize and improve your code review proces
Enhancing Research Orchestration Capabilities at ORNL.pdfGlobus
Cross-facility research orchestration comes with ever-changing constraints regarding the availability and suitability of various compute and data resources. In short, a flexible data and processing fabric is needed to enable the dynamic redirection of data and compute tasks throughout the lifecycle of an experiment. In this talk, we illustrate how we easily leveraged Globus services to instrument the ACE research testbed at the Oak Ridge Leadership Computing Facility with flexible data and task orchestration capabilities.
Developing Distributed High-performance Computing Capabilities of an Open Sci...Globus
COVID-19 had an unprecedented impact on scientific collaboration. The pandemic and its broad response from the scientific community has forged new relationships among public health practitioners, mathematical modelers, and scientific computing specialists, while revealing critical gaps in exploiting advanced computing systems to support urgent decision making. Informed by our team’s work in applying high-performance computing in support of public health decision makers during the COVID-19 pandemic, we present how Globus technologies are enabling the development of an open science platform for robust epidemic analysis, with the goal of collaborative, secure, distributed, on-demand, and fast time-to-solution analyses to support public health.
How to Position Your Globus Data Portal for Success Ten Good PracticesGlobus
Science gateways allow science and engineering communities to access shared data, software, computing services, and instruments. Science gateways have gained a lot of traction in the last twenty years, as evidenced by projects such as the Science Gateways Community Institute (SGCI) and the Center of Excellence on Science Gateways (SGX3) in the US, The Australian Research Data Commons (ARDC) and its platforms in Australia, and the projects around Virtual Research Environments in Europe. A few mature frameworks have evolved with their different strengths and foci and have been taken up by a larger community such as the Globus Data Portal, Hubzero, Tapis, and Galaxy. However, even when gateways are built on successful frameworks, they continue to face the challenges of ongoing maintenance costs and how to meet the ever-expanding needs of the community they serve with enhanced features. It is not uncommon that gateways with compelling use cases are nonetheless unable to get past the prototype phase and become a full production service, or if they do, they don't survive more than a couple of years. While there is no guaranteed pathway to success, it seems likely that for any gateway there is a need for a strong community and/or solid funding streams to create and sustain its success. With over twenty years of examples to draw from, this presentation goes into detail for ten factors common to successful and enduring gateways that effectively serve as best practices for any new or developing gateway.
We describe the deployment and use of Globus Compute for remote computation. This content is aimed at researchers who wish to compute on remote resources using a unified programming interface, as well as system administrators who will deploy and operate Globus Compute services on their research computing infrastructure.
May Marketo Masterclass, London MUG May 22 2024.pdfAdele Miller
Can't make Adobe Summit in Vegas? No sweat because the EMEA Marketo Engage Champions are coming to London to share their Summit sessions, insights and more!
This is a MUG with a twist you don't want to miss.
Navigating the Metaverse: A Journey into Virtual Evolution"Donna Lenk
Join us for an exploration of the Metaverse's evolution, where innovation meets imagination. Discover new dimensions of virtual events, engage with thought-provoking discussions, and witness the transformative power of digital realms."
Navigating the Metaverse: A Journey into Virtual Evolution"
Clustering in Data Mining
1. Clustering in Data Mining
Lesson: Data Mining
Professor: Mrs M.Hosseini
Group Members: Mojtaba Derakhshandi,S.Mostafa Sayyedi,Mojtaba Sadeghi
2. Clustering in Data Mining
Our Group:
Mr. Mojtaba Derakhshandi:
*Introduction
*Example Usage of Clustering
*Two Dimensional Space
*Example
*Centroid
Mr. Mojtaba Sadeghi:
Mr. S.Mostafa Sayyedi:
*K-Means Clustering
*Example
*Finding the Best Set of Clusters
*Agglomerative Hierarchical Clustering
*Example
*Recording the Distance Between Clusters
4. Page 4
unlimited
Economics Application
We Might be Interested in Finding Countries
Whose Economies are Similar.
Financial Application
We Might Wish to Find Clusters of Companies
that Have Similar Financial Performance.
Marketing Application
We Might Wish to Find Clusters of Customers
With Similar Buying Behavior.
Medical Application
We Might Wish to Find Clusters of Patients With
Similar Symptoms.
Document Retrieval Application
We Might Wish to Find Clusters of Documents
With Related Content.
Crime Analysis Application
We Might Look for Clusters of High Volume Crimes Such
as Burglaries or Try to Cluster Together Much Rarer (But
Possibly Related) Crimes Such as Murders.
01
02
03
04
05
06
Example Usage of Clustering
Clustering in Data Mining
Mojtaba Derakhshandi
Page: 2
5. Two Dimensional Space
Clustering in Data Mining
Mojtaba Derakhshandi
Object for Clustering Clustering of Objects (First Version)
Page: 3
7. Page 7
unlimited
Centroid:
Clustering in Data Mining
Page: 5
‘Centre’ of a Cluster, Generally Called its Centroid.
So the Centroid of the Four Points (With 6 Attributes):
Would Be:
Mojtaba Derakhshandi
11. Page 11
unlimited
Example:
Clustering in Data Mining
S.Mostafa Sayyedi
Initial Choice of Centroids
Page: 9
Step2: Select k Objects in an Arbitrary Fashion. Use These as the Initial Set of k Centroids
12. Page 12
unlimited
Example:
Clustering in Data Mining
S.Mostafa Sayyedi
Objects for Clustering (Augmented)Page: 10
Step3: Assign Each of the Objects to the Cluster for Which it is Nearest to the Centroid
14. Page 14
unlimited
Example:
Clustering in Data Mining
S.Mostafa Sayyedi
Centroids After First Iteration
Page: 12
Revised Clusters
Step 5: Repeat Steps 3 and 4 Until the Centroids no Longer Move
16. Page 16
unlimited
Finding the Best Set of Clusters:
Clustering in Data Mining
S.Mostafa Sayyedi
Value of Objective Function for Different Values of k
Page: 14
17. Page 17
unlimited
Clustering in Data Mining
Mojtaba Sadeghi
Agglomerative Hierarchical Clustering:
Agglomerative Hierarchical Clustering: Basic Algorithm
Page: 15
19. Clustering in Data Mining
Mojtaba Sadeghi
Original Data (11 Objects) Clusters After Two Passes
Page: 17
20. Clustering in Data Mining
Mojtaba Sadeghi
Without Knowing the Precise Distances Between Each Pair of Objects, a Plausible Sequence of Events is as Follows.
Page: 18
21. Clustering in Data Mining
Mojtaba Sadeghi
A Possible Dendrogram CorrespondingPage: 19
22. Clustering in Data Mining
Mojtaba Sadeghi
Example of a Distance Matrix
Page: 20
Recording the Distance Between Clusters:
23. Clustering in Data Mining
Mojtaba Sadeghi
Distance Matrix After First Merger (Incomplete)
Page: 21
Distance Matrix After First Merger
Recording the Distance Between Clusters:
24. Clustering in Data Mining
Mojtaba Sadeghi
Distance Matrix After Two Merger (Incomplete)
Page: 22
Recording the Distance Between Clusters:
Distance Matrix After Two Merger
25. Clustering in Data Mining
Mojtaba Sadeghi
Distance Matrix After Three Mergers (Incomplete)
Page: 23
Recording the Distance Between Clusters:
Distance Matrix After Three Mergers
26. Clustering in Data Mining
Mojtaba Sadeghi
Distance Matrix After Four Mergers (Incomplete)
Page: 24
Recording the Distance Between Clusters:
Distance Matrix After Four Mergers
27. Clustering in Data Mining
Mojtaba Sadeghi
Dendrogram Corresponding to Hierarchical Clustering Process
Page: 25
29. Resource
Principles of Data Mining
Third Edition
Prof. Max Bramer
School of Computing
University of Portsmouth
Portsmouth, Hampshire, UK
Publisher: Springer
29
Section Break “All Content is editable
How Edit/Fill Shape Color -> “Right Click” on the Object, select “Format Shape”, choose “Fill” a color from color pallete (bucket icon-on the right side on New Powerpoint)
How to Group an Object/Shape -> “Right Click” on the Object (More than 1), select “Group” > “Group”
How to Ungroup an Object/Shape -> “Right Click” on the Object, select “Group” > “Ungroup”
Book Option “All Content is editable
How Edit/Fill Shape Color -> “Right Click” on the Object, select “Format Shape”, choose “Fill” a color from color pallete (bucket icon-on the right side on New Powerpoint)
How to Group an Object/Shape -> “Right Click” on the Object (More than 1), select “Group” > “Group”
How to Ungroup an Object/Shape -> “Right Click” on the Object, select “Group” > “Ungroup”
INTRODUCTION page “All Content is editable
For edit Footer or visible content you must getting to the Master Slide -> click “VIEW” tab -> in the “Master Views” group, click “Slide Master”. (–and- or you can changeyour logo on there”)
INTRODUCTION page “All Content is editable
For edit Footer or visible content you must getting to the Master Slide -> click “VIEW” tab -> in the “Master Views” group, click “Slide Master”. (–and- or you can changeyour logo on there”)
Timeline page “All Content is editable
How Edit/Fill Shape Color -> “Right Click” on the Object, select “Format Shape”, choose “Fill” a color from color pallete (bucket icon-on the right side on New Powerpoint)
NOTE: Please ungroup the object/shape before, if you want to change an individual shape.
How to Group an Object/Shape -> “Right Click” on the Object (More than 1), select “Group” > “Group”
How to Ungroup an Object/Shape -> “Right Click” on the Object, select “Group” > “Ungroup”
Hand Attractive “All Content is editable
How Edit/Fill Shape Color -> “Right Click” on the Object, select “Format Shape”, choose “Fill” a color from color pallete (bucket icon-on the right side on New Powerpoint)
How to Group an Object/Shape -> “Right Click” on the Object (More than 1), select “Group” > “Group”
How to Ungroup an Object/Shape -> “Right Click” on the Object, select “Group” > “Ungroup”