Downloaded 14 times

![ Direct Marketing
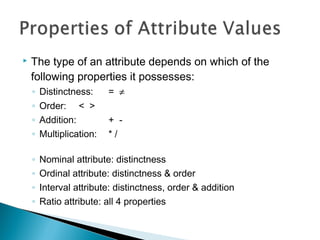
◦ Goal: Reduce cost of mailing by targeting a set of
consumers likely to buy a new cell-phone product.
◦ Approach:
Use the data for a similar product introduced before.
We know which customers decided to buy and which decided
otherwise. This {buy, don’t buy} decision forms the class
attribute.
Collect various demographic, lifestyle, and company-interaction
related information about all such customers.
Type of business, where they stay, how much they earn, etc.
Use this information as input attributes to learn a classifier
model.
From [Berry & Linoff] Data Mining Techniques, 1997](https://image.slidesharecdn.com/classification-150505141544-conversion-gate02/85/Classification-4-320.jpg)
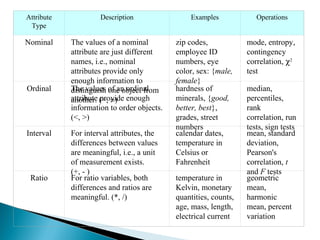
![ Customer Attrition:
◦ Goal: To predict whether a customer is likely to be lost to
a competitor.
◦ Approach:
Use detailed record of transactions with each of the past and
present customers, to find attributes.
How often the customer calls, where he calls, what time-of-the
day he calls most, his financial status, marital status, etc.
Label the customers as loyal or disloyal.
Find a model for loyalty.
From [Berry & Linoff] Data Mining Techniques, 1997](https://image.slidesharecdn.com/classification-150505141544-conversion-gate02/85/Classification-6-320.jpg)
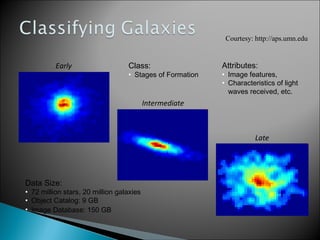
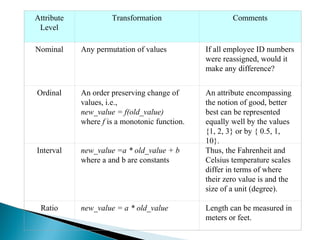
![ Sky Survey Cataloging
◦ Goal: To predict class (star or galaxy) of sky objects,
especially visually faint ones, based on the telescopic
survey images (from Palomar Observatory).
3000 images with 23,040 x 23,040 pixels per image.
◦ Approach:
Segment the image.
Measure image attributes (features) - 40 of them per object.
Model the class based on these features.
Success Story: Could find 16 new high red-shift quasars, some
of the farthest objects that are difficult to find!
From [Fayyad, et.al.] Advances in Knowledge Discovery and Data Mining, 1996](https://image.slidesharecdn.com/classification-150505141544-conversion-gate02/85/Classification-7-320.jpg)
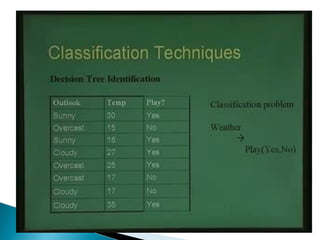
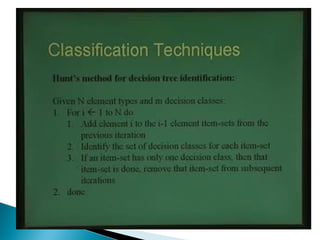
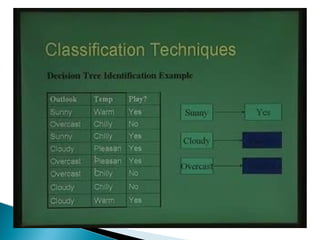
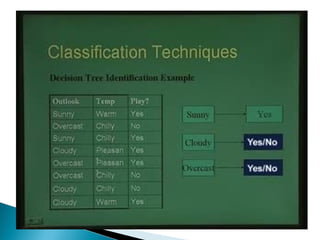
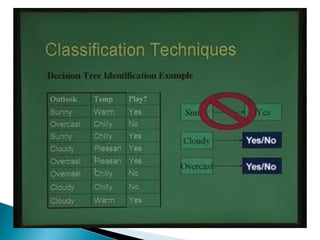
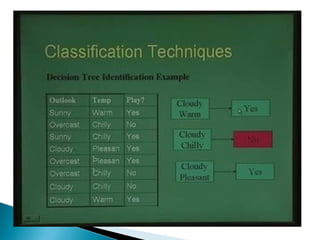
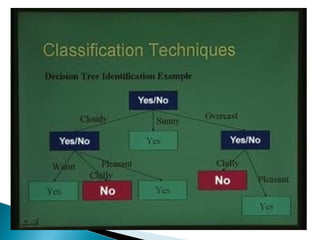
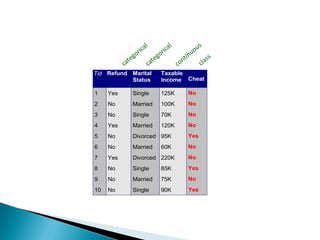
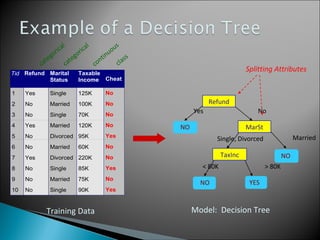
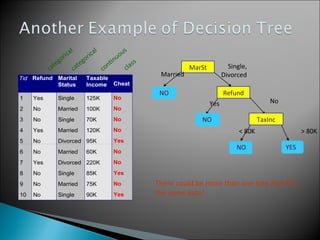
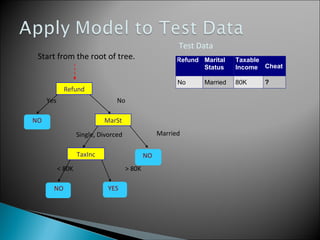


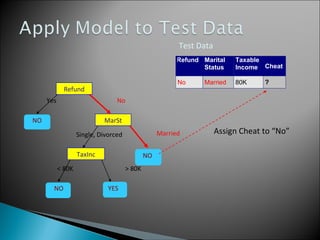
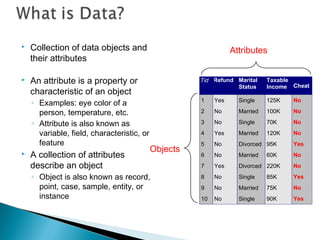

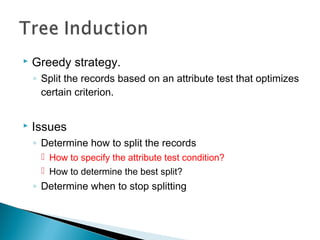
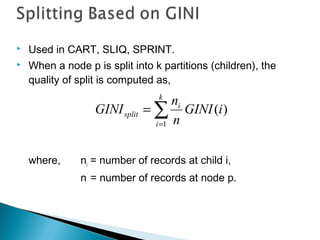
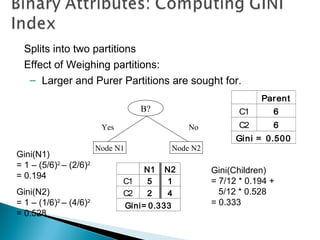
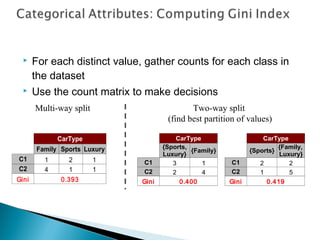
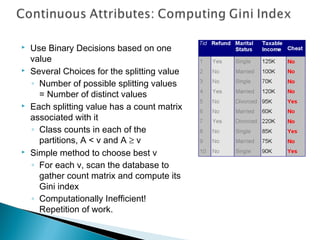
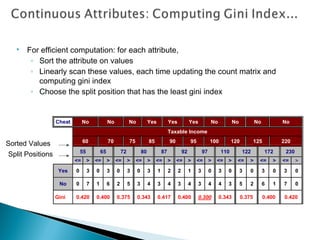


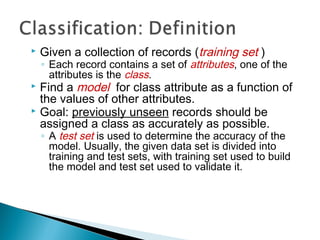
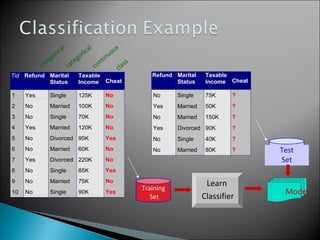
The document discusses classification, which involves using a training dataset containing records with attributes and classes to build a model that can predict the class of previously unseen records. It describes dividing the dataset into training and test sets, with the training set used to build the model and test set to validate it. Decision trees are presented as a classification method that splits records recursively into partitions based on attribute values to optimize a metric like GINI impurity, allowing predictions to be made by following the tree branches. The key steps of building a decision tree classifier are outlined.