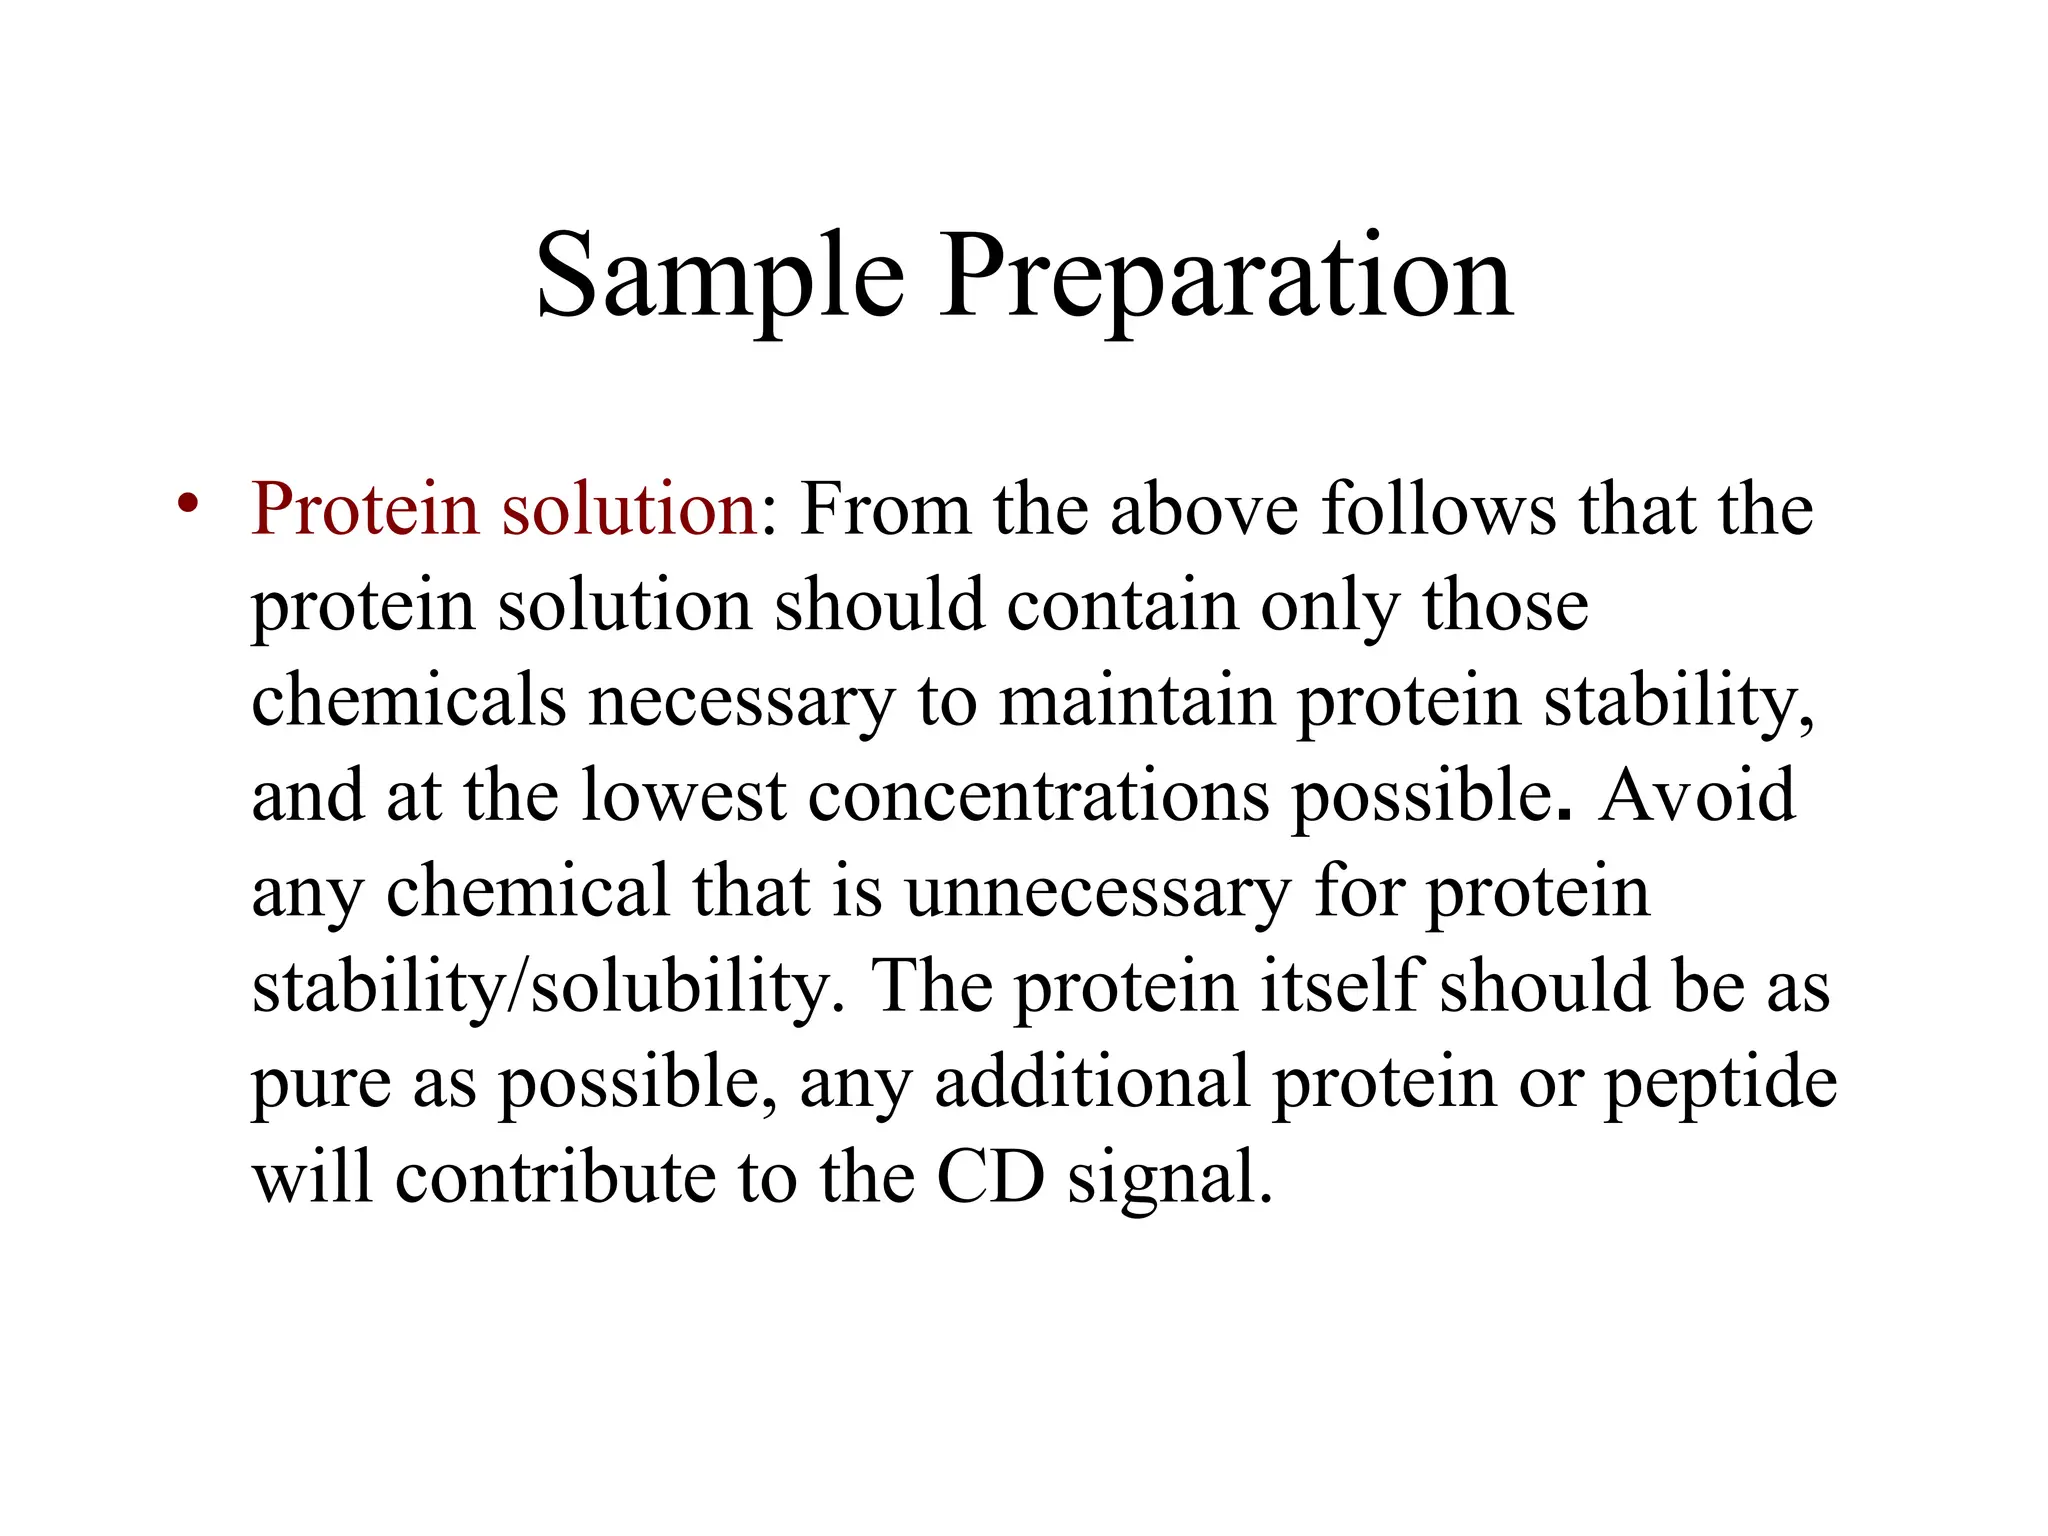
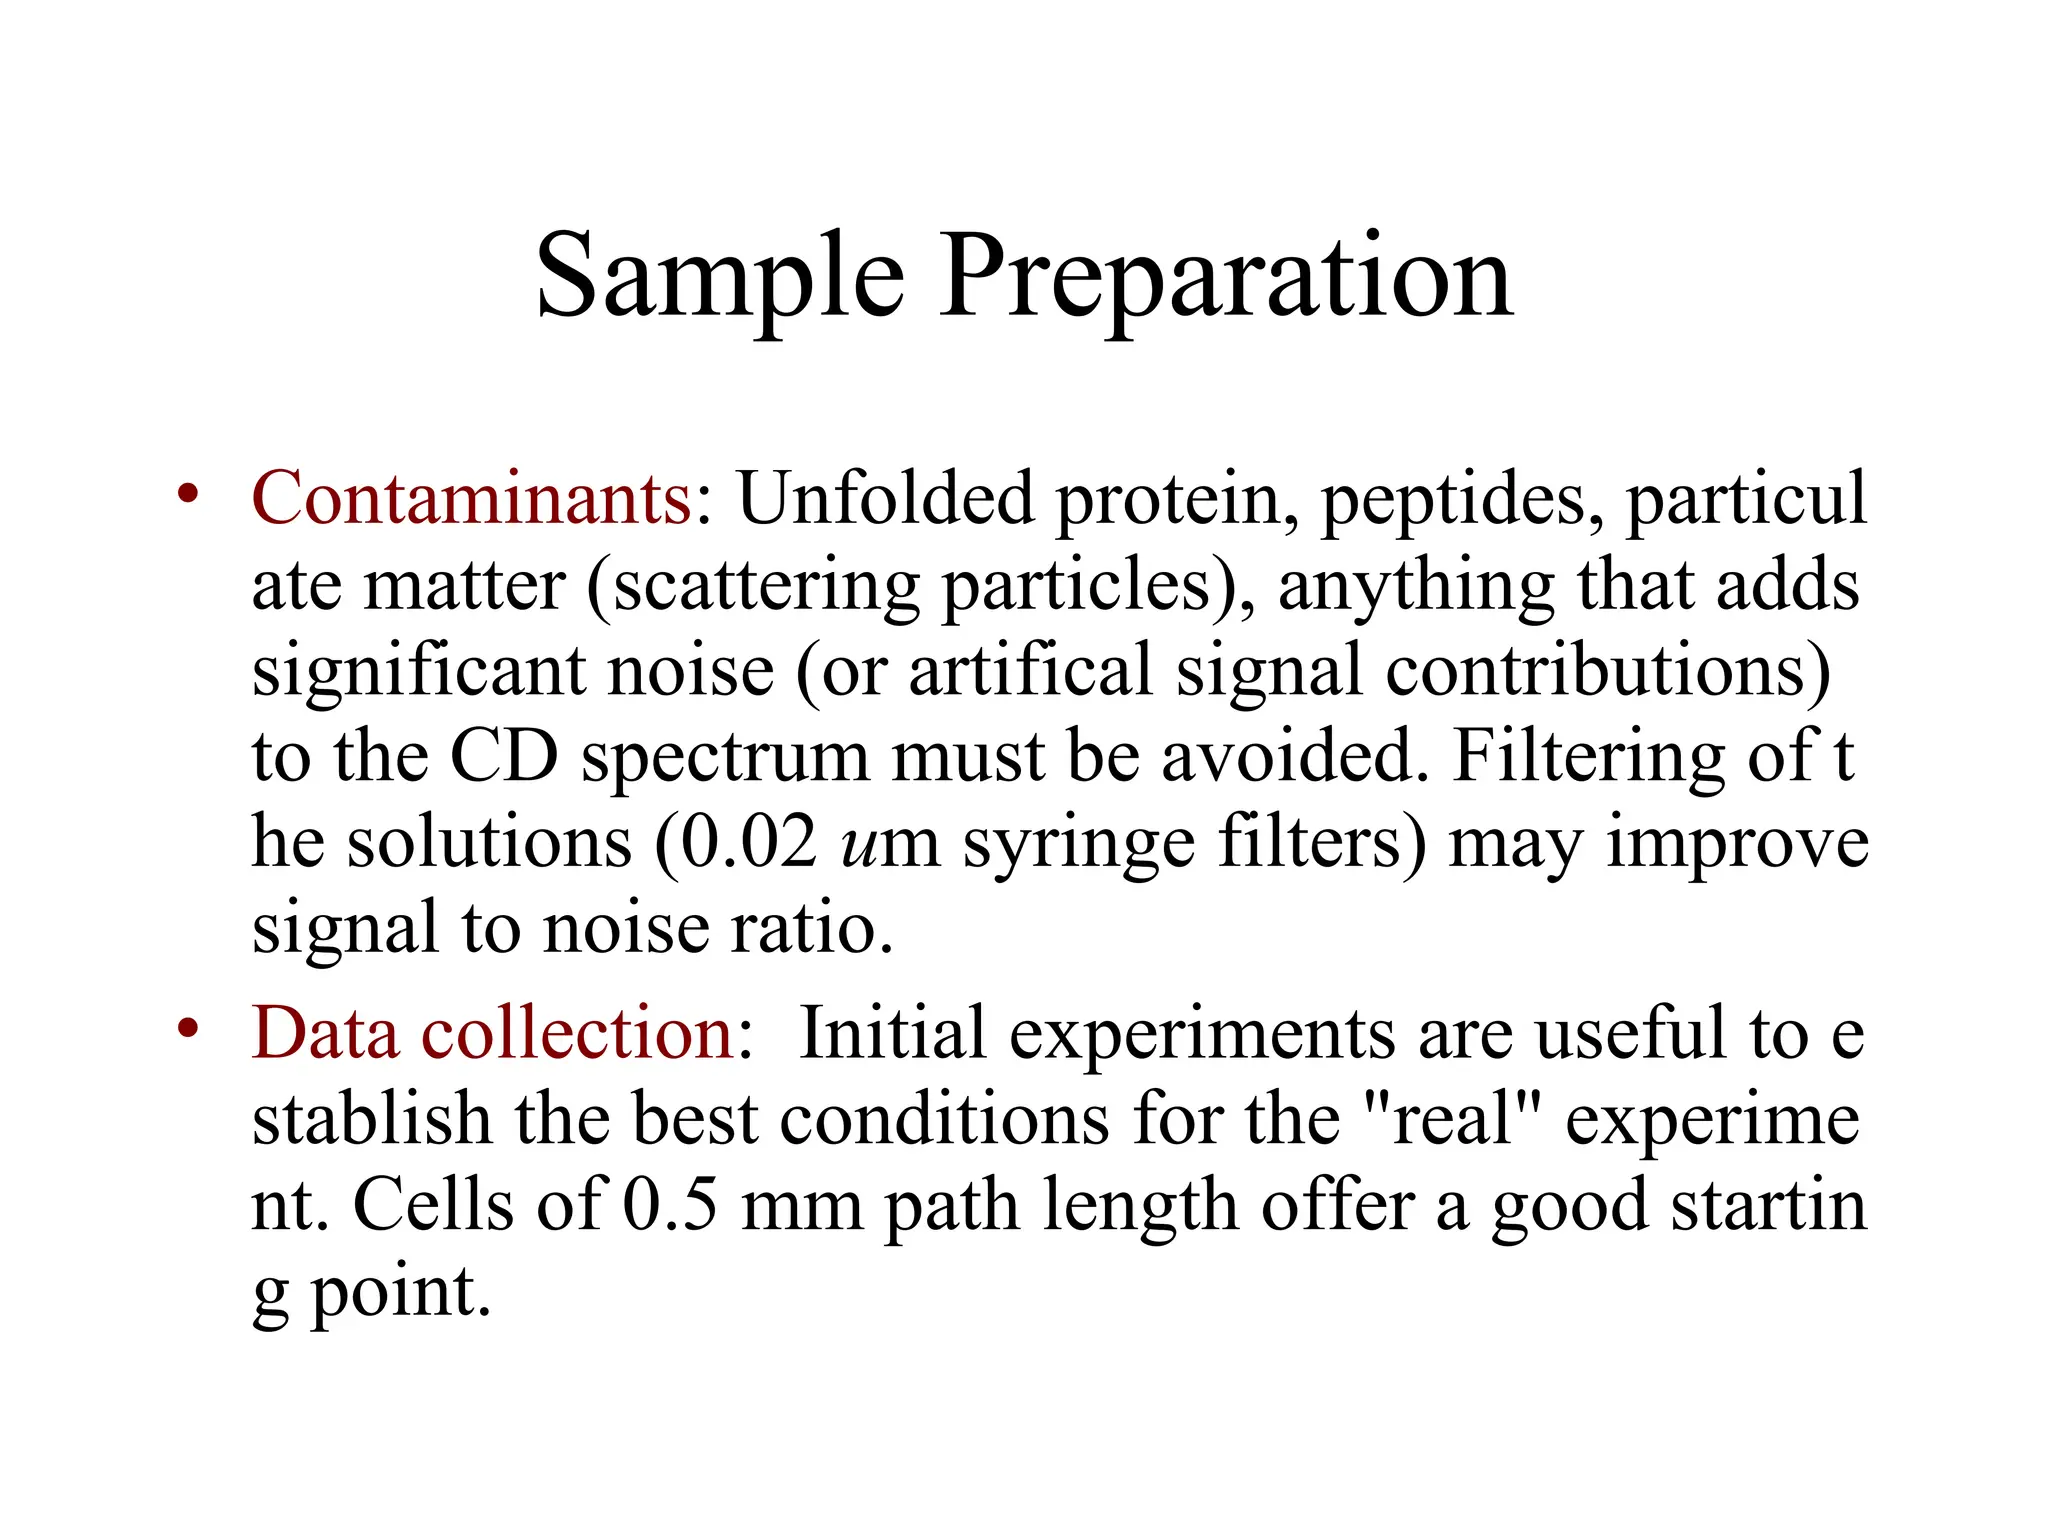
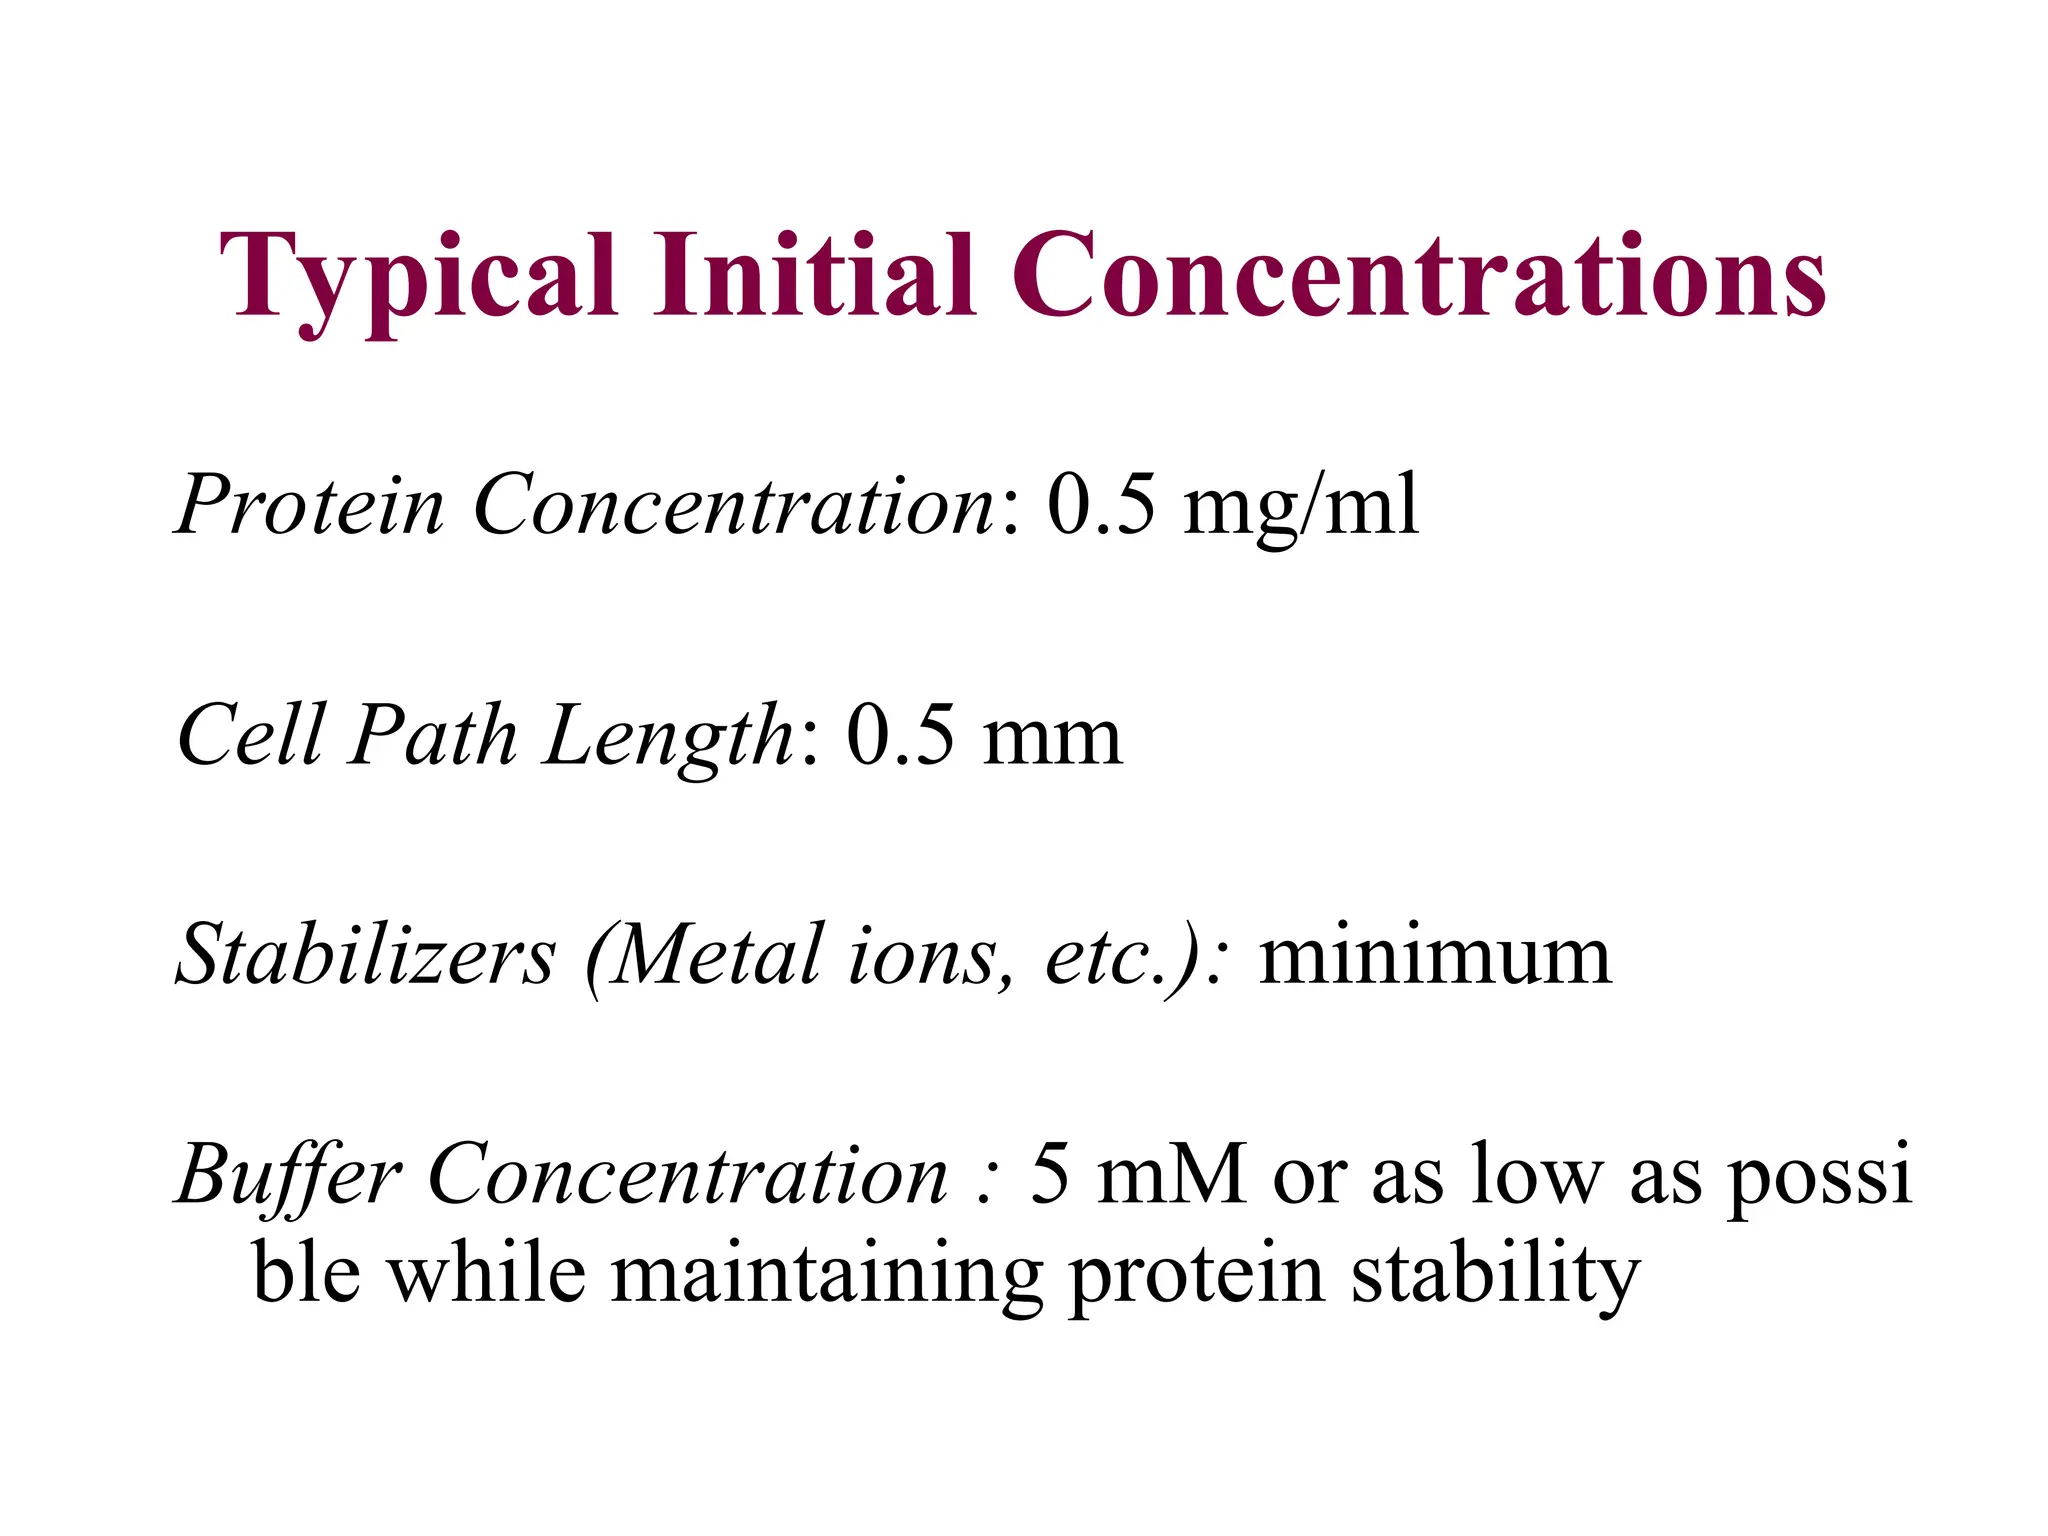
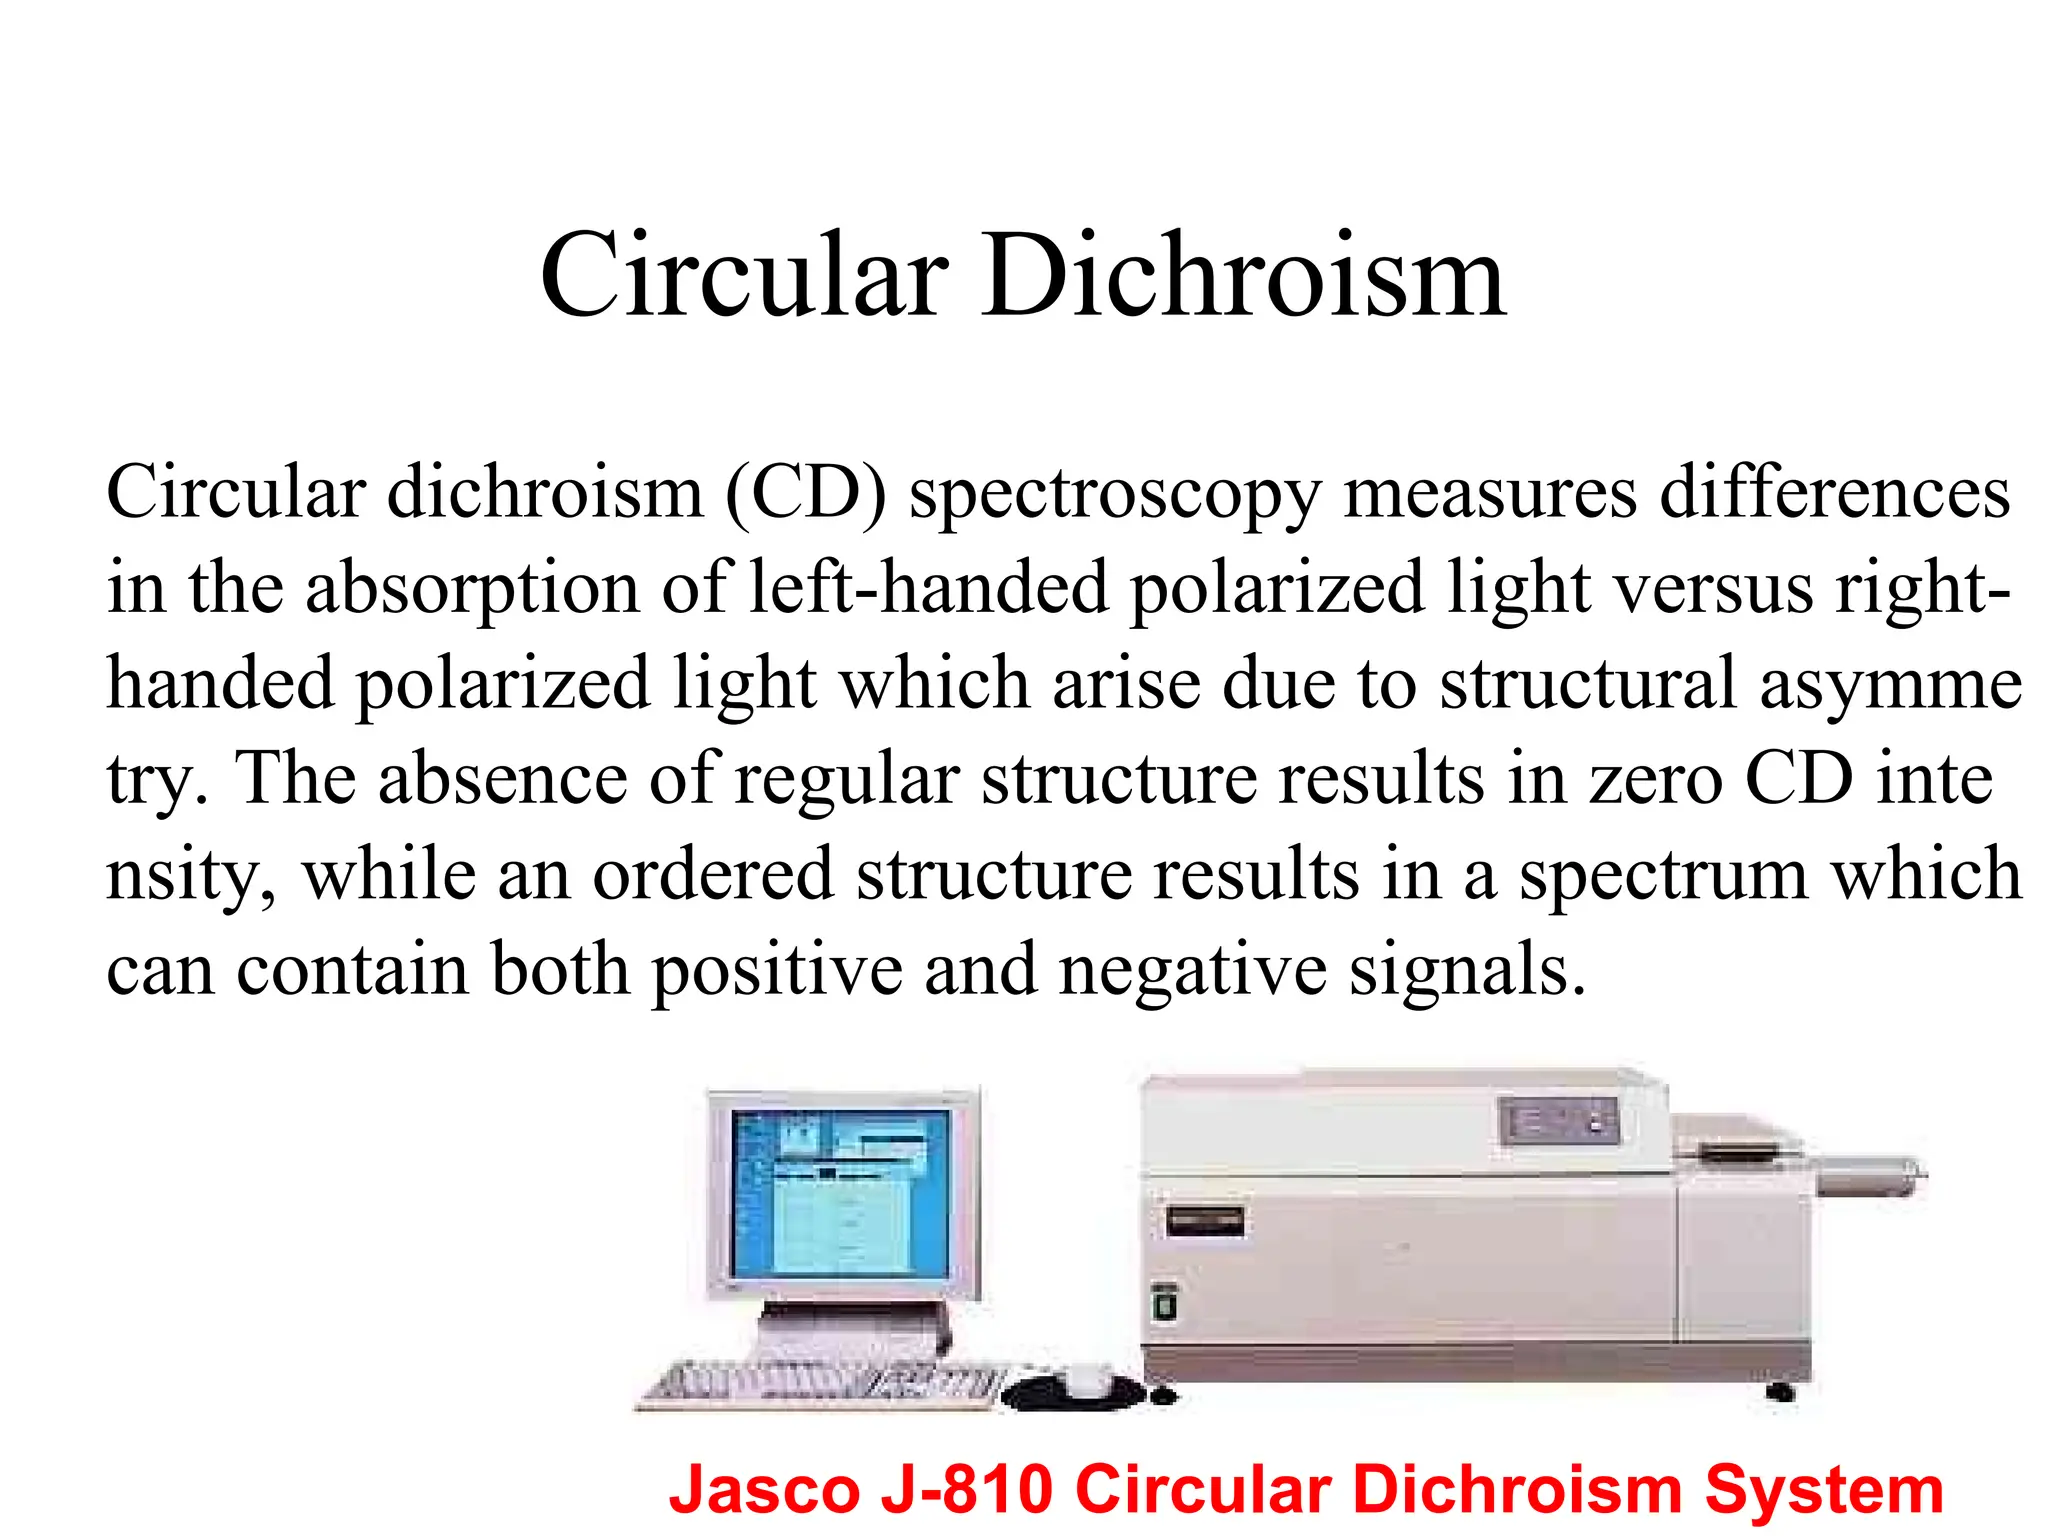
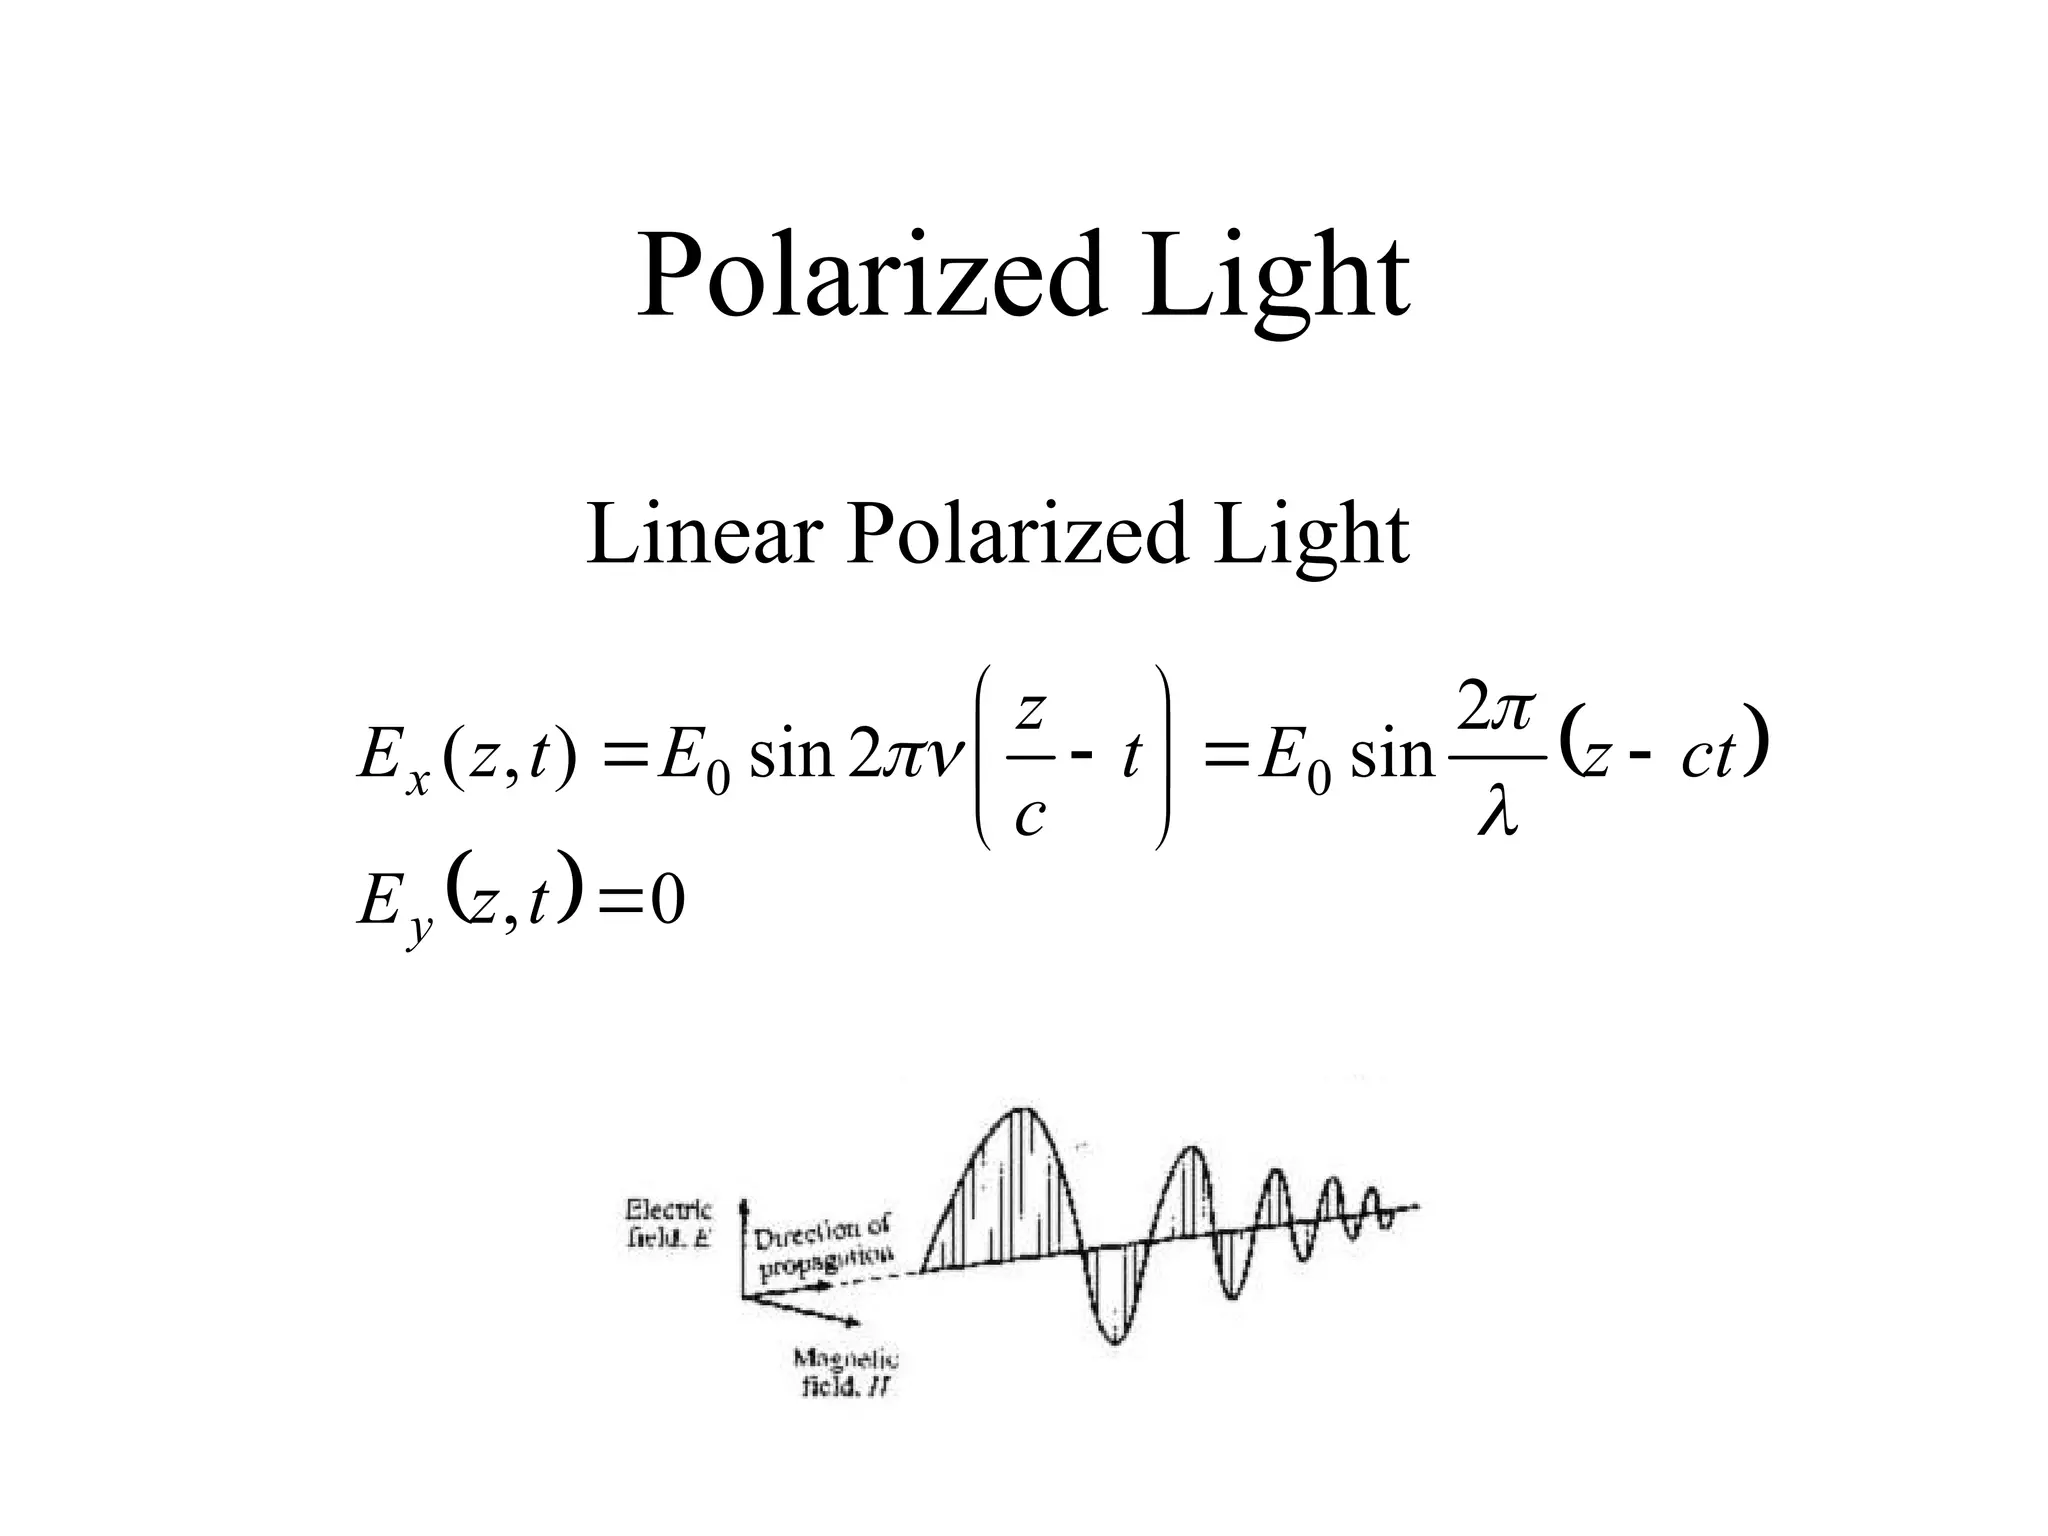
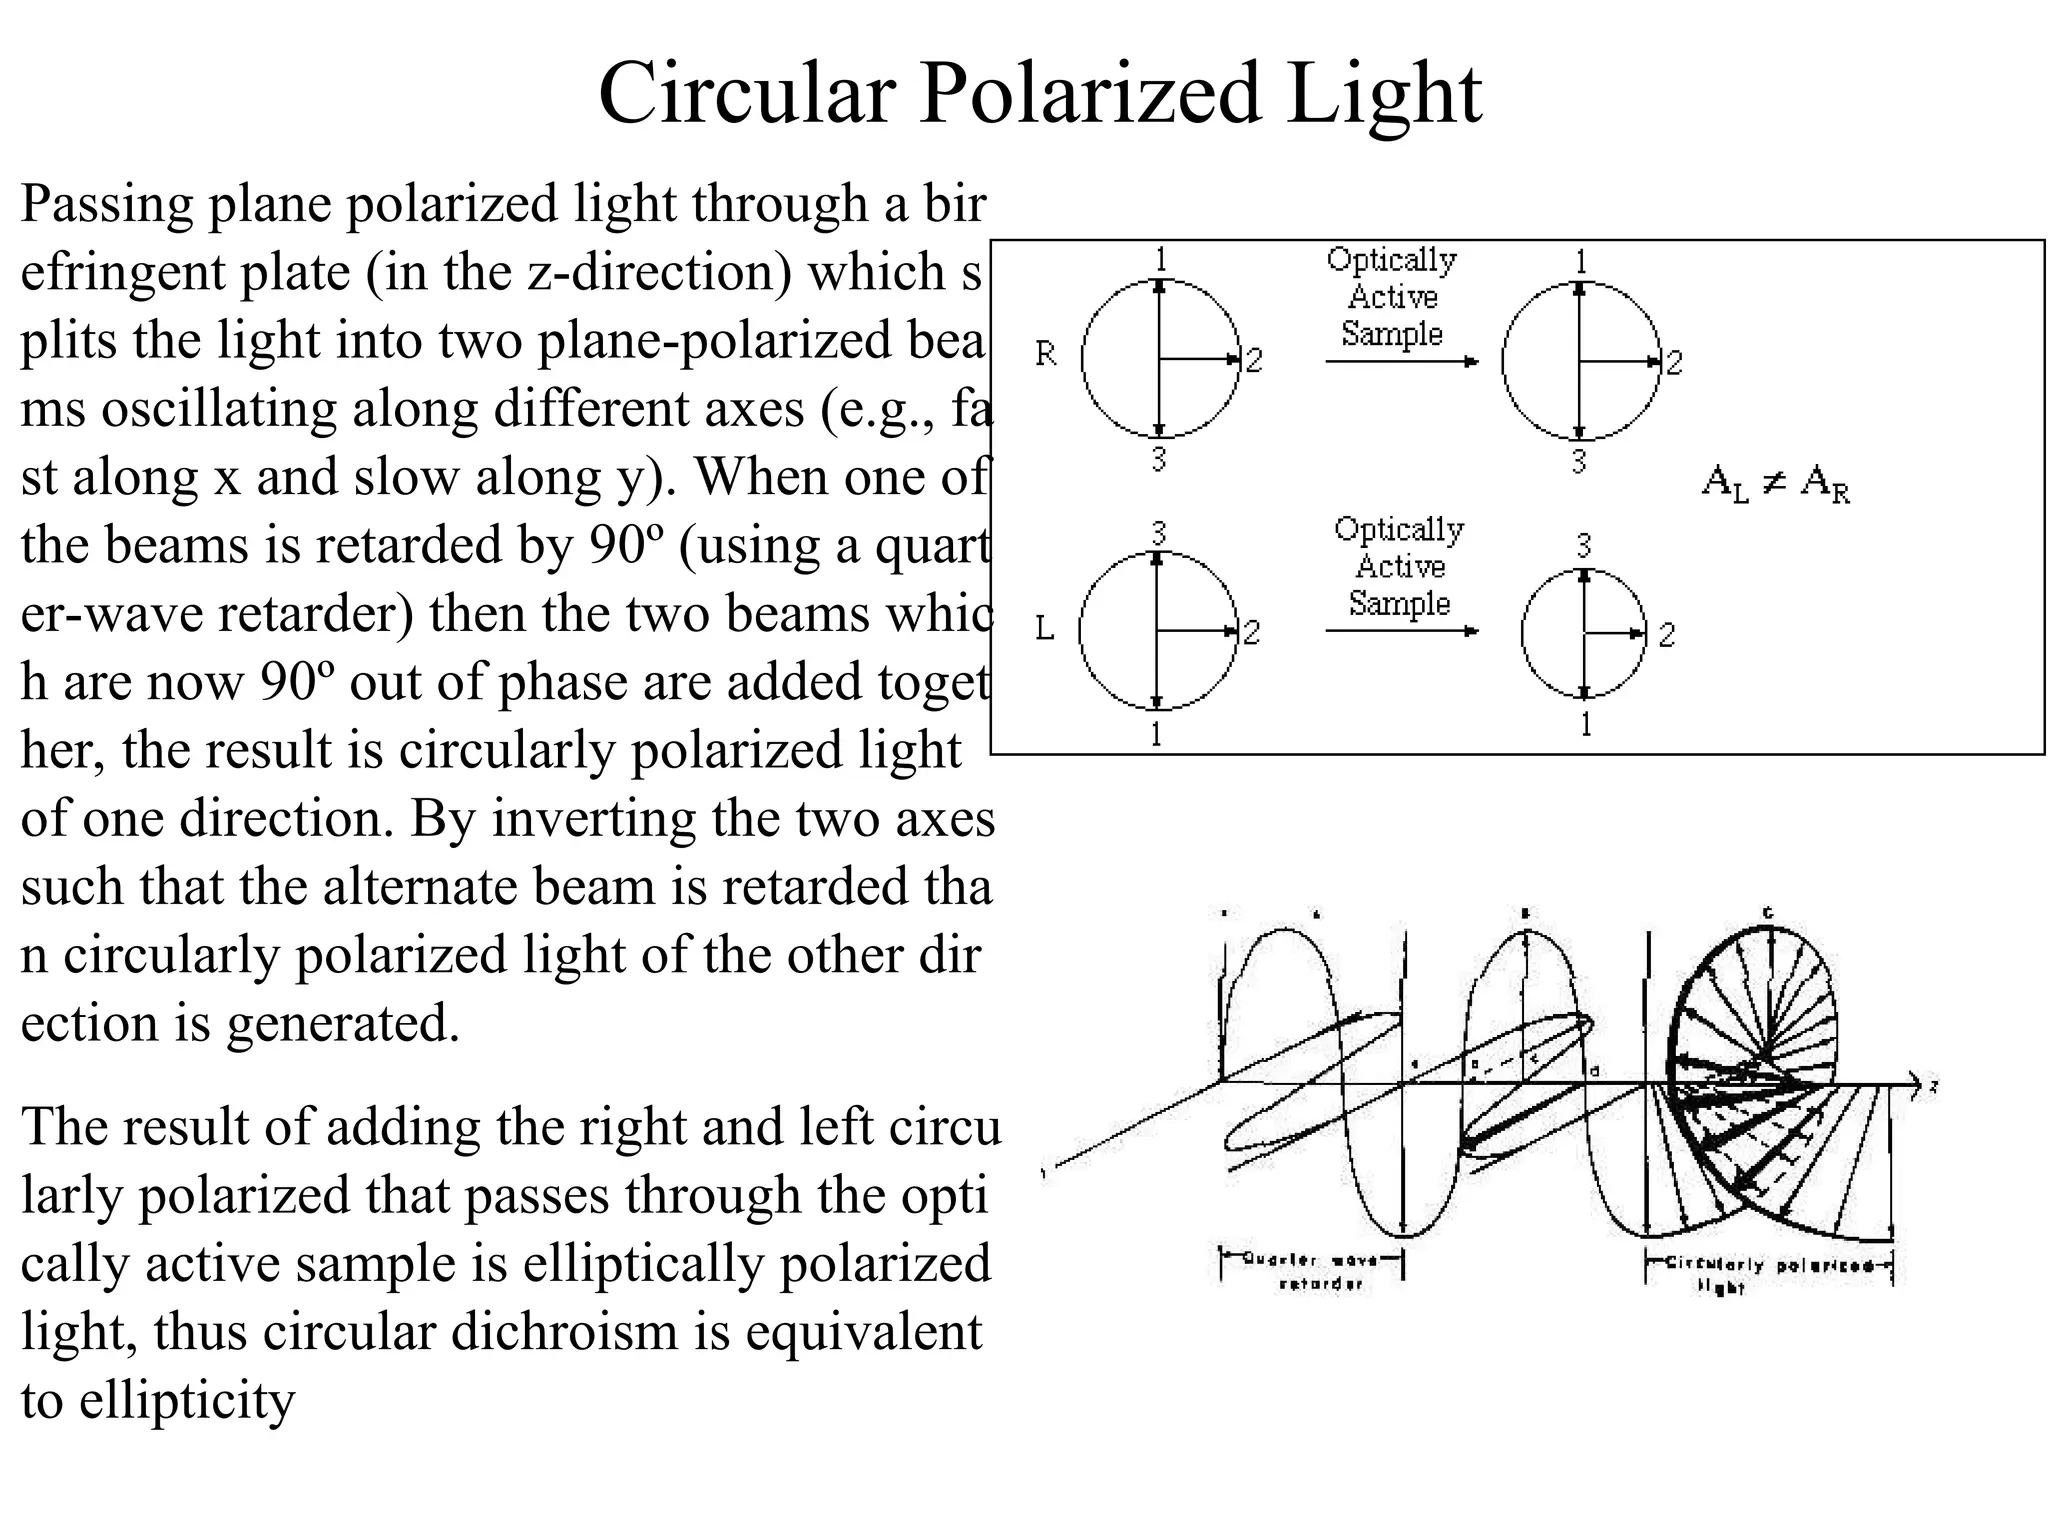
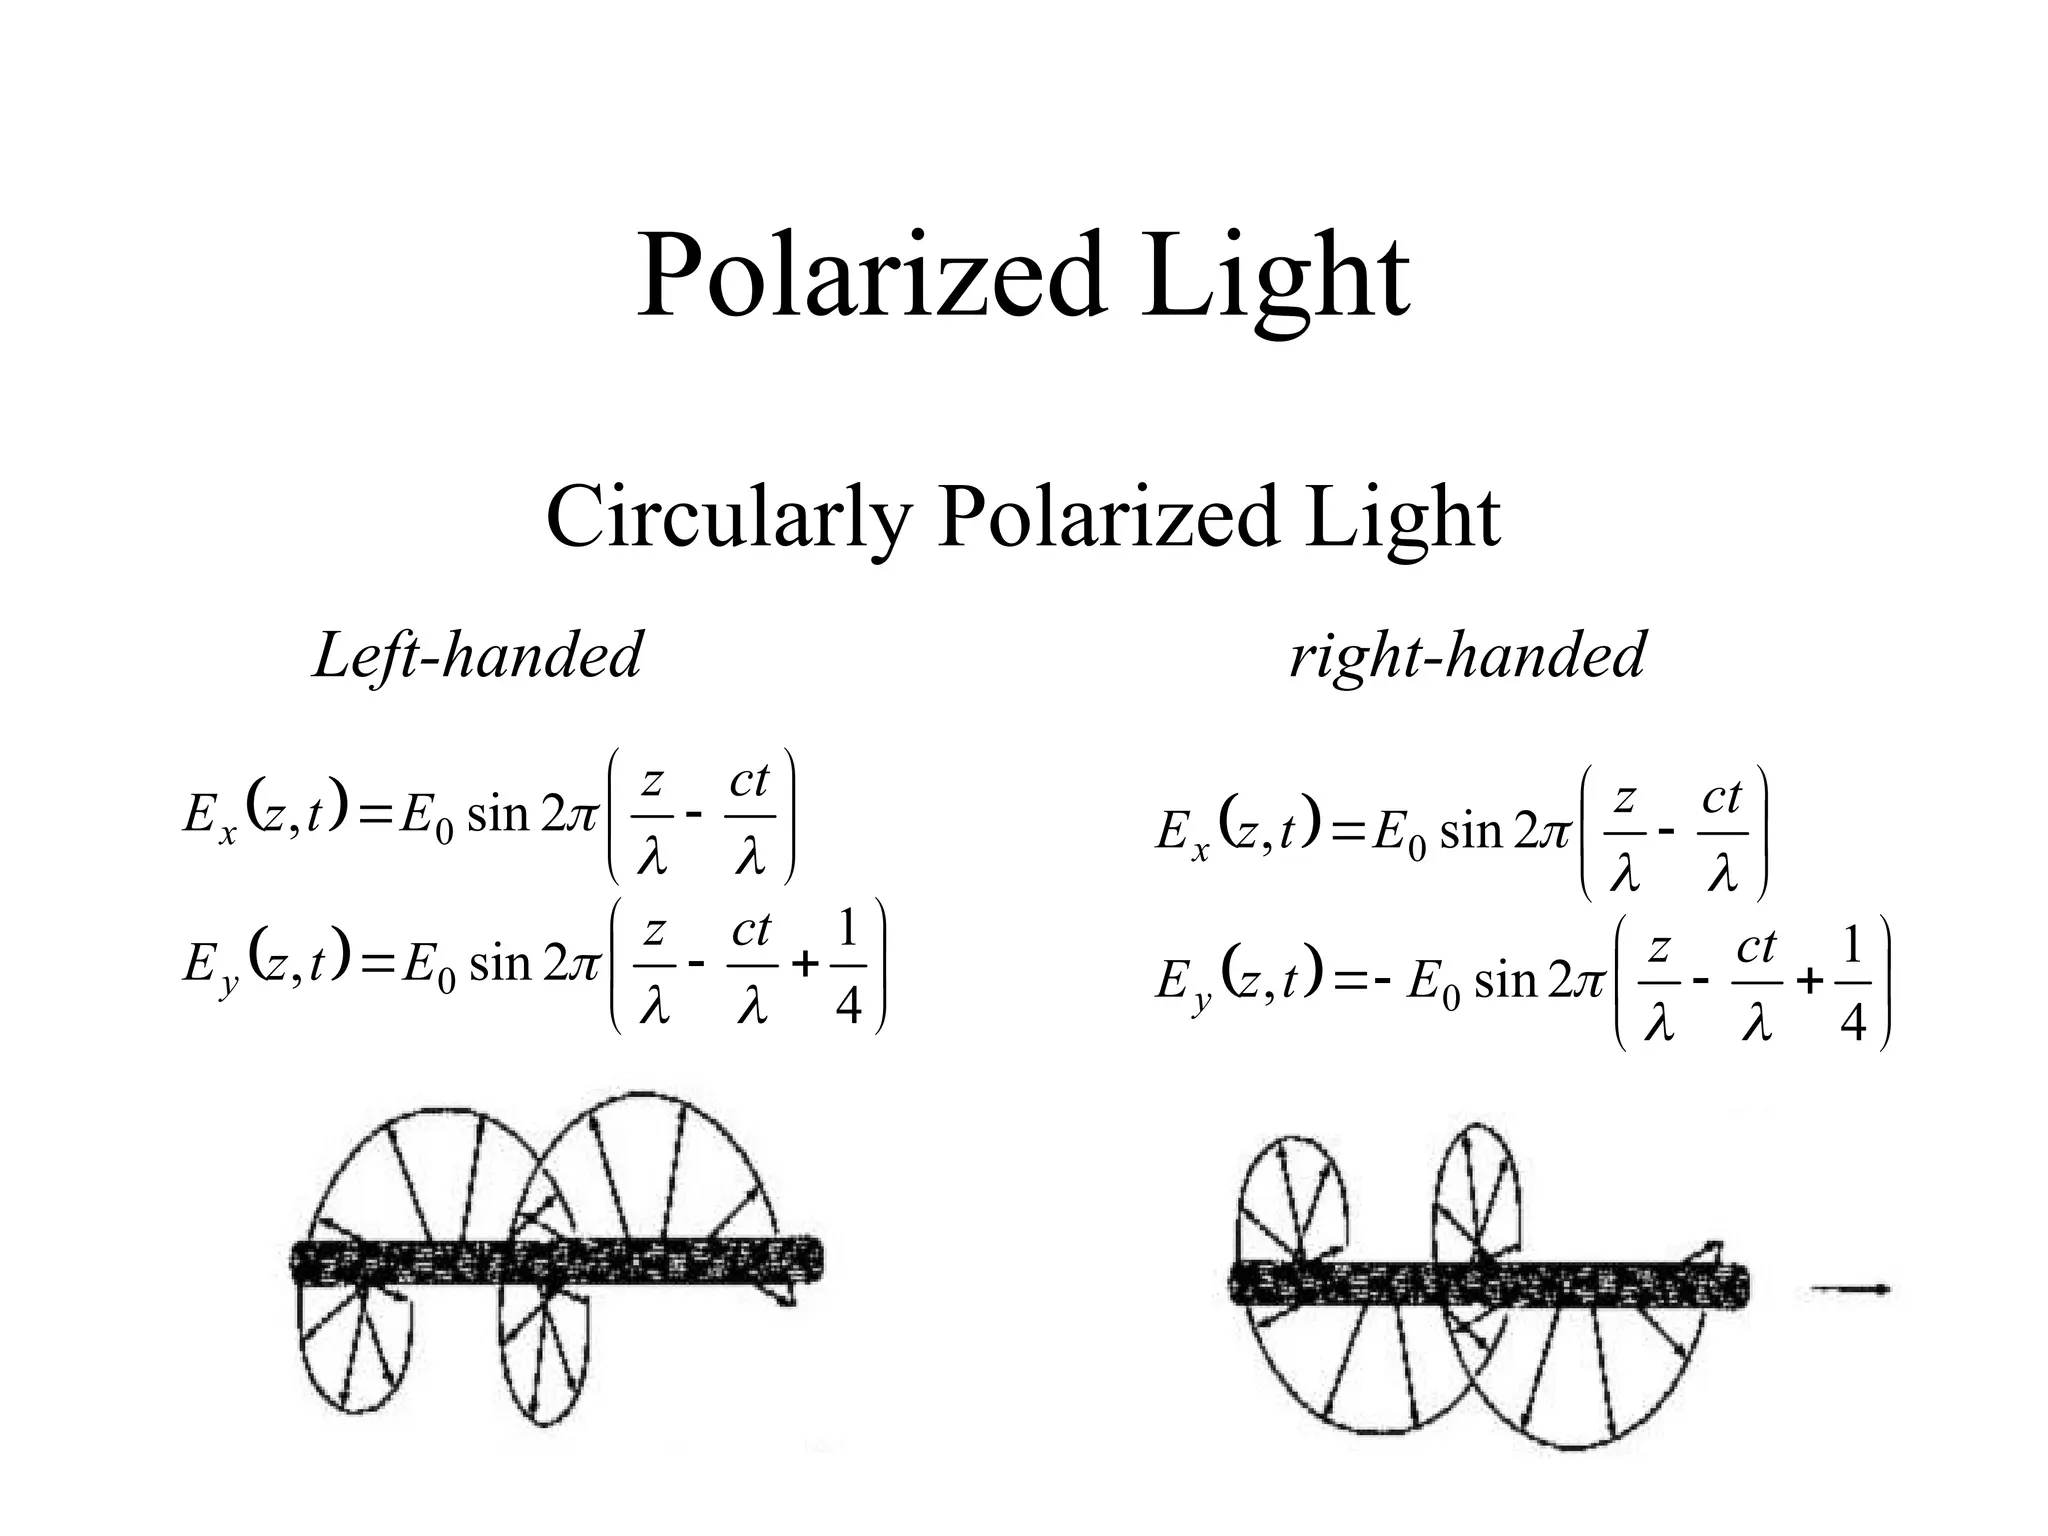
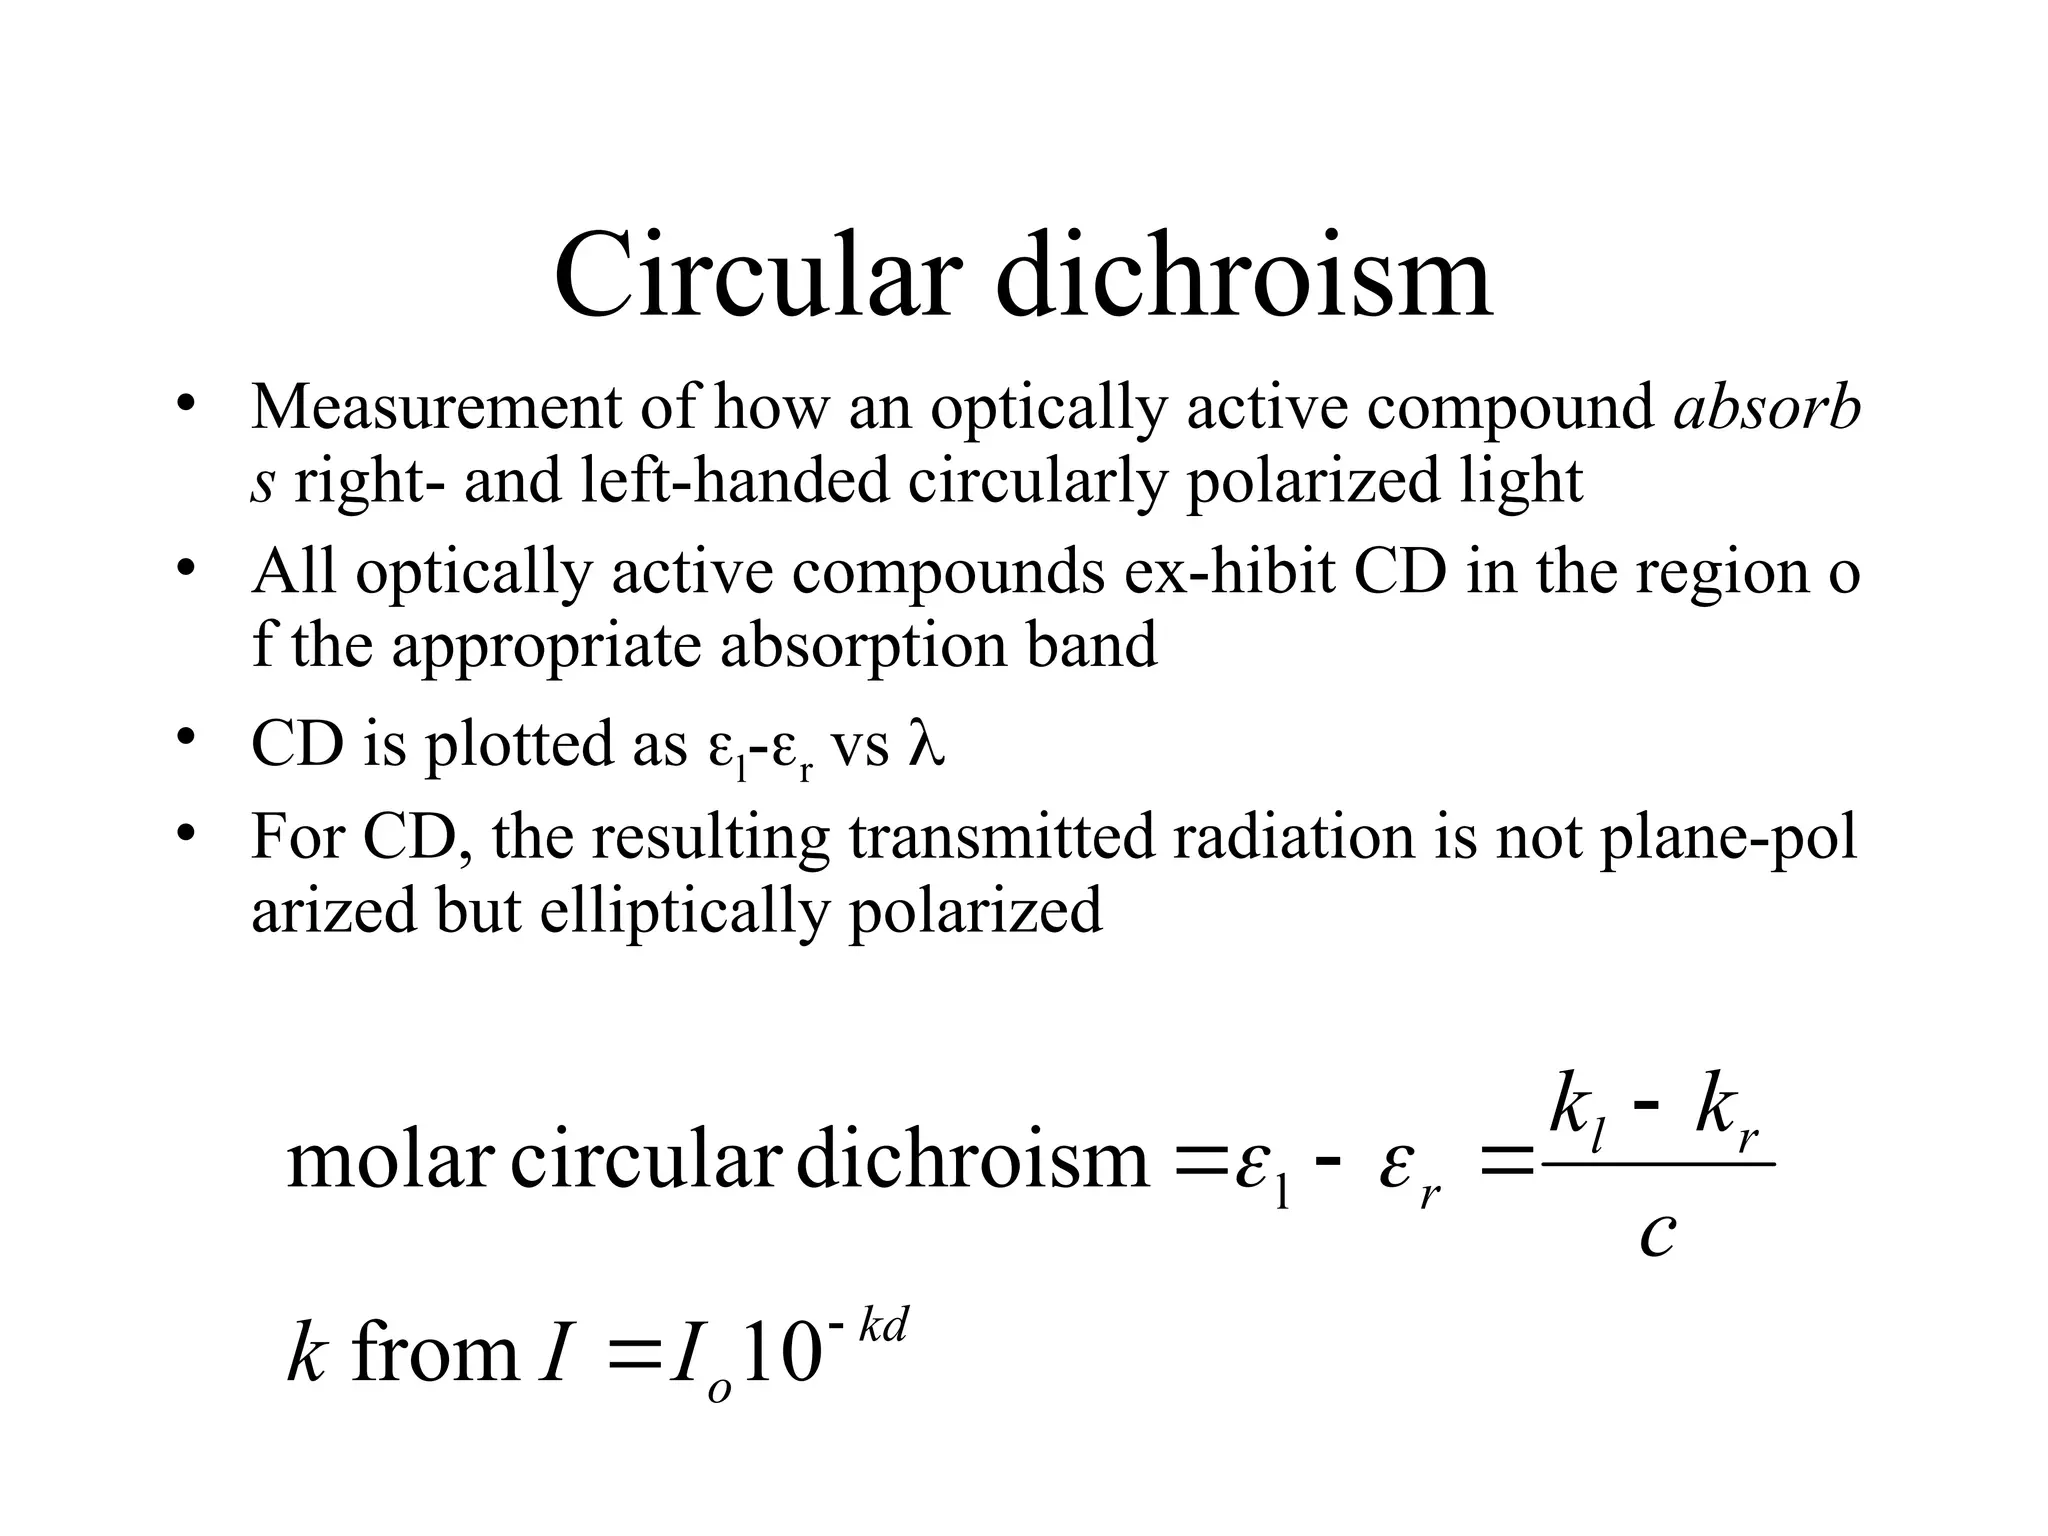
This document provides an introduction to circular dichroism (CD) spectroscopy, explaining its principles, including the measurement of light absorption differences between left- and right-handed polarized light due to structural asymmetry. It details the types of polarized light, the effects of optical rotation and dispersion, and the relationship between CD and optical properties of optically active compounds. Additionally, it outlines sample preparation techniques and data collection standards to optimize CD measurements.
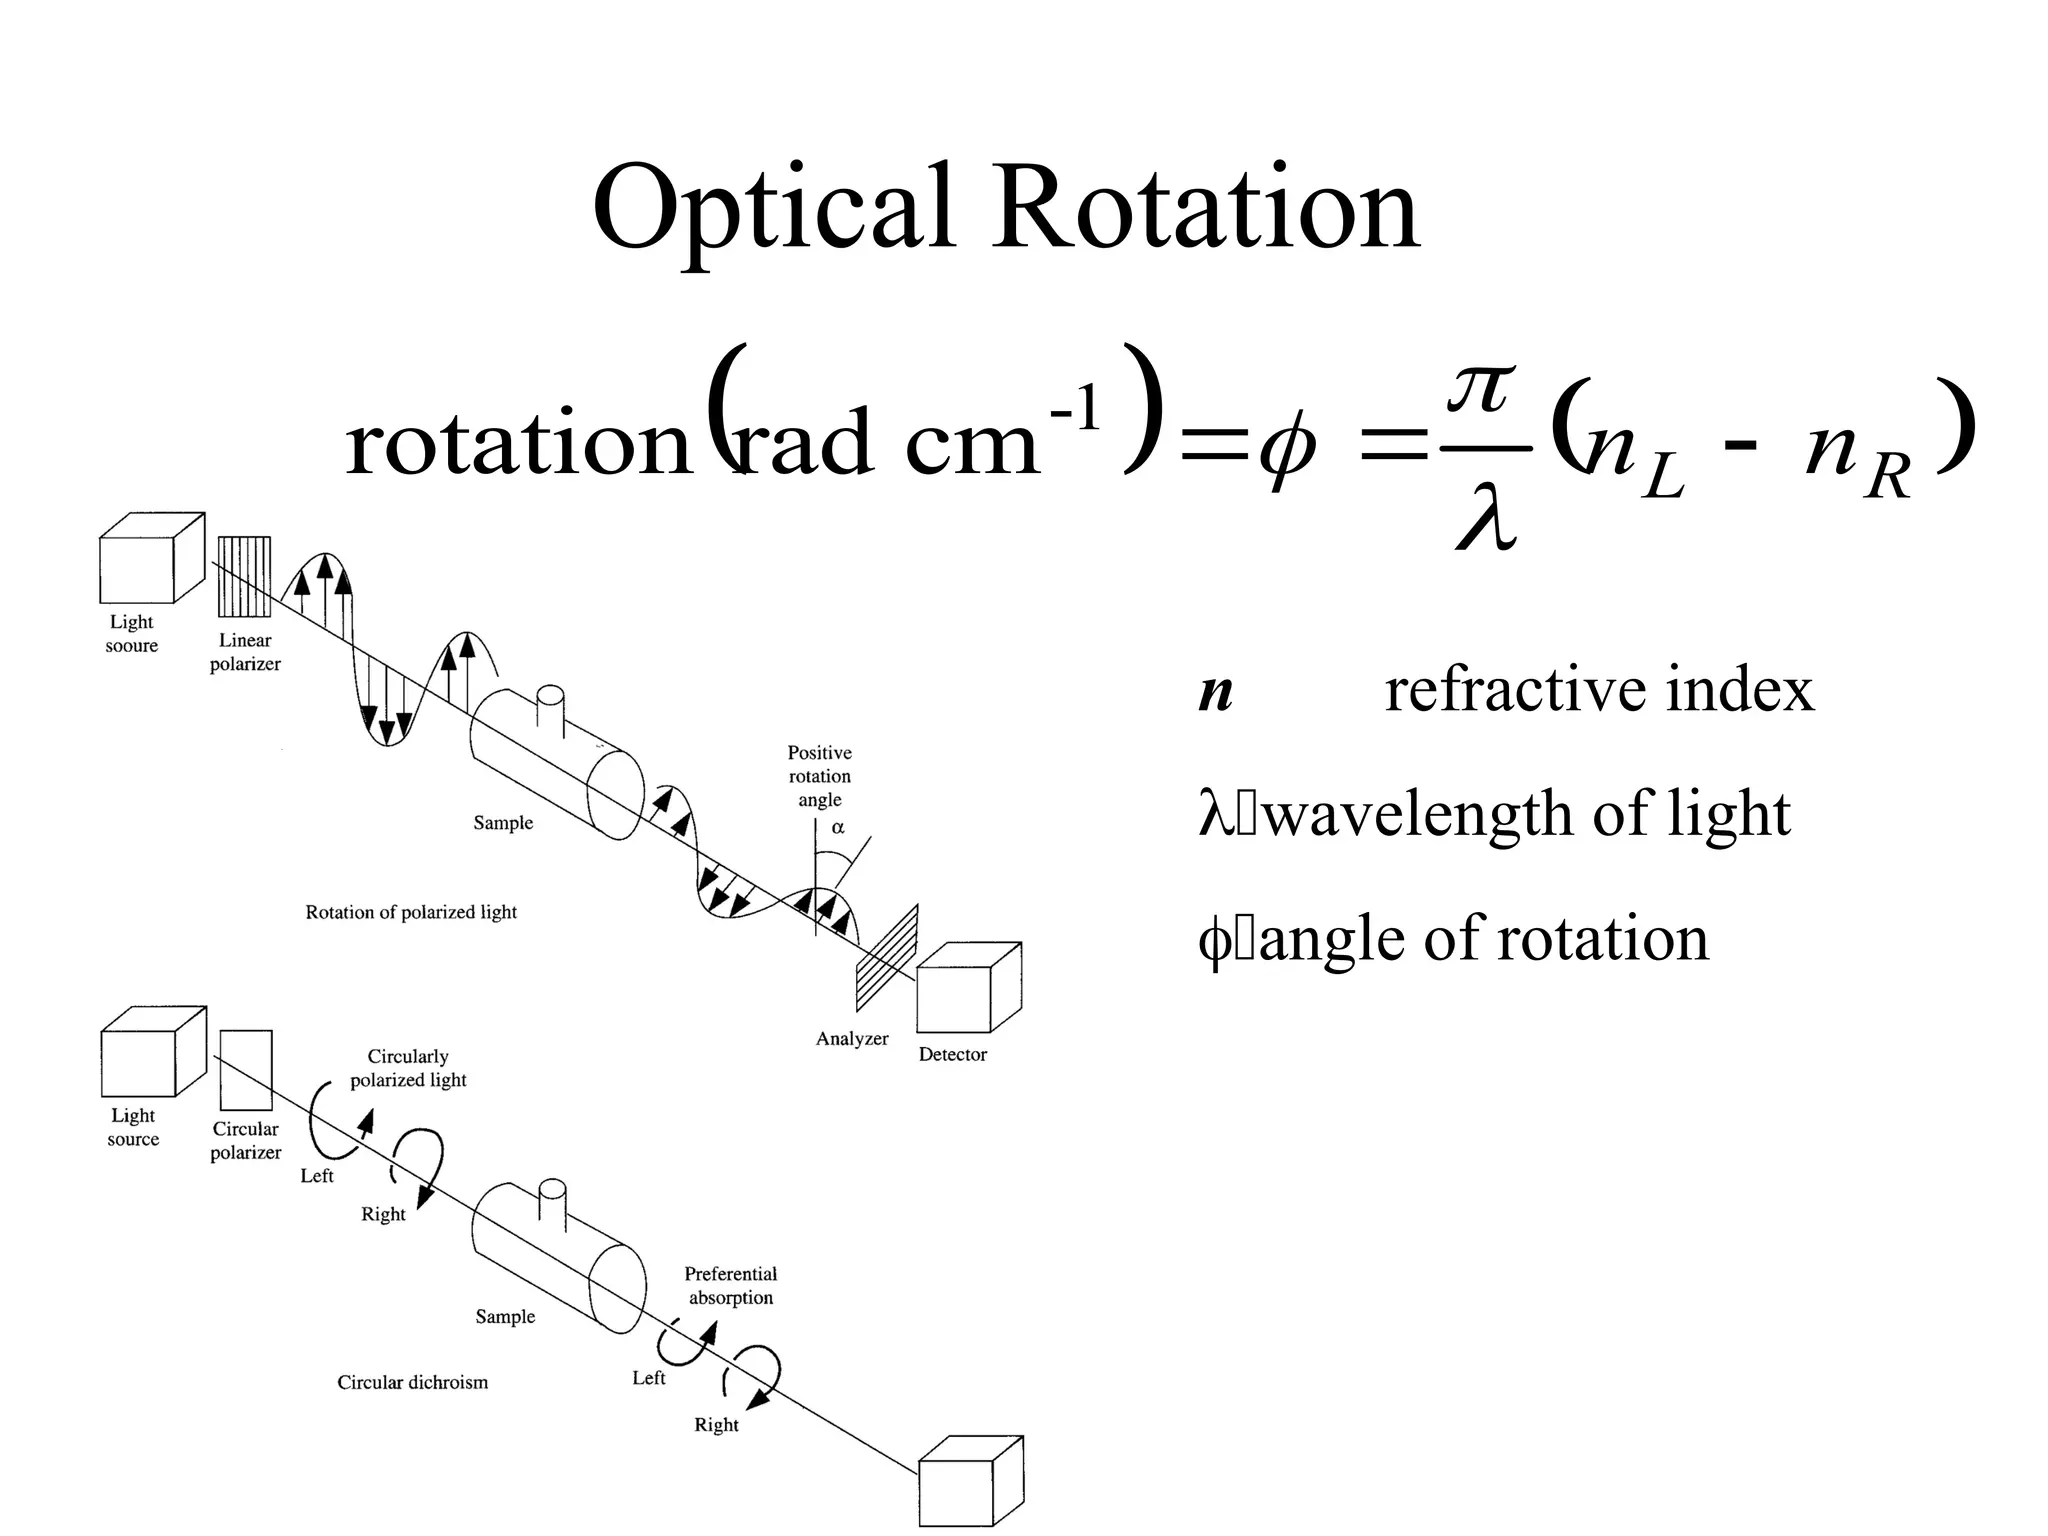
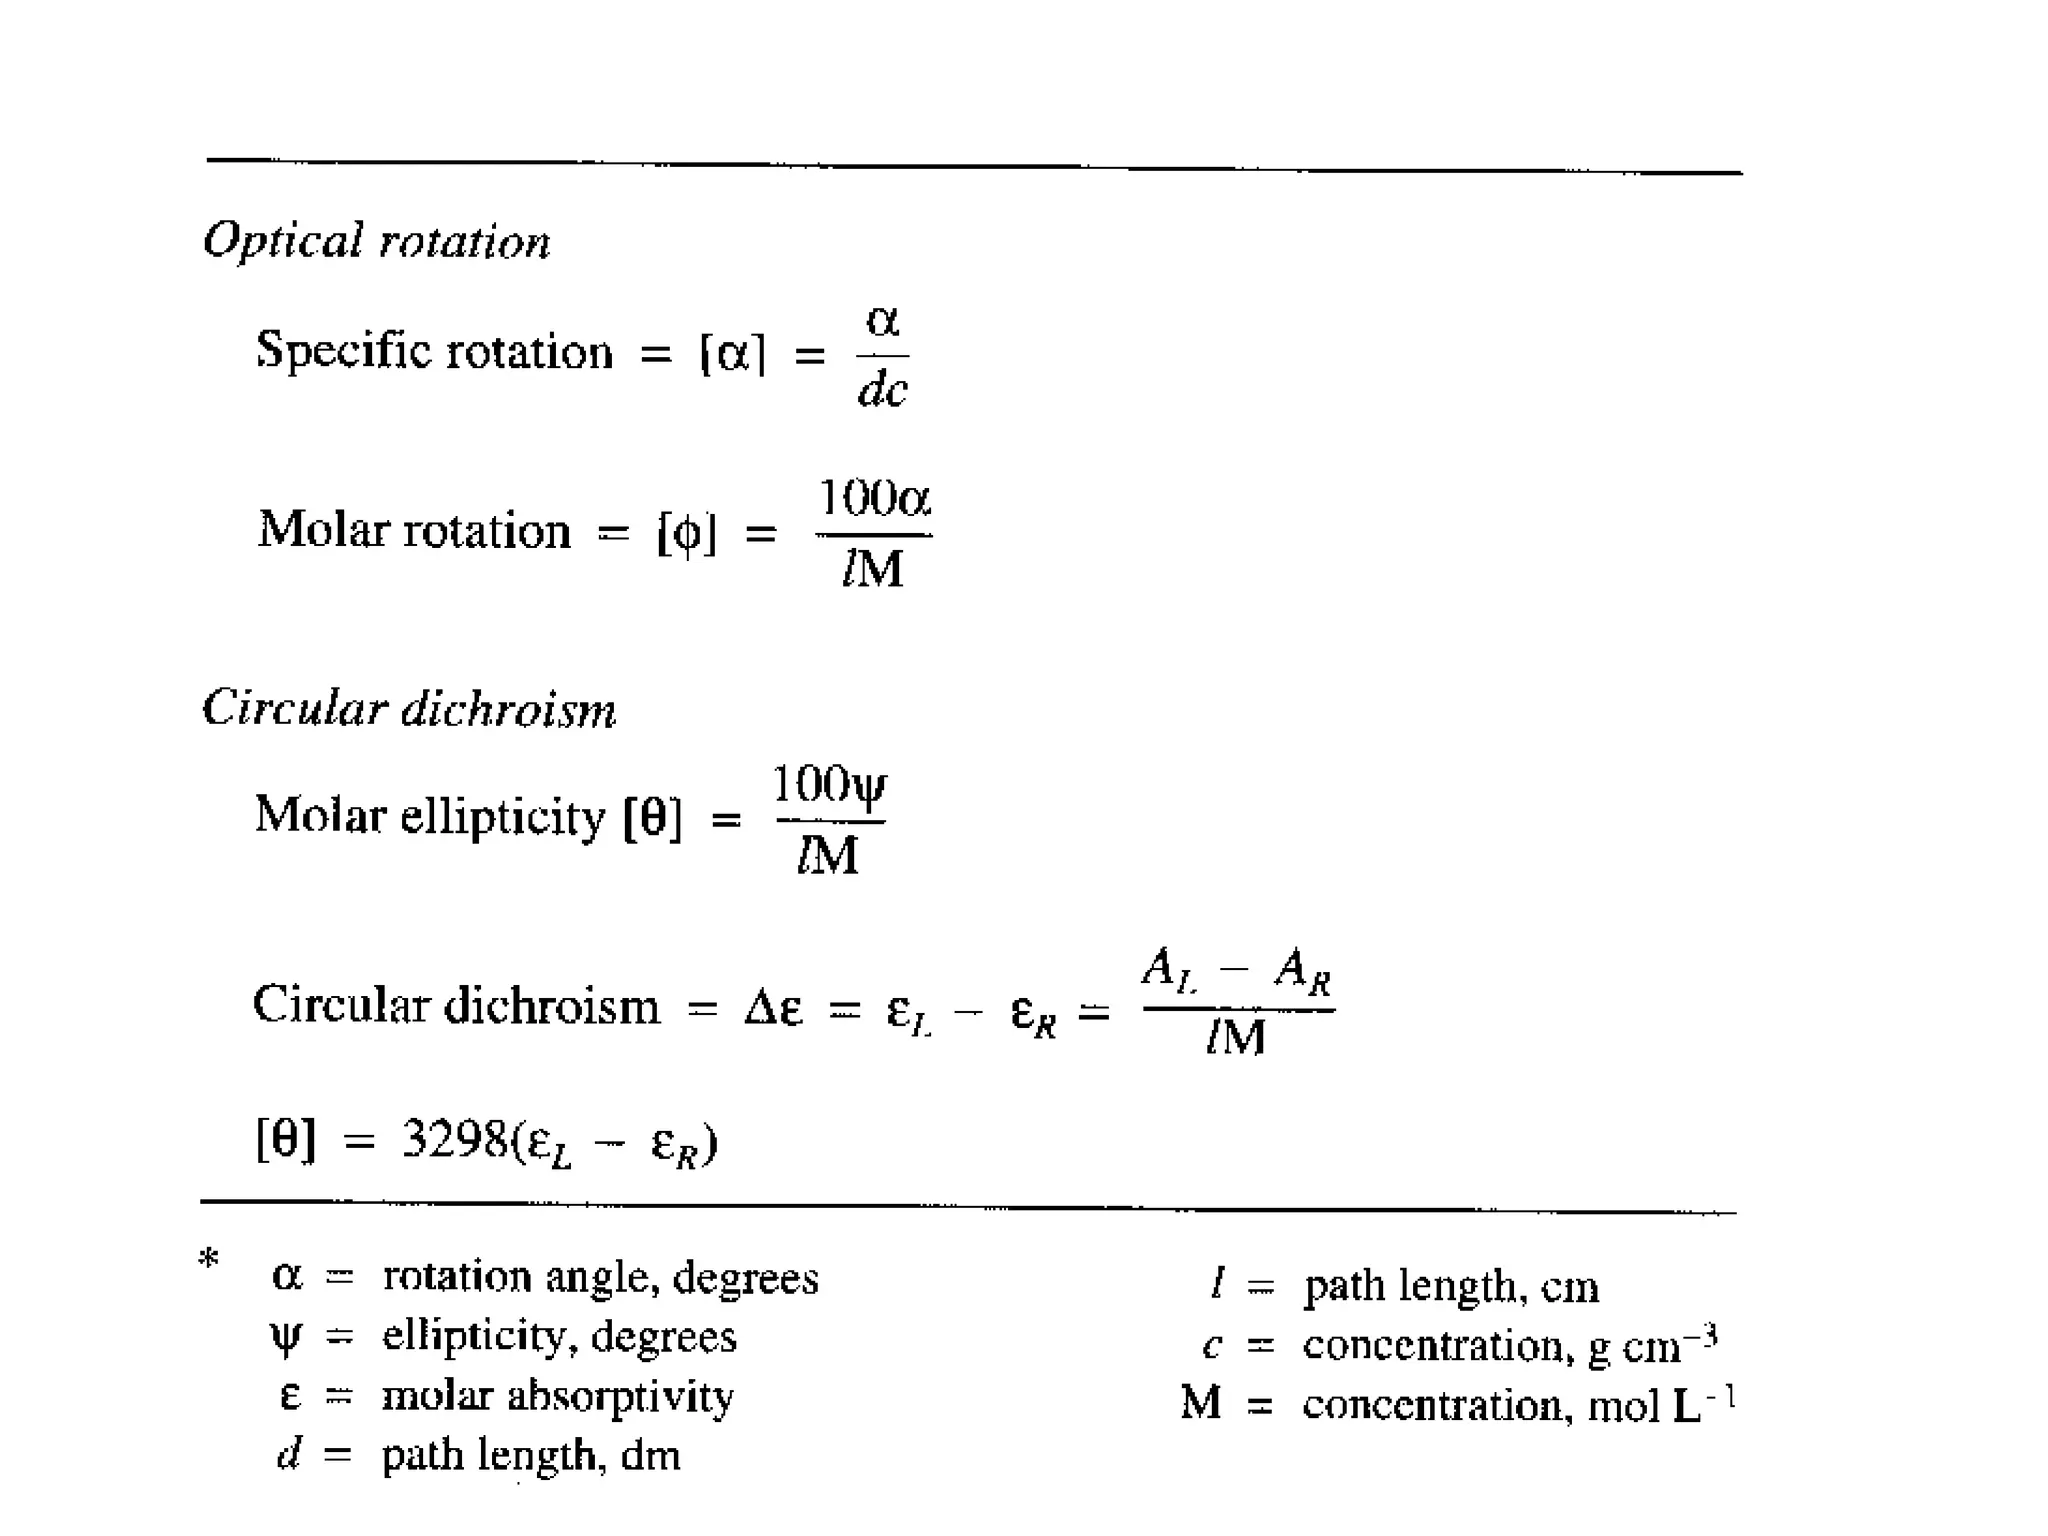
![Optical Rotation
• Usually reported as a specific rotation [],
measured at a particular T, concentration and
(normally 589; the Na D line)
• Molar rotation [] = []MW10-2
mL
100
g
c
decimeters
in
pathlength
lc
α
10
α
2
l](https://image.slidesharecdn.com/cdi-241010121333-a401d4e1/75/Circular-Dichroism-applications-and-principles-11-2048.jpg)
![Optical rotary dispersion
d'
c'
α
α
• Concentration of an optically active substance, c’, expressed in g cm-1
(as density of a pure substance)
• d’ = thickness of the sample in decimeters
'
'
10
α
10
α
2
2
d
c
M
M
M
• M = molecular weight of the optically active component
• the 10-2
factor is subject to convention and is not always included in
[M]](https://image.slidesharecdn.com/cdi-241010121333-a401d4e1/75/Circular-Dichroism-applications-and-principles-12-2048.jpg)
![Optical rotary dispersion
'
'
10
α
10
α
2
2
d
c
M
M
M
• M = molecular weight of the optically
active component
• n. b. the 10-2
factor is subject to convention
and is not always included in [M]](https://image.slidesharecdn.com/cdi-241010121333-a401d4e1/75/Circular-Dichroism-applications-and-principles-13-2048.jpg)
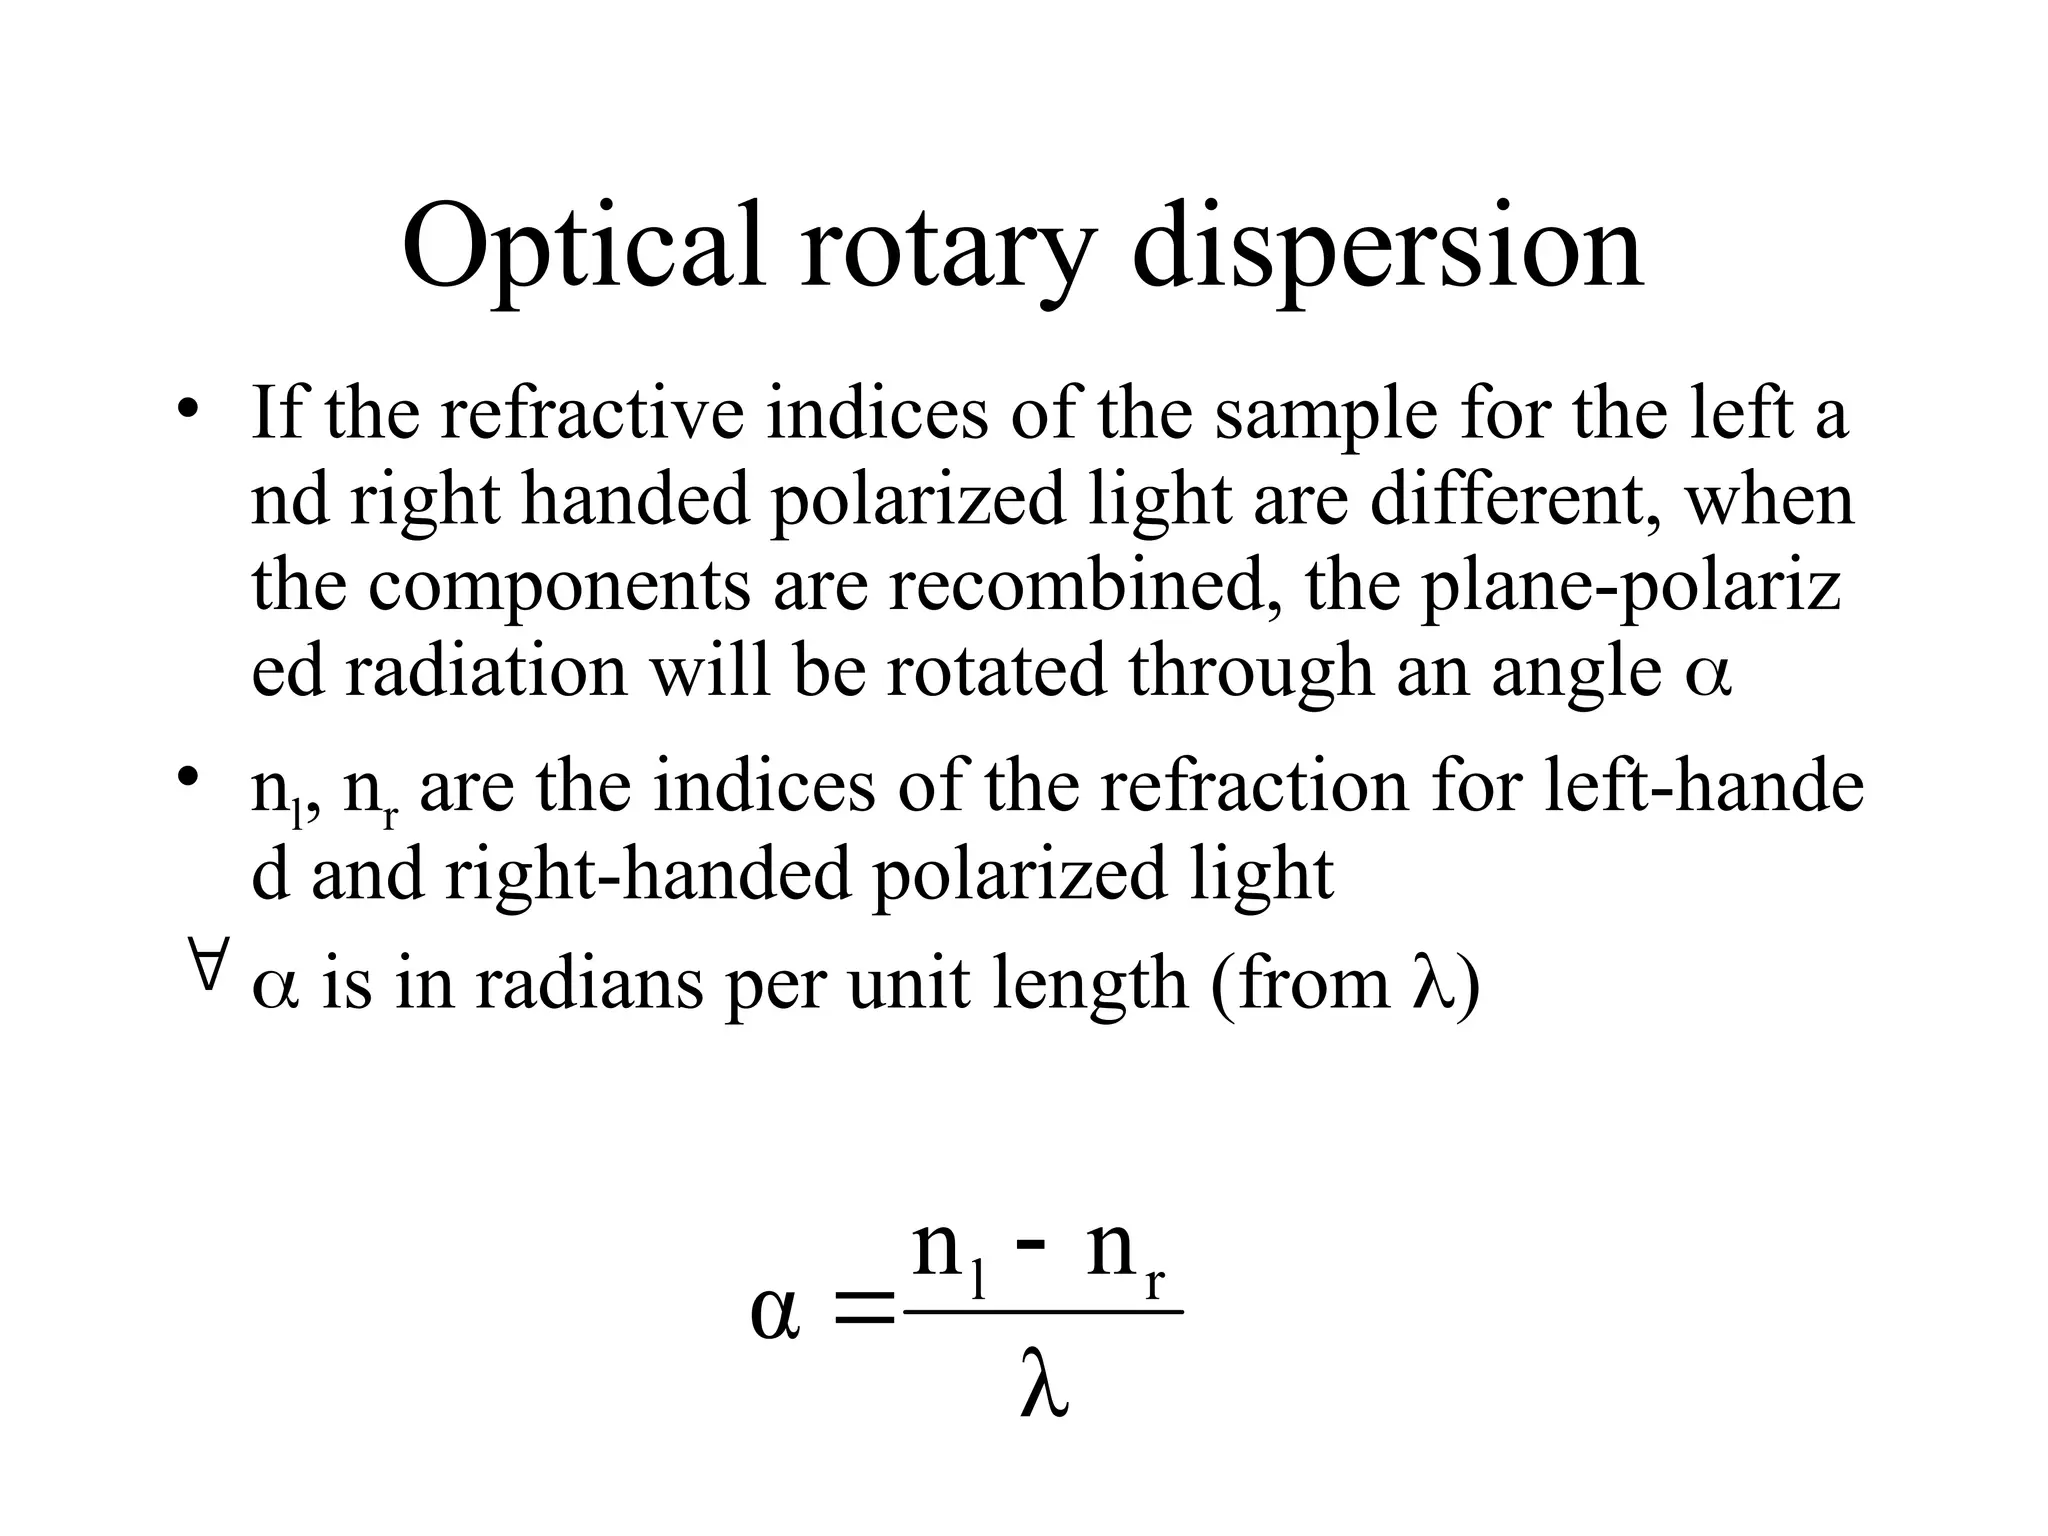
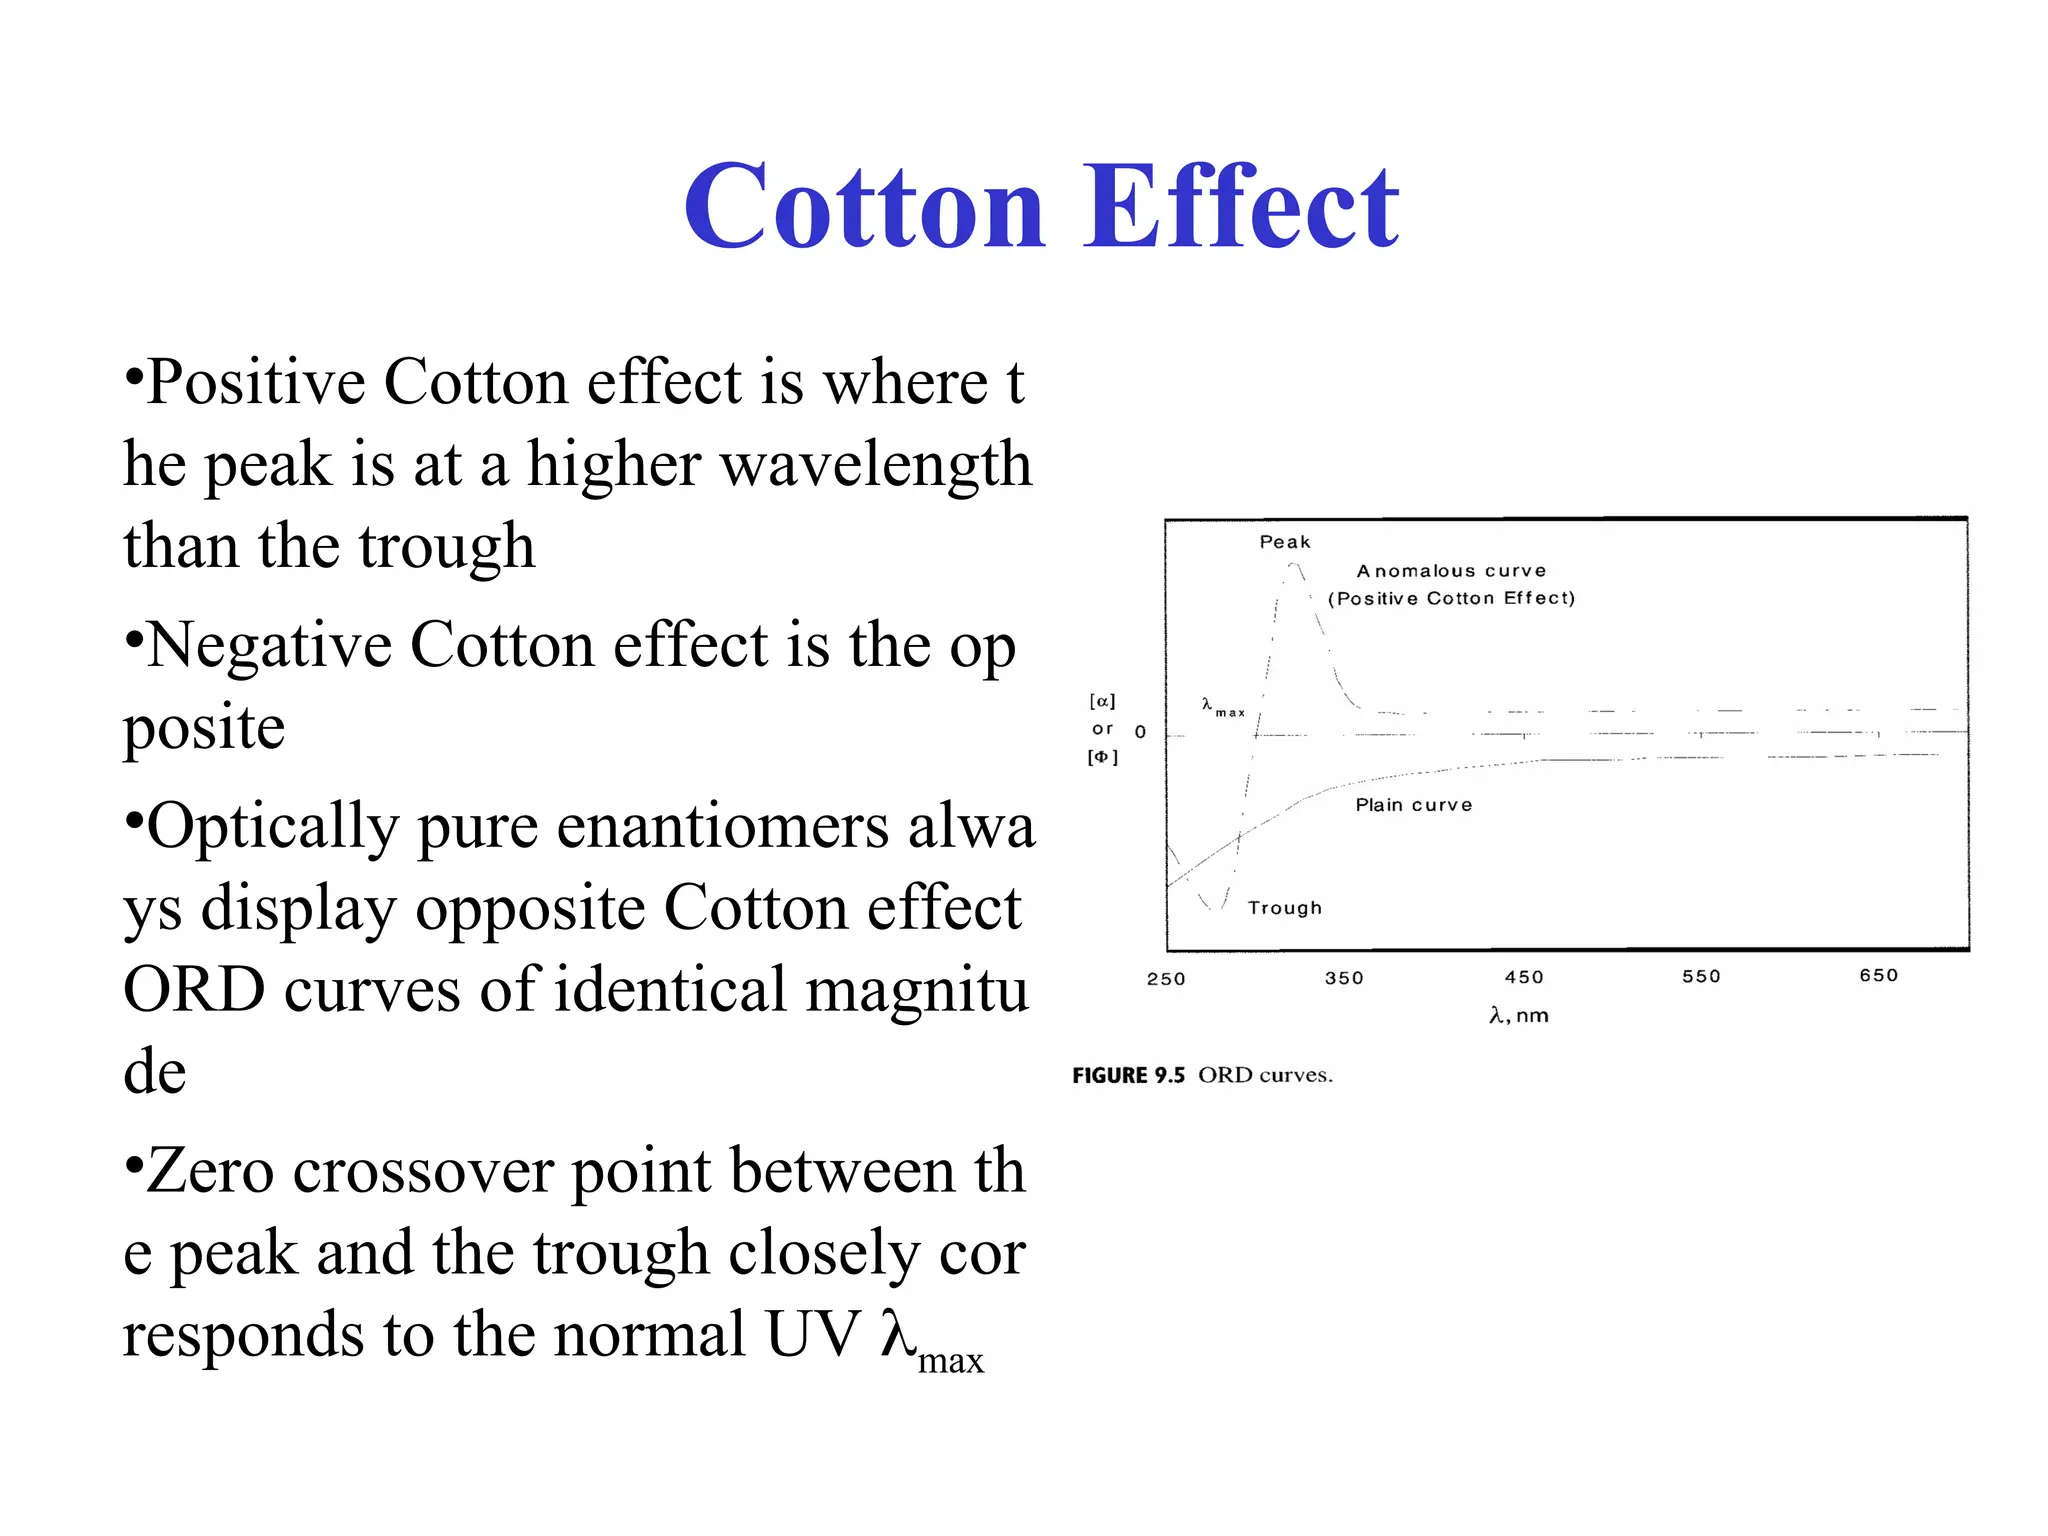
![Optical rotary dispersion
• ORD curve is a plot of molar rotation [] or [M] vs
• Clockwise rotation is plotted positively; counterclockw
ise rotation is plotted negatively
• ORD is based solely on the index of refraction
• So-called plain curve is the ORD for a chiral compoun
d that lacks a chromophore
• Chiral compounds containing a chromophore can give
anomalous, or Cotton effect, curves](https://image.slidesharecdn.com/cdi-241010121333-a401d4e1/75/Circular-Dichroism-applications-and-principles-14-2048.jpg)
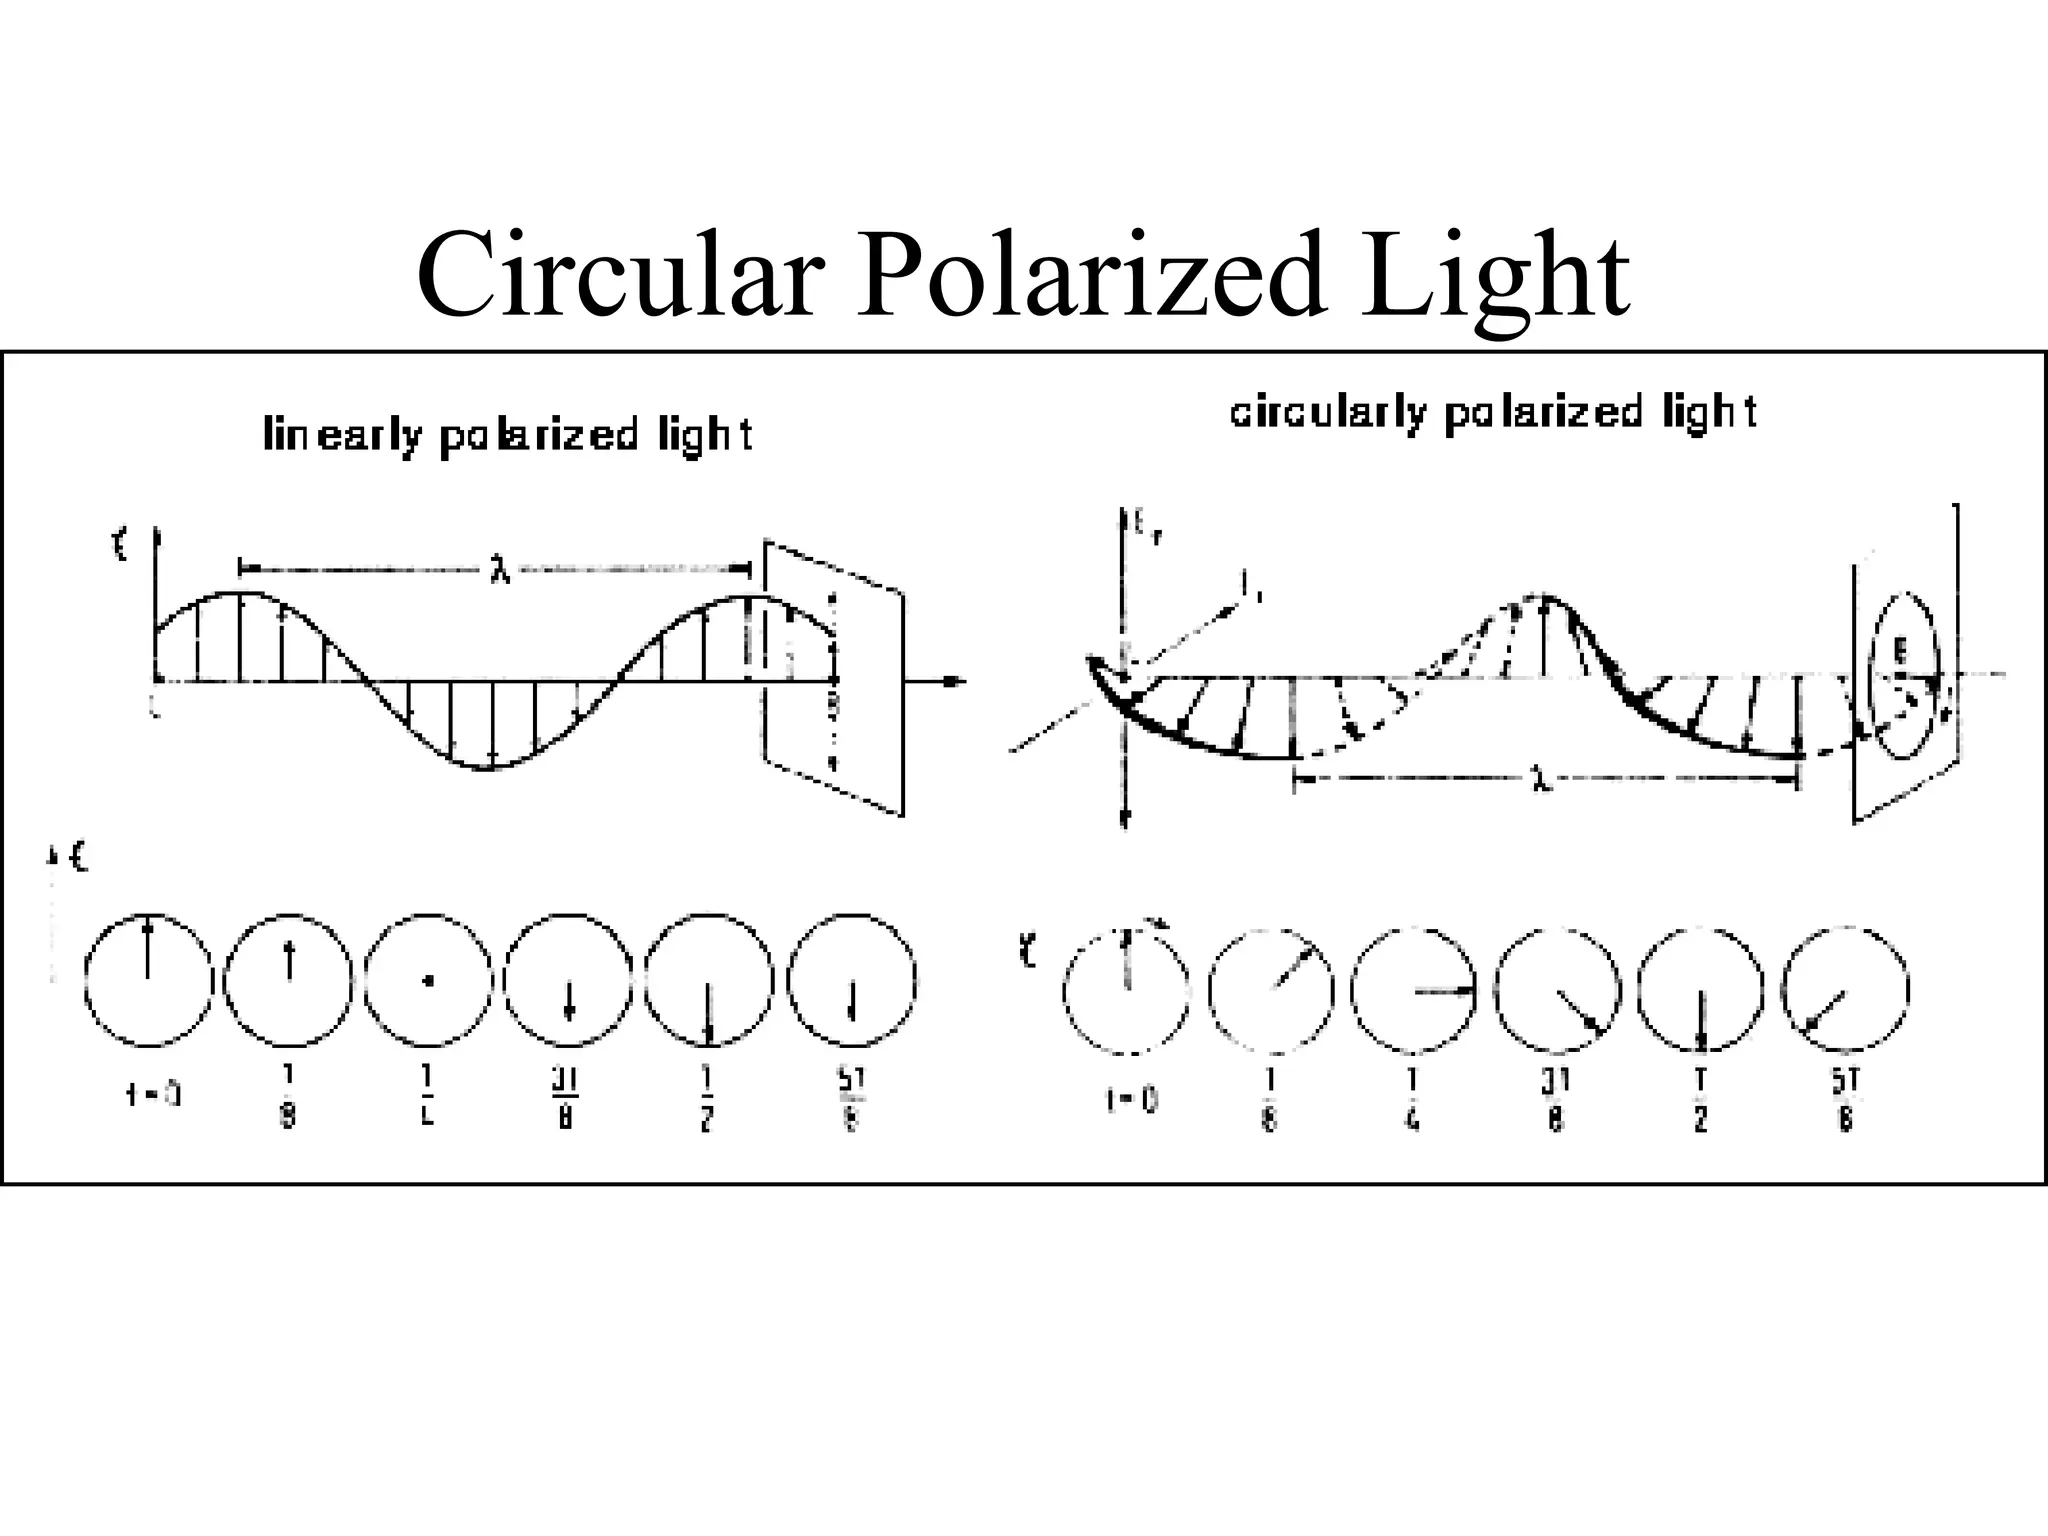
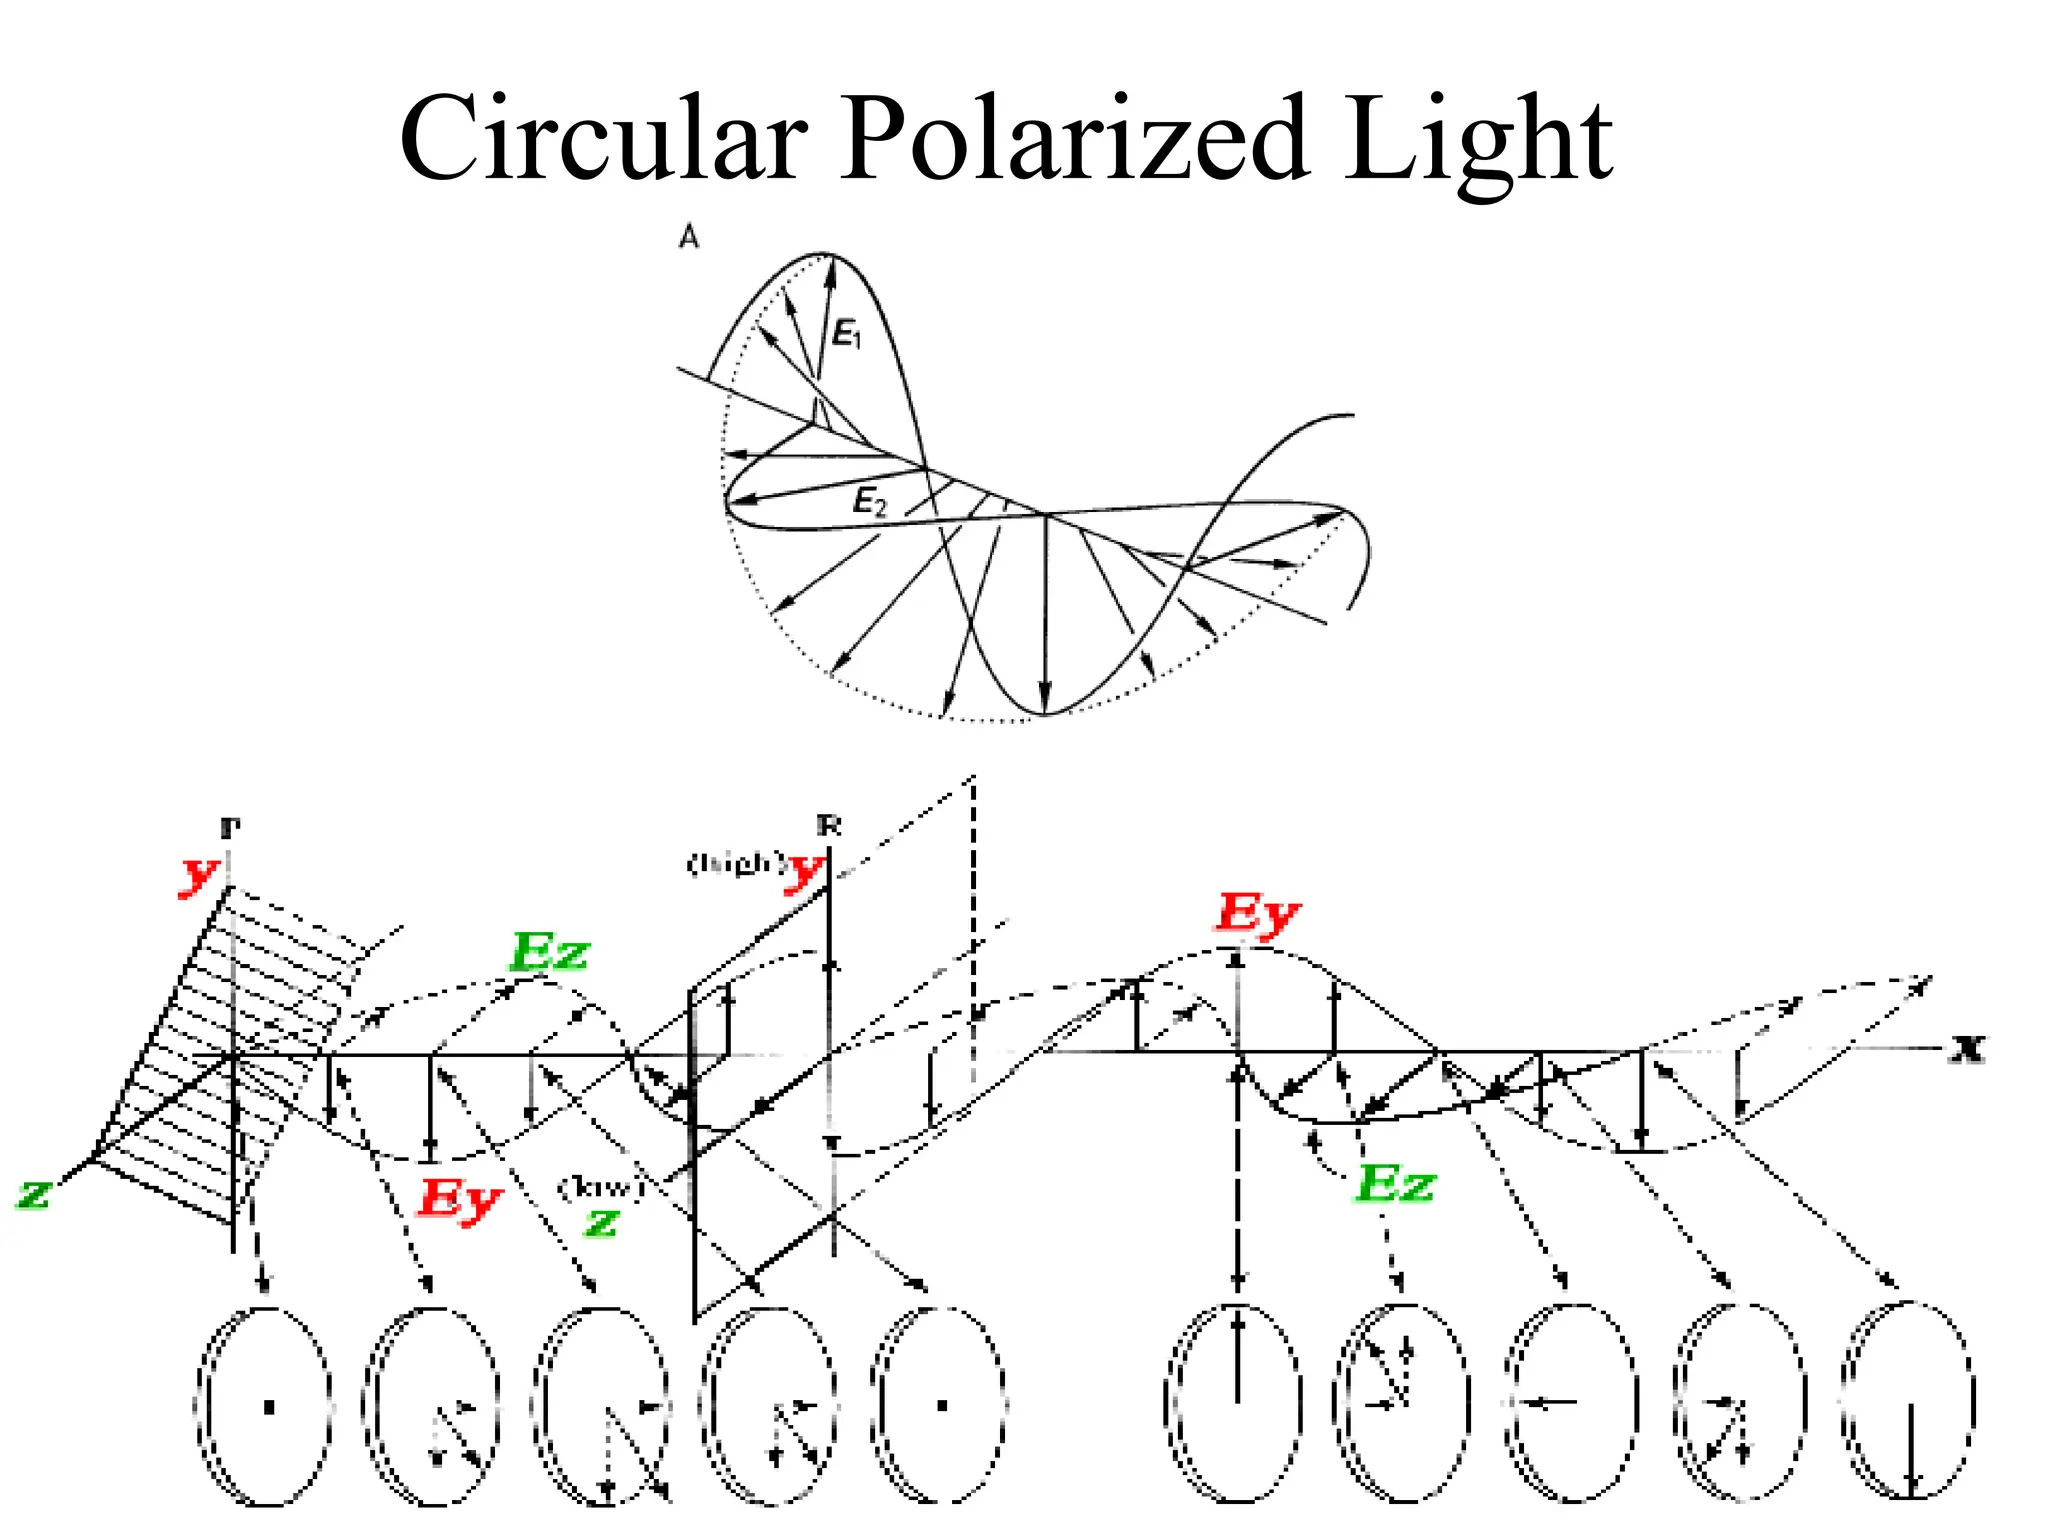
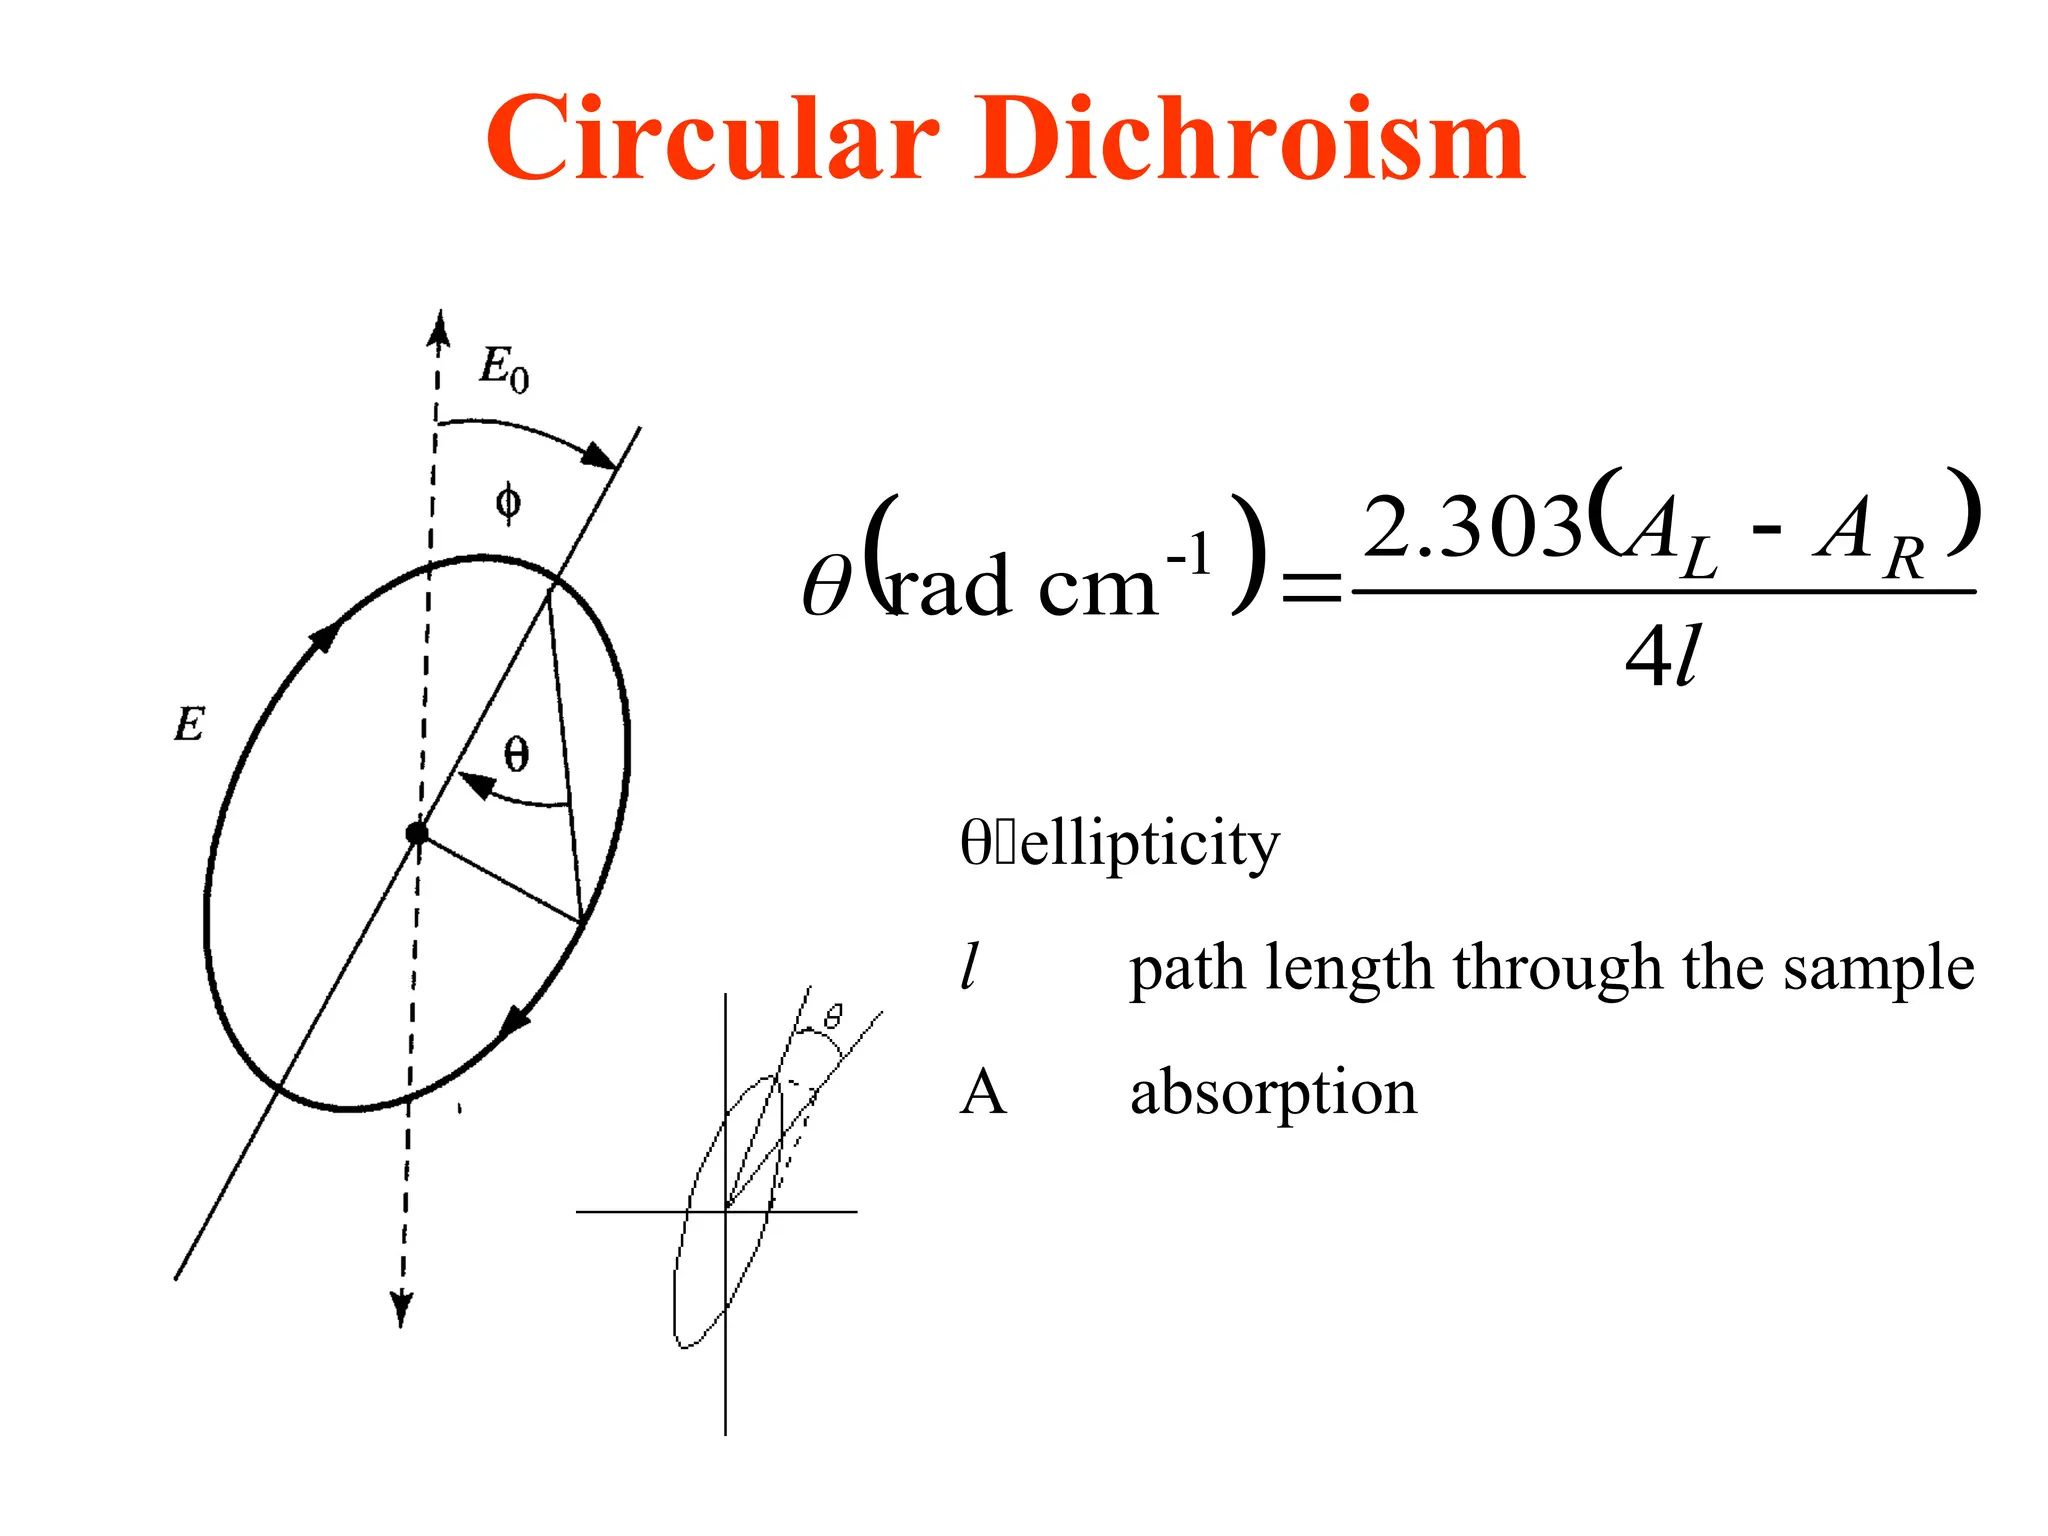
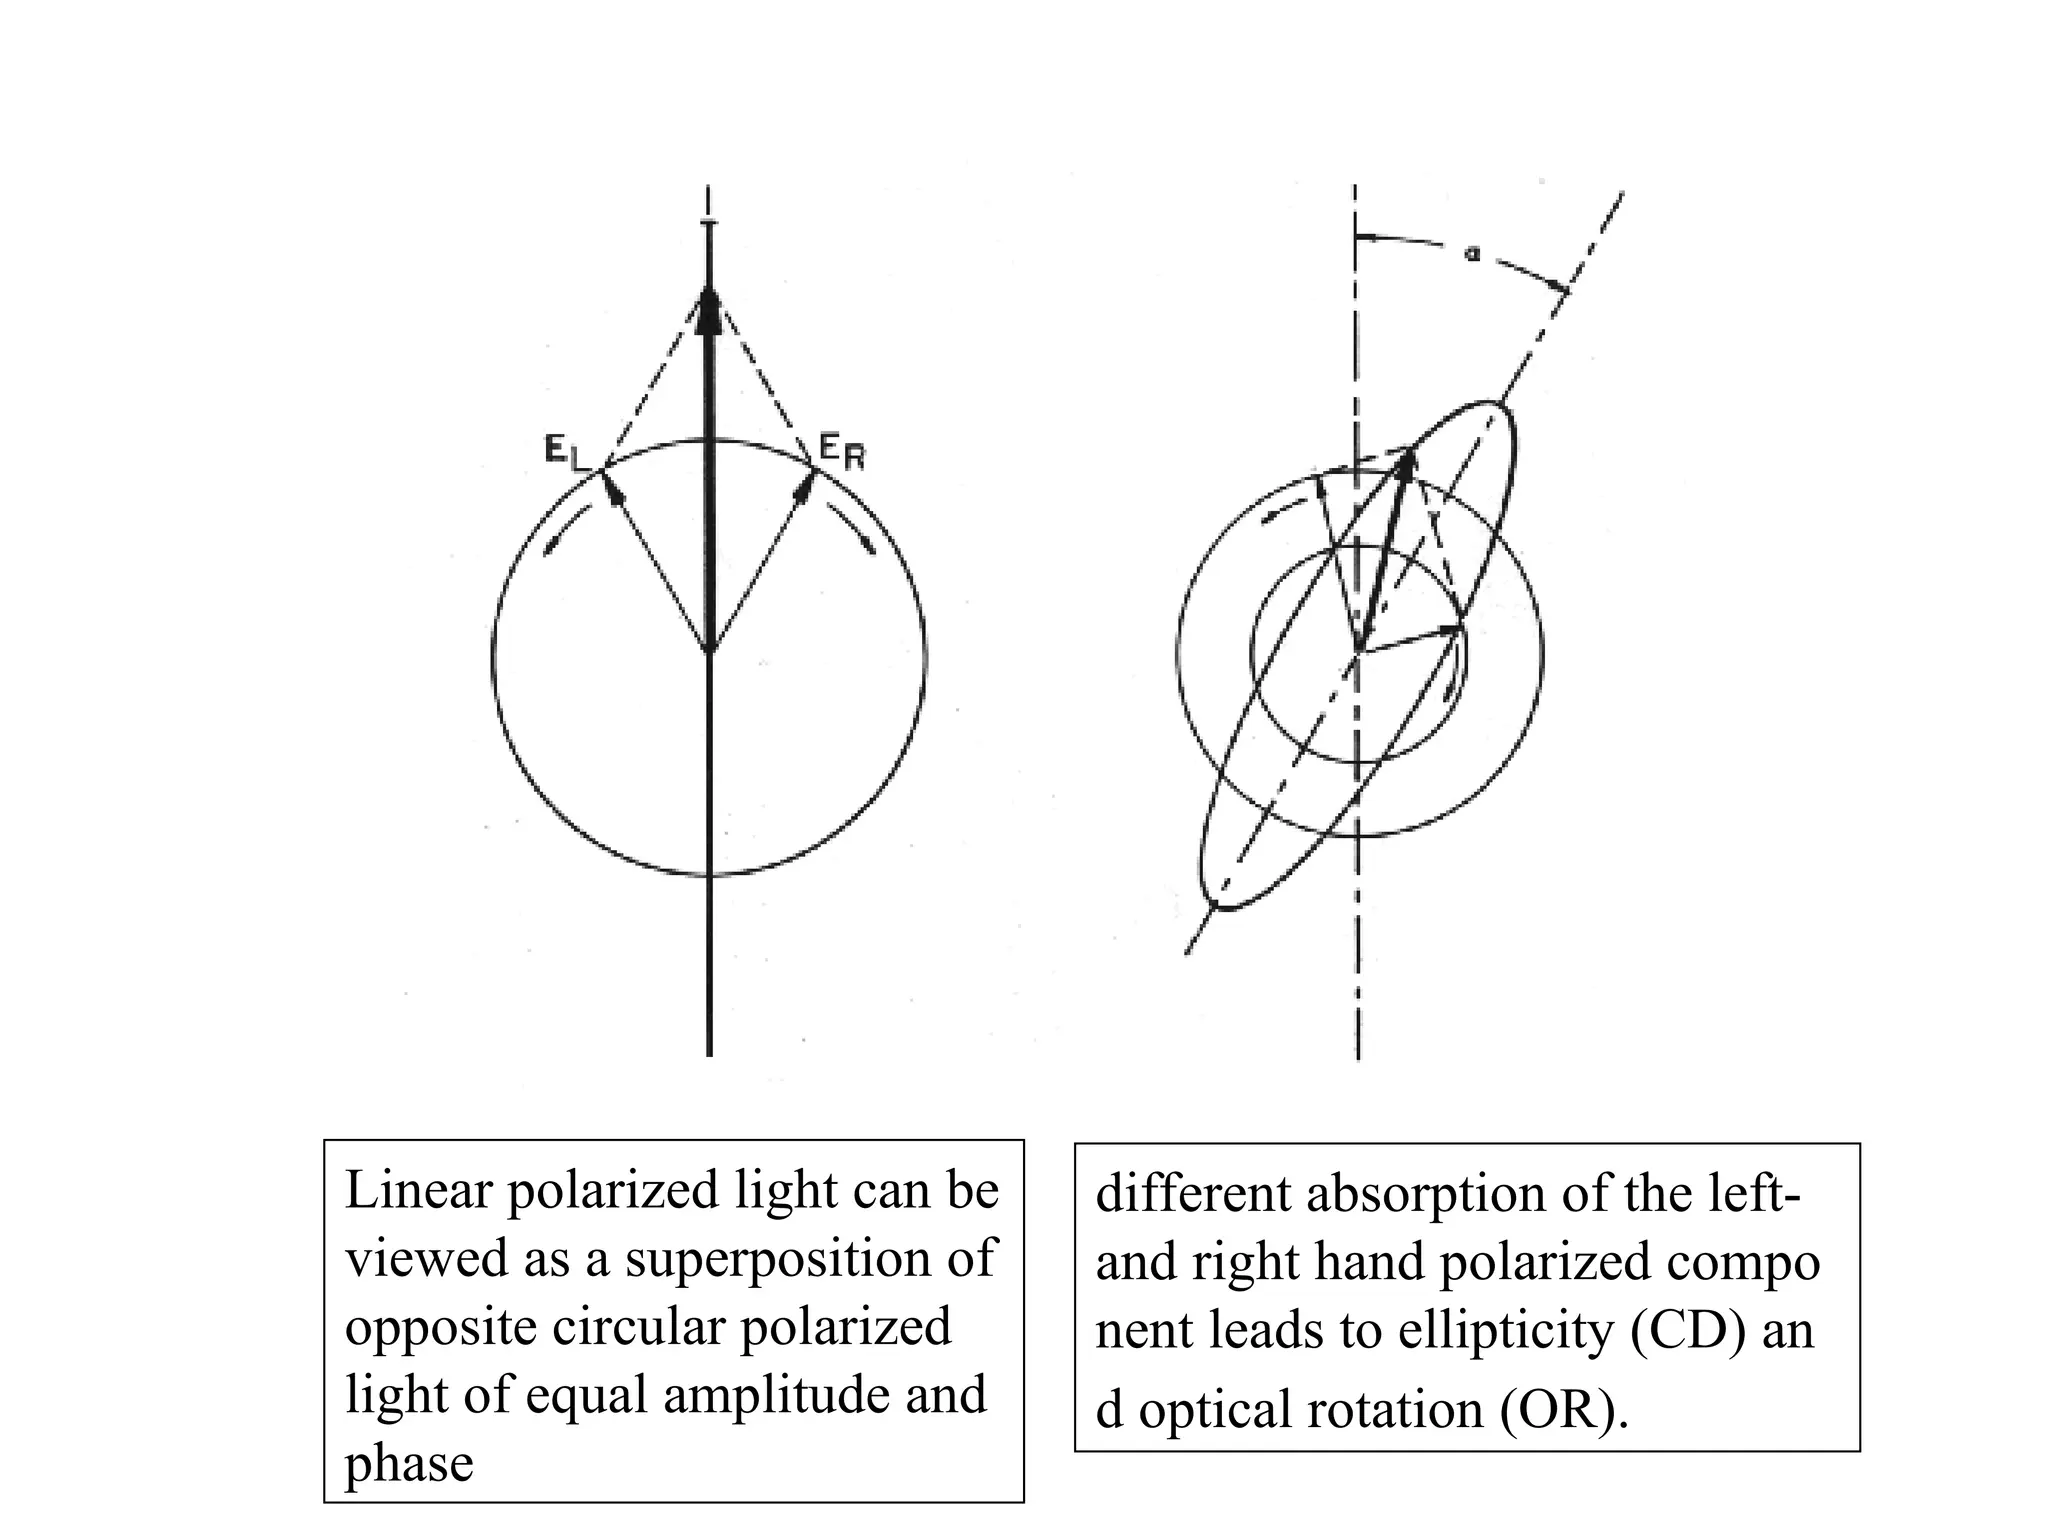
![Circular dichroism
is therefore the angle between the initial plane of polarization and th
e major axis of the ellipse of the resultant transmitted light
• A quantity is defined such that
tan is the ratio of the major and minor axis of the ellipse of the trans
mitted light
’ approximates the ellipticity
• When expressed in degrees, ’ can be converted to a specific ellipticit
y [] or a molar ellipticity []
• CD is usually plotted as []
θ
10
0.3032
ε
ε
10
θ
y
ellipticit
molar
d
c'
y
ellipticit
specific
3
r
l
2
M](https://image.slidesharecdn.com/cdi-241010121333-a401d4e1/75/Circular-Dichroism-applications-and-principles-20-2048.jpg)
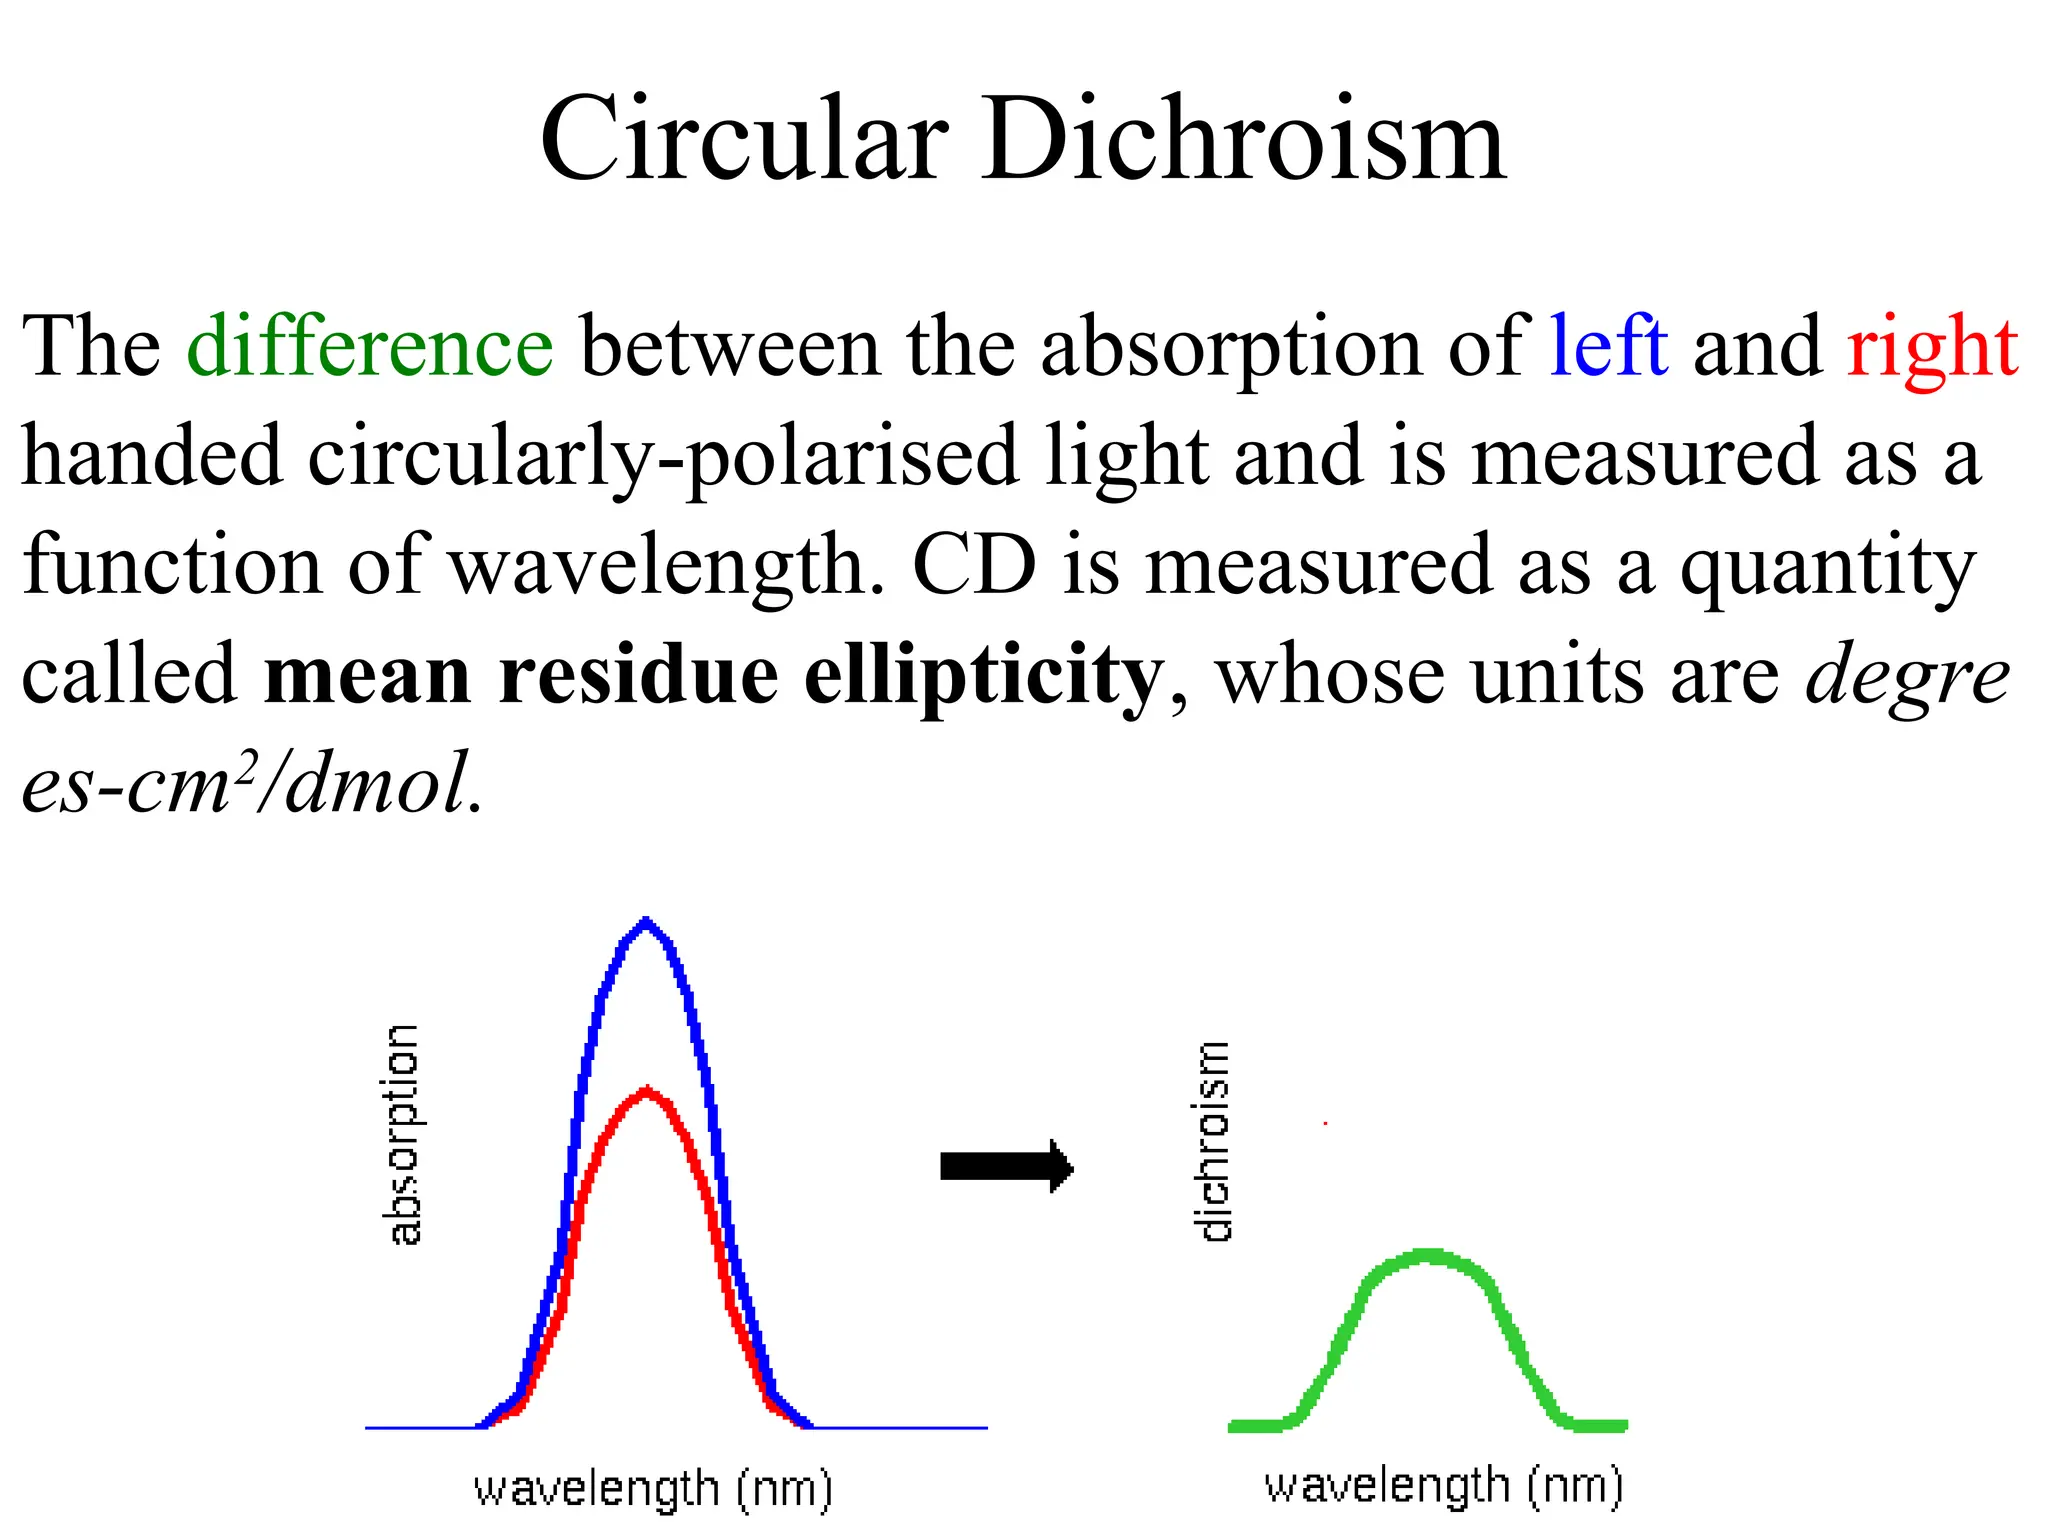
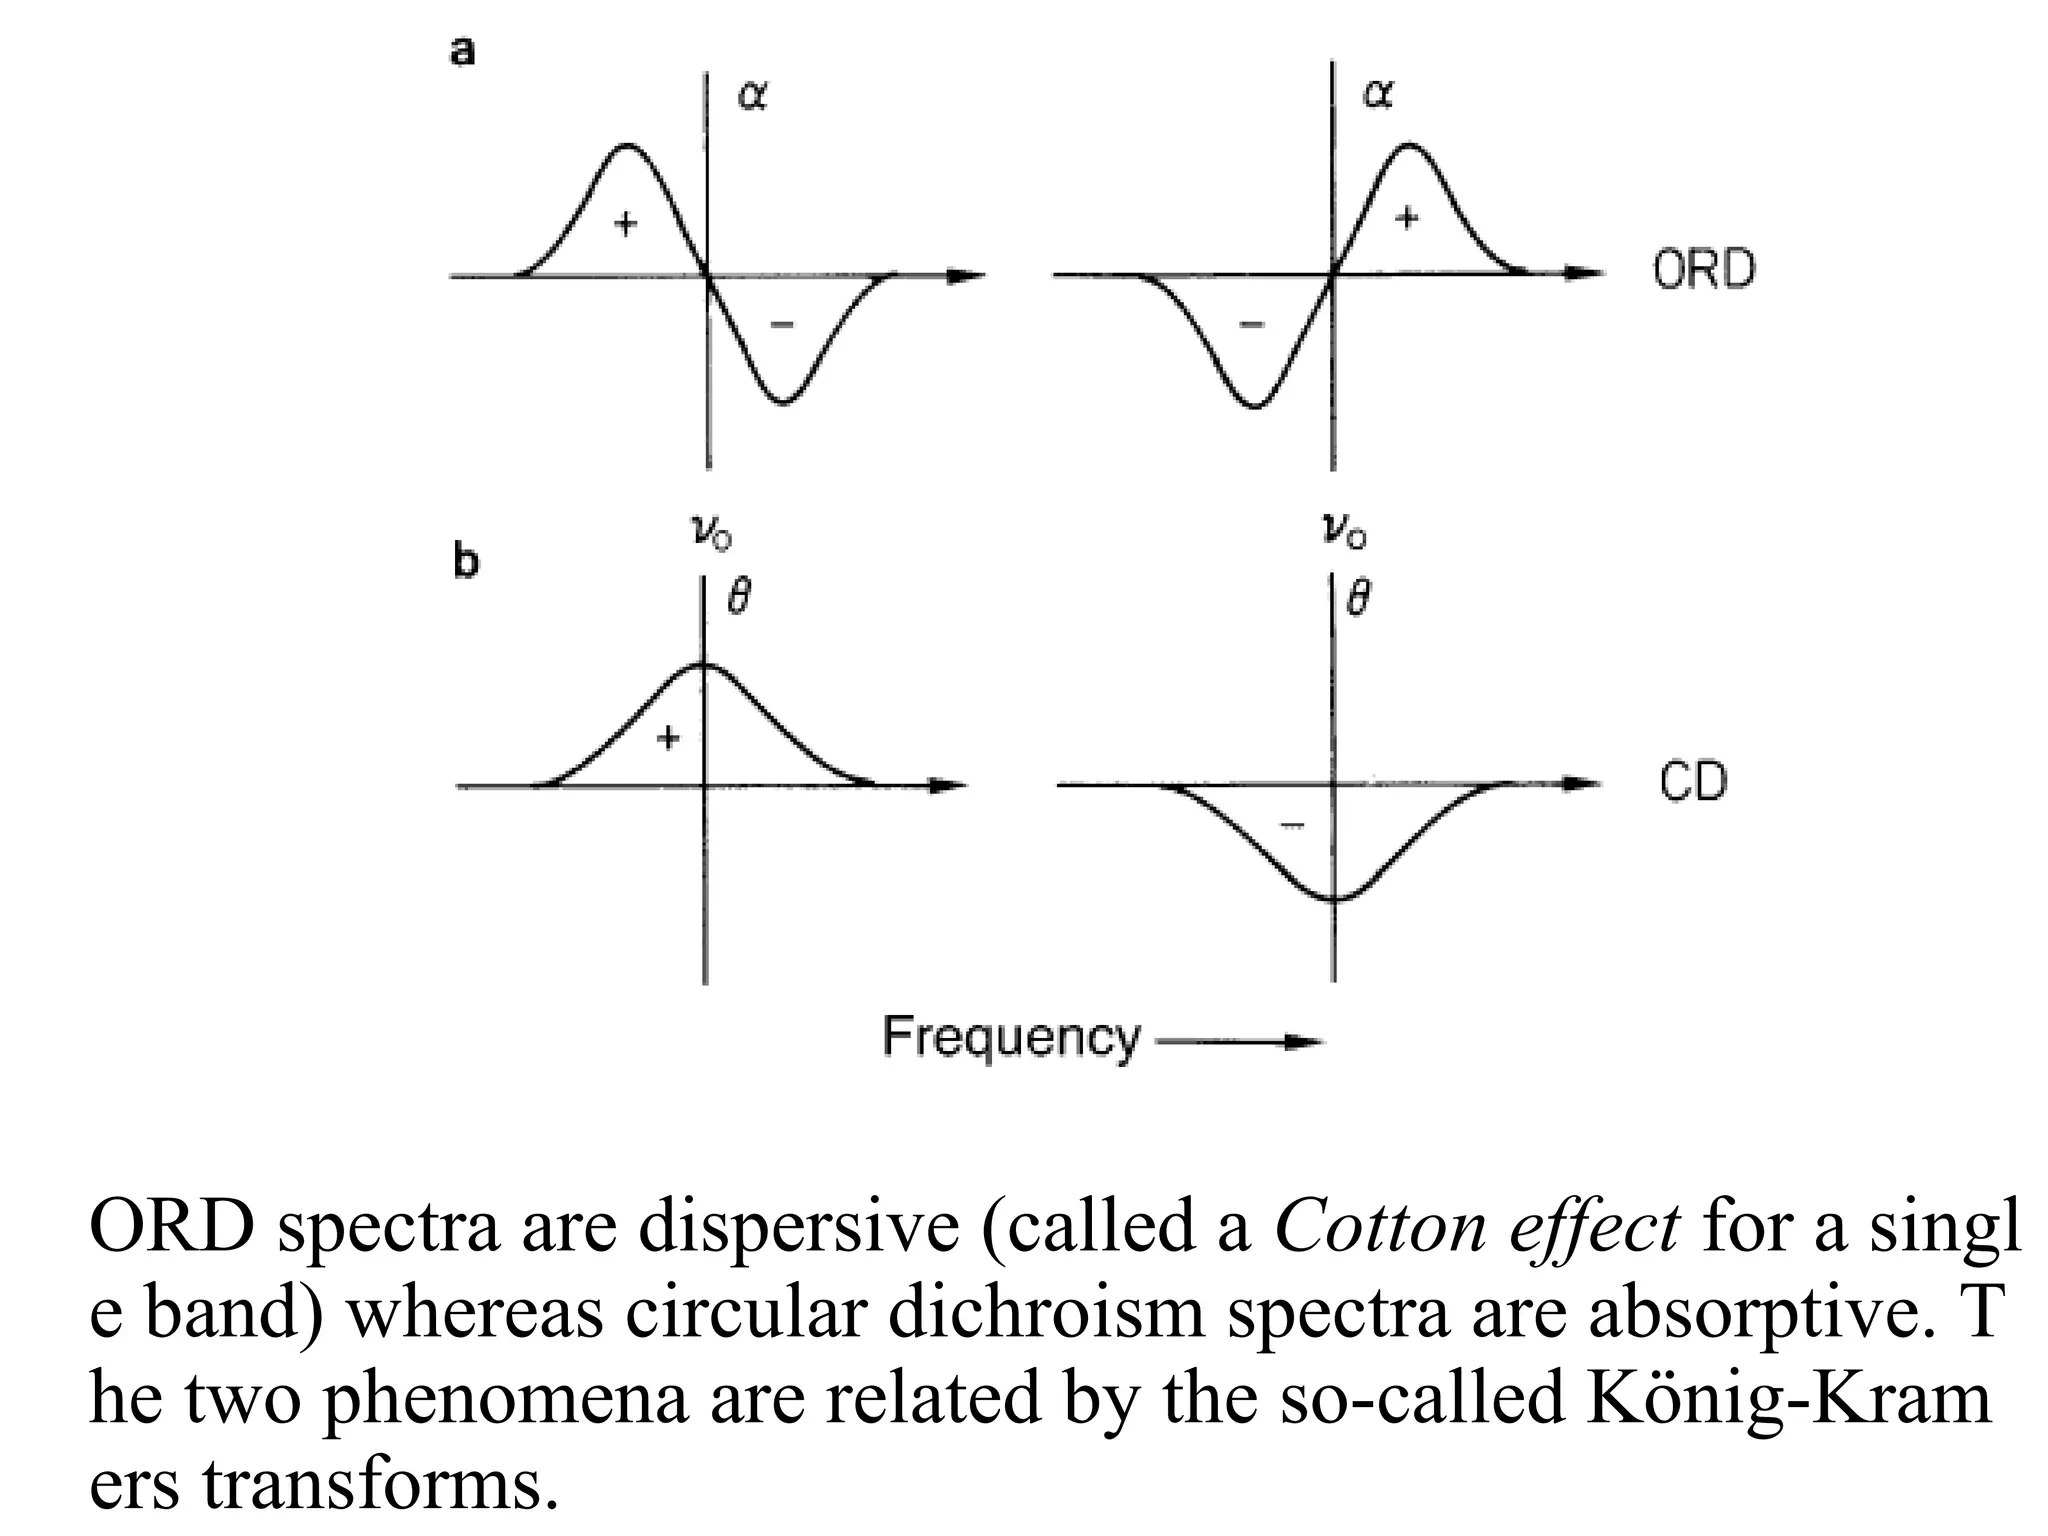
![ORD and CD
• CD plots are Gaussian rather than S-shaped.
• Positive or negative deflections depend on the sign of
or [] and corresponds to the sign of the Cotton effect
• ORD spectra are dispersive (called a Cotton effect for a si
ngle band) whereas circular dichroism spectra are absorpt
ive. The two phenomena are related by the so-called Köni
g-Kramers transforms.
• Maximum of the CD occurs at the absorption max
• Where more than one overlapping Cotton effect, the CD
may be easier to interpret than the ORD with overlapping
S-shaped bands](https://image.slidesharecdn.com/cdi-241010121333-a401d4e1/75/Circular-Dichroism-applications-and-principles-23-2048.jpg)