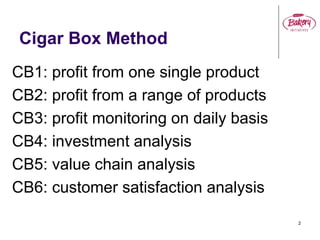
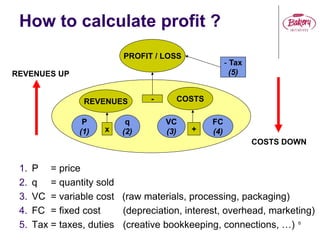
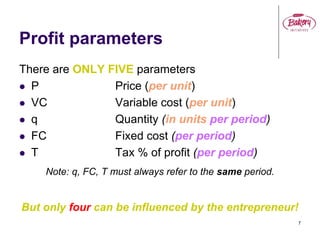
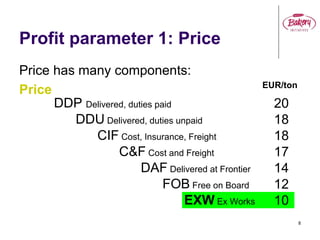
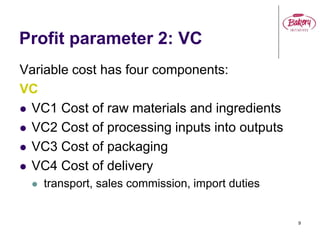
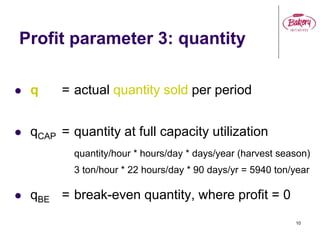
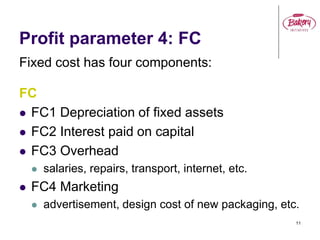
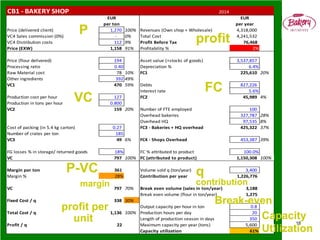
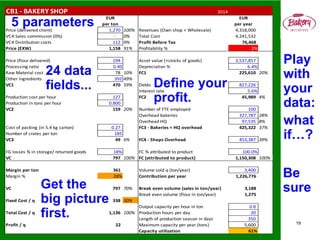
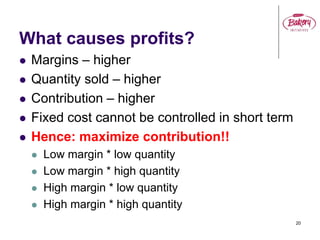
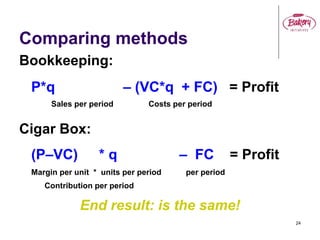
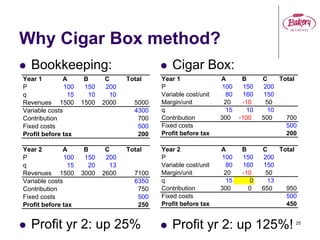
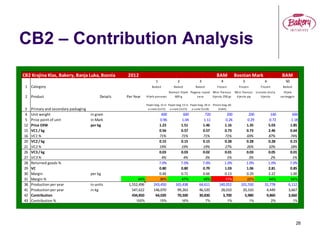
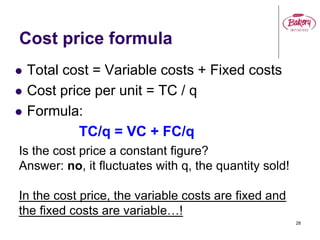
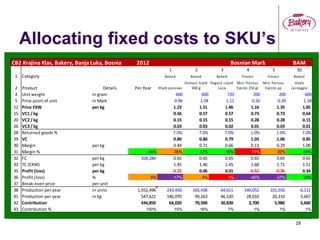
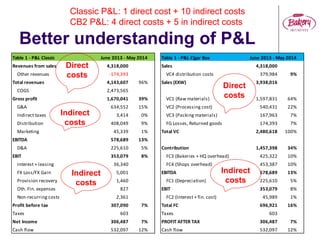
1
How Bakers Can Make
Better Business
Decisions
The Cigar Box® Method
by Olivier van Lieshout
Bakery Initiatives
www.bakery-initiatives.com
2
Cigar Box Method
CB1: profit from one single product
CB2: profit from a range of products
CB3: profit monitoring on daily basis
CB4: investment analysis
CB5: value chain analysis
CB6: customer satisfaction analysis
Cigar Box applications
worldwide > 100 users
3
Bakery jobs
Why are we in bakery
business?
To make profit!
4
5
Part 1
How to bake profit?
1. There are only five profit parameters.
2. Differentiate variable and fixed costs.
3. Define margin and contribution.
4. Two profit formulas
6
How to calculate profit ?
1. P = price
2. q = quantity sold
3. VC = variable cost (raw materials, processing, packaging)
4. FC = fixed cost (depreciation, interest, overhead, marketing)
5. Tax = taxes, duties (creative bookkeeping, connections, …)
PROFIT / LOSS
REVENUES - COSTS
- Tax
(5)
q
(2)
P
(1)
VC
(3)
FC
(4)x +
REVENUES UP
COSTS DOWN
7
Profit parameters
There are ONLY FIVE parameters
 P Price (per unit)
 VC Variable cost (per unit)
 q Quantity (in units per period)
 FC Fixed cost (per period)
 T Tax % of profit (per period)
Note: q, FC, T must always refer to the same period.
But only four can be influenced by the entrepreneur!
8
Profit parameter 1: Price
Price has many components:
Price
DDP Delivered, duties paid 20
DDU Delivered, duties unpaid 18
CIF Cost, Insurance, Freight 18
C&F Cost and Freight 17
DAF Delivered at Frontier 14
FOB Free on Board 12
EXW Ex Works 10
EUR/ton
9
Profit parameter 2: VC
Variable cost has four components:
VC
 VC1 Cost of raw materials and ingredients
 VC2 Cost of processing inputs into outputs
 VC3 Cost of packaging
 VC4 Cost of delivery
 transport, sales commission, import duties
10
Profit parameter 3: quantity
 q = actual quantity sold per period
 qCAP = quantity at full capacity utilization
quantity/hour * hours/day * days/year (harvest season)
3 ton/hour * 22 hours/day * 90 days/yr = 5940 ton/year
 qBE = break-even quantity, where profit = 0
11
Profit parameter 4: FC
Fixed cost has four components:
FC
 FC1 Depreciation of fixed assets
 FC2 Interest paid on capital
 FC3 Overhead
 salaries, repairs, transport, internet, etc.
 FC4 Marketing
 advertisement, design cost of new packaging, etc.
Profit parameter 5: Tax
 This Tax refers only to profit tax
 Other taxes are either VC or FC
 Tax is only paid when there is a profit
 Conclusion:
Profit tax does not cause losses…
12
What causes losses?
 P – too low
 VC – too high
 q – too low
 FC – too high
13
 Which parameter is the most difficult one to
predict by management?
 Answer: q – the quantity sold
14
Recognize costs - exercise
1. Ingredients
2. Labels
3. Bank charges
4. Machine repair
5. Machine maintenance
6. Raw material transport
7. Depreciation
8. Social tax
9. Diesel for the boiler
10. Electricity in the factory
11. Electricity in the office
12. Temporary labor
13. Management salary
14. Detergents and gloves
15. Billboard rental
16. Carton boxes
Are the following Variable or Fixed costs?
15
Margin and contribution
What is MARGIN?
 Margin = earnings per unit
 Margin = price – variable cost per unit
 Margin = P – VC
What is CONTRIBUTION?
 Contribution = earnings per period
 Contribution = margin per unit * units sold
 Contribution = (P – VC) * q
16
Margin %
 Margin % indicates risk.
 Usual risk levels in bakery are:
Margin % Level Comment
<15% Very risky
Only acceptable when the
production process parameters
and all prices are fully under
control.
15-25% Risky
Only acceptable if production
and price fluctuations are within
5-10% range.
25-35% Normal
35-45% Robust
45-70% Very robust
>70% Unlikely Check your calculations again!
17
CB1
An overview:
Profit calculation for one product
for one year
CB1 - BAKERY SHOP 2014
EUR EUR
per ton per year
Price (delivered client) 1,270 100% Revenues (Own shop + Wholesale) 4,318,000
VC4 Sales commission (0%) - 0% Total Cost 4,241,532
VC4 Distribution costs 112 9% Profit Before Tax 76,468
Price (EXW) 1,158 91% Profitability % 2%
Price (flour delivered) 194 Asset value (+stocks of goods) 3,537,857
Processing ratio 0.40 Depreciation % 6.4%
Raw Material cost 78 10% FC1 225,610 20%
Other ingredients 392 49%
VC1 470 59% Debts 827,226
Interest rate 5.6%
Production cost per hour 127 FC2 45,989 4%
Production in tons per hour 0.800
VC2 159 20% Number of FTE employed 100
Overhead bakeries 327,787 28%
Overhead HQ 97,535 8%
Cost of packing (in 5.4 kg carton) 0.27 FC3 - Bakeries + HQ overhead 425,322 37%
Number of crates per ton 185
VC3 49 6% FC4 - Shops Overhead 453,387 39%
FG losses % in storage/ returned goods 18% FC % attributed to product 100.0%
VC 797 100% FC (attributed to product) 1,150,308 100%
Margin per ton 361 Volume sold q (ton/year) 3,400
Margin % 28% Contribution per year 1,226,776
VC 797 70% Break even volume (sales in ton/year) 3,188
Break even volume (flour in ton/year) 1,275
Fixed Cost / q 338 30%
Output capacity per hour in ton 0.8
Total Cost / q 1,136 100% Production hours per day 20
Length of production season in days 350
Profit / q 22 Maximum capacity per year (tons) 5,600
Capacity utilization 61%
18
P
VC
FC
q
contribution
profit
margin
profit per
unit
Break-even
Capacity
Utilization
P-VC
CB1 - BAKERY SHOP 2014
EUR EUR
per ton per year
Price (delivered client) 1,270 100% Revenues (Own shop + Wholesale) 4,318,000
VC4 Sales commission (0%) - 0% Total Cost 4,241,532
VC4 Distribution costs 112 9% Profit Before Tax 76,468
Price (EXW) 1,158 91% Profitability % 2%
Price (flour delivered) 194 Asset value (+stocks of goods) 3,537,857
Processing ratio 0.40 Depreciation % 6.4%
Raw Material cost 78 10% FC1 225,610 20%
Other ingredients 392 49%
VC1 470 59% Debts 827,226
Interest rate 5.6%
Production cost per hour 127 FC2 45,989 4%
Production in tons per hour 0.800
VC2 159 20% Number of FTE employed 100
Overhead bakeries 327,787 28%
Overhead HQ 97,535 8%
Cost of packing (in 5.4 kg carton) 0.27 FC3 - Bakeries + HQ overhead 425,322 37%
Number of crates per ton 185
VC3 49 6% FC4 - Shops Overhead 453,387 39%
FG losses % in storage/ returned goods 18% FC % attributed to product 100.0%
VC 797 100% FC (attributed to product) 1,150,308 100%
Margin per ton 361 Volume sold q (ton/year) 3,400
Margin % 28% Contribution per year 1,226,776
VC 797 70% Break even volume (sales in ton/year) 3,188
Break even volume (flour in ton/year) 1,275
Fixed Cost / q 338 30%
Output capacity per hour in ton 0.8
Total Cost / q 1,136 100% Production hours per day 20
Length of production season in days 350
Profit / q 22 Maximum capacity per year (tons) 5,600
Capacity utilization 61%
19
24 data
fields... Define your
profit.
Get the
big picture
first.
Play
with
your
data:
what
if…?
Be
sure
5 parameters
What causes profits?
 Margins – higher
 Quantity sold – higher
 Contribution – higher
 Fixed cost cannot be controlled in short term
 Hence: maximize contribution!!
 Low margin * low quantity
 Low margin * high quantity
 High margin * low quantity
 High margin * high quantity
20
21
Part 2
Why use the Cigar Box Method?
Argument 1:
Bookkeeping is incomplete and leads
to wrong business decisions
22
Profit formula 1
Bookkeeper’s method
 Profit = Revenues – Total costs
 Formula:
 Profit = P*q – (VC*q + FC)
“Total revenue, minus total cost is profit”
Which documents are needed?
23
Profit formula 2
Cigar Box method
 Profit = Contribution – Fixed costs
 Formula:
 Profit = (P – VC) * q – FC
“Contribution minus fixed cost is profit”
Which documents are needed?
24
Comparing methods
Bookkeeping:
P*q – (VC*q + FC) = Profit
Sales per period Costs per period
Cigar Box:
(P–VC) * q – FC = Profit
Margin per unit * units per period per period
Contribution per period
End result: is the same!
25
Why Cigar Box method?
 Bookkeeping:  Cigar Box:
Year 1 A B C Total
P 100 150 200
Variable cost/unit 80 160 150
Margin/unit 20 -10 50
q 15 10 10
Contribution 300 -100 500 700
Fixed costs 500
Profit before tax 200
 Profit yr 2: up 25%  Profit yr 2: up 125%!
Year 2 A B C Total
P 100 150 200
Variable cost/unit 80 160 150
Margin/unit 20 -10 50
q 15 0 13
Contribution 300 0 650 950
Fixed costs 500
Profit before tax 450
Year 1 A B C Total
P 100 150 200
q 15 10 10
Revenues 1500 1500 2000 5000
Variable costs 4300
Contribution 700
Fixed costs 500
Profit before tax 200
Year 2 A B C Total
P 100 150 200
q 15 20 13
Revenues 1500 3000 2600 7100
Variable costs 6350
Contribution 750
Fixed costs 500
Profit before tax 250
CB2 – Contribution Analysis
CB2 Krajina Klas, Bakery, Banja Luka, Bosnia 2012 BAM Bosnian Mark BAM
1 2 3 4 5 6 50
1 Category Baked Baked Baked Frozen Frozen Frozen Baked
2 Product Details Per Year Hljeb posavac
Domaci hljeb
600 g
Pogaca ispod
saca
Mini francuz
tijesto 250 gr
Mini francuz
tijesto pp
Lisnato virsla
tijesto
Hljeb
casteggio
3 Primary and secondary packaging
Paper bag, 15 in
a crate (1x15)
Paper bag, 15 in
a crate (1x15)
Paper bag, 18 in
a crate (1x18)
Plastic bag, 60
(1x60)
4 Unit weight in gram 600 600 720 200 200 140 600
5 Price point of unit in Mark 0.96 1.04 1.11 0.26 0.29 0.72 1.18
12 Price EXW per kg 1.23 1.51 1.46 1.16 1.35 5.03 1.85
15 VC1 / kg 0.56 0.57 0.57 0.73 0.73 2.46 0.64
16 VC1 % 71% 71% 71% 71% 69% 87% 74%
20 VC2 / kg 0.15 0.15 0.15 0.28 0.28 0.28 0.15
21 VC2 % 19% 19% 19% 27% 26% 10% 18%
26 VC3 / kg 0.03 0.03 0.02 0.01 0.03 0.05 0.01
27 VC3 % 4% 4% 3% 1% 3% 2% 1%
28 Returned goods % 7.0% 7.0% 7.0% 1.0% 1.0% 1.0% 7.0%
29 VC 0.80 0.80 0.79 1.03 1.06 2.81 0.85
30 Margin per kg 0.44 0.71 0.66 0.13 0.29 2.22 1.00
31 Margin % 44% 36% 47% 45% 11% 22% 44% 54%
38 Production per year in units 1,552,496 243,450 165,438 64,611 140,052 101,550 31,778 6,112
41 Production per year in kg 547,622 146,070 99,263 46,520 28,010 20,310 4,449 3,667
42 Contribution 434,850 64,020 70,500 30,830 3,700 5,980 9,860 3,660
43 Contribution % 100% 15% 16% 7% 1% 1% 2% 1%
26
27
Why use the
Cigar Box Method?
Argument 2:
Allocating fixed costs leads to
wrong business decisions.
28
Cost price formula
 Total cost = Variable costs + Fixed costs
 Cost price per unit = TC / q
 Formula:
TC/q = VC + FC/q
Is the cost price a constant figure?
Answer: no, it fluctuates with q, the quantity sold!
In the cost price, the variable costs are fixed and
the fixed costs are variable…!
Allocating fixed costs to SKU’s
29
CB2 Krajina Klas, Bakery, Banja Luka, Bosnia 2012 Bosnian Mark BAM
1 2 3 4 5 50
1 Category Baked Baked Baked Frozen Frozen Baked
2 Product Details Per Year Hljeb posavac
Domaci hljeb
600 g
Pogaca ispod
saca
Mini francuz
tijesto 250 gr
Mini francuz
tijesto pp
Hljeb
casteggio
4 Unit weight in gram 600 600 720 200 200 600
5 Price point of unit in Mark 0.96 1.04 1.11 0.26 0.29 1.18
12 Price EXW per kg 1.23 1.51 1.46 1.16 1.35 1.85
15 VC1 / kg 0.56 0.57 0.57 0.73 0.73 0.64
20 VC2 / kg 0.15 0.15 0.15 0.28 0.28 0.15
26 VC3 / kg 0.03 0.03 0.02 0.01 0.03 0.01
28 Returned goods % 7.0% 7.0% 7.0% 1.0% 1.0% 7.0%
29 VC 0.80 0.80 0.79 1.03 1.06 0.85
30 Margin per kg 0.44 0.71 0.66 0.13 0.29 1.00
31 Margin % 44% 36% 47% 45% 11% 22% 54%
32 FC per kg 358,284 0.65 0.65 0.65 0.65 0.65 0.65
33 TC (EXW) per kg 1.45 1.46 1.45 1.68 1.71 1.51
35 Profit (loss) per kg -0.22 0.06 0.01 -0.52 -0.36 0.34
36 Profit (loss) % 8% -17% 4% 1% -45% -27% 19%
37 Break-even price per unit
38 Production per year in units 1,552,496 243,450 165,438 64,611 140,052 101,550 6,112
41 Production per year in kg 547,622 146,070 99,263 46,520 28,010 20,310 3,667
42 Contribution 434,850 64,020 70,500 30,830 3,700 5,980 3,660
43 Contribution % 100% 15% 16% 7% 1% 1% 1%
30
Why use the
Cigar Box Method?
Argument 3:
Classic P&L is not actionable
CB2 P&L helps with business
decisions.
Table 1 - P&L Cigar Box June 2013 - May 2014
Sales 4,318,000
VC4 distribution costs 379,984 9%
Sales (EXW) 3,938,016
VC1 (Raw materials) 1,597,831 64%
VC2 (Processing cost) 540,431 22%
VC3 (Packing materials) 167,963 7%
FG Losses, Returned goods 174,393 7%
Total VC 2,480,618 100%
Contribution 1,457,398 34%
FC3 (Bakeries + HQ overhead) 425,322 10%
FC4 (Shops overhead) 453,387 10%
EBITDA 578,689 13%
FC1 (Depreciation) 225,610 5%
EBIT 353,079 8%
FC2 (Interest + fin. cost) 45,989 1%
Total FC 696,921 16%
Taxes 603
PROFIT AFTER TAX 306,487 7%
Cash flow 532,097 12%
Table 1 - P&L Classic June 2013 - May 2014
Revenues from sales 4,318,000
Other revenues -174,393
Total revenues 4,143,607 96%
COGS 2,473,565
Gross profit 1,670,041 39%
G&A 634,552 15%
Indirect taxes 3,414 0%
Distribution 408,049 9%
Marketing 45,339 1%
EBITDA 578,689 13%
D&A 225,610 5%
EBIT 353,079 8%
Interest + leasing 36,340
FX Loss/FX Gain 5,001
Provision recovery 1,460
Oth. Fin. expenses 827
Non-recurring costs 2,361
Profit before tax 307,090 7%
Taxes 603
Net Income 306,487 7%
Cash flow 532,097 12%
Better understanding of P&L
Direct
costs
Indirect
costs
Indirect
costs
Direct
costs
Indirect
costs
Classic P&L: 1 direct cost + 10 indirect costs
CB2 P&L: 4 direct costs + 5 in indirect costs
32
Why use the
Cigar Box Method?
Argument 4:
Daily KPI updates,
not analysis after one month.
CB3 – Operational monitoring
 Keep track of costs & KPI on a daily basis
 Benchmark costs & KPI’s
 Take action on deviations
 Continuous
improvement
33
How to apply the Cigar Box?
 Stand alone in Excel
 CB2: Adapt existing bookkeeping system
 Add CB labels to chart of accounts
 Add CB labels to articles lists
 Design CB2 periodic report
 CB3: Adapt existing ERP system
 Add actual VC1, VC2, VC3 to production orders
 Add non-financial KPI’s (kWh, liters, machine hours)
 Design CB3 daily report
34
Who can apply the Cigar Box?
 Your local software supplier
 In consultation with a certified Cigar Box
specialist.
 Quite easy really…. 
35
36
How Can Bakers Make
Better Business
Decisions?
Use the Cigar Box® Method
Thank you for your attention

Cigar Box Method Presentation

  • 1.
    1 How Bakers CanMake Better Business Decisions The Cigar Box® Method by Olivier van Lieshout Bakery Initiatives www.bakery-initiatives.com
  • 2.
    2 Cigar Box Method CB1:profit from one single product CB2: profit from a range of products CB3: profit monitoring on daily basis CB4: investment analysis CB5: value chain analysis CB6: customer satisfaction analysis
  • 3.
    Cigar Box applications worldwide> 100 users 3 Bakery jobs
  • 4.
    Why are wein bakery business? To make profit! 4
  • 5.
    5 Part 1 How tobake profit? 1. There are only five profit parameters. 2. Differentiate variable and fixed costs. 3. Define margin and contribution. 4. Two profit formulas
  • 6.
    6 How to calculateprofit ? 1. P = price 2. q = quantity sold 3. VC = variable cost (raw materials, processing, packaging) 4. FC = fixed cost (depreciation, interest, overhead, marketing) 5. Tax = taxes, duties (creative bookkeeping, connections, …) PROFIT / LOSS REVENUES - COSTS - Tax (5) q (2) P (1) VC (3) FC (4)x + REVENUES UP COSTS DOWN
  • 7.
    7 Profit parameters There areONLY FIVE parameters  P Price (per unit)  VC Variable cost (per unit)  q Quantity (in units per period)  FC Fixed cost (per period)  T Tax % of profit (per period) Note: q, FC, T must always refer to the same period. But only four can be influenced by the entrepreneur!
  • 8.
    8 Profit parameter 1:Price Price has many components: Price DDP Delivered, duties paid 20 DDU Delivered, duties unpaid 18 CIF Cost, Insurance, Freight 18 C&F Cost and Freight 17 DAF Delivered at Frontier 14 FOB Free on Board 12 EXW Ex Works 10 EUR/ton
  • 9.
    9 Profit parameter 2:VC Variable cost has four components: VC  VC1 Cost of raw materials and ingredients  VC2 Cost of processing inputs into outputs  VC3 Cost of packaging  VC4 Cost of delivery  transport, sales commission, import duties
  • 10.
    10 Profit parameter 3:quantity  q = actual quantity sold per period  qCAP = quantity at full capacity utilization quantity/hour * hours/day * days/year (harvest season) 3 ton/hour * 22 hours/day * 90 days/yr = 5940 ton/year  qBE = break-even quantity, where profit = 0
  • 11.
    11 Profit parameter 4:FC Fixed cost has four components: FC  FC1 Depreciation of fixed assets  FC2 Interest paid on capital  FC3 Overhead  salaries, repairs, transport, internet, etc.  FC4 Marketing  advertisement, design cost of new packaging, etc.
  • 12.
    Profit parameter 5:Tax  This Tax refers only to profit tax  Other taxes are either VC or FC  Tax is only paid when there is a profit  Conclusion: Profit tax does not cause losses… 12
  • 13.
    What causes losses? P – too low  VC – too high  q – too low  FC – too high 13  Which parameter is the most difficult one to predict by management?  Answer: q – the quantity sold
  • 14.
    14 Recognize costs -exercise 1. Ingredients 2. Labels 3. Bank charges 4. Machine repair 5. Machine maintenance 6. Raw material transport 7. Depreciation 8. Social tax 9. Diesel for the boiler 10. Electricity in the factory 11. Electricity in the office 12. Temporary labor 13. Management salary 14. Detergents and gloves 15. Billboard rental 16. Carton boxes Are the following Variable or Fixed costs?
  • 15.
    15 Margin and contribution Whatis MARGIN?  Margin = earnings per unit  Margin = price – variable cost per unit  Margin = P – VC What is CONTRIBUTION?  Contribution = earnings per period  Contribution = margin per unit * units sold  Contribution = (P – VC) * q
  • 16.
    16 Margin %  Margin% indicates risk.  Usual risk levels in bakery are: Margin % Level Comment <15% Very risky Only acceptable when the production process parameters and all prices are fully under control. 15-25% Risky Only acceptable if production and price fluctuations are within 5-10% range. 25-35% Normal 35-45% Robust 45-70% Very robust >70% Unlikely Check your calculations again!
  • 17.
    17 CB1 An overview: Profit calculationfor one product for one year
  • 18.
    CB1 - BAKERYSHOP 2014 EUR EUR per ton per year Price (delivered client) 1,270 100% Revenues (Own shop + Wholesale) 4,318,000 VC4 Sales commission (0%) - 0% Total Cost 4,241,532 VC4 Distribution costs 112 9% Profit Before Tax 76,468 Price (EXW) 1,158 91% Profitability % 2% Price (flour delivered) 194 Asset value (+stocks of goods) 3,537,857 Processing ratio 0.40 Depreciation % 6.4% Raw Material cost 78 10% FC1 225,610 20% Other ingredients 392 49% VC1 470 59% Debts 827,226 Interest rate 5.6% Production cost per hour 127 FC2 45,989 4% Production in tons per hour 0.800 VC2 159 20% Number of FTE employed 100 Overhead bakeries 327,787 28% Overhead HQ 97,535 8% Cost of packing (in 5.4 kg carton) 0.27 FC3 - Bakeries + HQ overhead 425,322 37% Number of crates per ton 185 VC3 49 6% FC4 - Shops Overhead 453,387 39% FG losses % in storage/ returned goods 18% FC % attributed to product 100.0% VC 797 100% FC (attributed to product) 1,150,308 100% Margin per ton 361 Volume sold q (ton/year) 3,400 Margin % 28% Contribution per year 1,226,776 VC 797 70% Break even volume (sales in ton/year) 3,188 Break even volume (flour in ton/year) 1,275 Fixed Cost / q 338 30% Output capacity per hour in ton 0.8 Total Cost / q 1,136 100% Production hours per day 20 Length of production season in days 350 Profit / q 22 Maximum capacity per year (tons) 5,600 Capacity utilization 61% 18 P VC FC q contribution profit margin profit per unit Break-even Capacity Utilization P-VC
  • 19.
    CB1 - BAKERYSHOP 2014 EUR EUR per ton per year Price (delivered client) 1,270 100% Revenues (Own shop + Wholesale) 4,318,000 VC4 Sales commission (0%) - 0% Total Cost 4,241,532 VC4 Distribution costs 112 9% Profit Before Tax 76,468 Price (EXW) 1,158 91% Profitability % 2% Price (flour delivered) 194 Asset value (+stocks of goods) 3,537,857 Processing ratio 0.40 Depreciation % 6.4% Raw Material cost 78 10% FC1 225,610 20% Other ingredients 392 49% VC1 470 59% Debts 827,226 Interest rate 5.6% Production cost per hour 127 FC2 45,989 4% Production in tons per hour 0.800 VC2 159 20% Number of FTE employed 100 Overhead bakeries 327,787 28% Overhead HQ 97,535 8% Cost of packing (in 5.4 kg carton) 0.27 FC3 - Bakeries + HQ overhead 425,322 37% Number of crates per ton 185 VC3 49 6% FC4 - Shops Overhead 453,387 39% FG losses % in storage/ returned goods 18% FC % attributed to product 100.0% VC 797 100% FC (attributed to product) 1,150,308 100% Margin per ton 361 Volume sold q (ton/year) 3,400 Margin % 28% Contribution per year 1,226,776 VC 797 70% Break even volume (sales in ton/year) 3,188 Break even volume (flour in ton/year) 1,275 Fixed Cost / q 338 30% Output capacity per hour in ton 0.8 Total Cost / q 1,136 100% Production hours per day 20 Length of production season in days 350 Profit / q 22 Maximum capacity per year (tons) 5,600 Capacity utilization 61% 19 24 data fields... Define your profit. Get the big picture first. Play with your data: what if…? Be sure 5 parameters
  • 20.
    What causes profits? Margins – higher  Quantity sold – higher  Contribution – higher  Fixed cost cannot be controlled in short term  Hence: maximize contribution!!  Low margin * low quantity  Low margin * high quantity  High margin * low quantity  High margin * high quantity 20
  • 21.
    21 Part 2 Why usethe Cigar Box Method? Argument 1: Bookkeeping is incomplete and leads to wrong business decisions
  • 22.
    22 Profit formula 1 Bookkeeper’smethod  Profit = Revenues – Total costs  Formula:  Profit = P*q – (VC*q + FC) “Total revenue, minus total cost is profit” Which documents are needed?
  • 23.
    23 Profit formula 2 CigarBox method  Profit = Contribution – Fixed costs  Formula:  Profit = (P – VC) * q – FC “Contribution minus fixed cost is profit” Which documents are needed?
  • 24.
    24 Comparing methods Bookkeeping: P*q –(VC*q + FC) = Profit Sales per period Costs per period Cigar Box: (P–VC) * q – FC = Profit Margin per unit * units per period per period Contribution per period End result: is the same!
  • 25.
    25 Why Cigar Boxmethod?  Bookkeeping:  Cigar Box: Year 1 A B C Total P 100 150 200 Variable cost/unit 80 160 150 Margin/unit 20 -10 50 q 15 10 10 Contribution 300 -100 500 700 Fixed costs 500 Profit before tax 200  Profit yr 2: up 25%  Profit yr 2: up 125%! Year 2 A B C Total P 100 150 200 Variable cost/unit 80 160 150 Margin/unit 20 -10 50 q 15 0 13 Contribution 300 0 650 950 Fixed costs 500 Profit before tax 450 Year 1 A B C Total P 100 150 200 q 15 10 10 Revenues 1500 1500 2000 5000 Variable costs 4300 Contribution 700 Fixed costs 500 Profit before tax 200 Year 2 A B C Total P 100 150 200 q 15 20 13 Revenues 1500 3000 2600 7100 Variable costs 6350 Contribution 750 Fixed costs 500 Profit before tax 250
  • 26.
    CB2 – ContributionAnalysis CB2 Krajina Klas, Bakery, Banja Luka, Bosnia 2012 BAM Bosnian Mark BAM 1 2 3 4 5 6 50 1 Category Baked Baked Baked Frozen Frozen Frozen Baked 2 Product Details Per Year Hljeb posavac Domaci hljeb 600 g Pogaca ispod saca Mini francuz tijesto 250 gr Mini francuz tijesto pp Lisnato virsla tijesto Hljeb casteggio 3 Primary and secondary packaging Paper bag, 15 in a crate (1x15) Paper bag, 15 in a crate (1x15) Paper bag, 18 in a crate (1x18) Plastic bag, 60 (1x60) 4 Unit weight in gram 600 600 720 200 200 140 600 5 Price point of unit in Mark 0.96 1.04 1.11 0.26 0.29 0.72 1.18 12 Price EXW per kg 1.23 1.51 1.46 1.16 1.35 5.03 1.85 15 VC1 / kg 0.56 0.57 0.57 0.73 0.73 2.46 0.64 16 VC1 % 71% 71% 71% 71% 69% 87% 74% 20 VC2 / kg 0.15 0.15 0.15 0.28 0.28 0.28 0.15 21 VC2 % 19% 19% 19% 27% 26% 10% 18% 26 VC3 / kg 0.03 0.03 0.02 0.01 0.03 0.05 0.01 27 VC3 % 4% 4% 3% 1% 3% 2% 1% 28 Returned goods % 7.0% 7.0% 7.0% 1.0% 1.0% 1.0% 7.0% 29 VC 0.80 0.80 0.79 1.03 1.06 2.81 0.85 30 Margin per kg 0.44 0.71 0.66 0.13 0.29 2.22 1.00 31 Margin % 44% 36% 47% 45% 11% 22% 44% 54% 38 Production per year in units 1,552,496 243,450 165,438 64,611 140,052 101,550 31,778 6,112 41 Production per year in kg 547,622 146,070 99,263 46,520 28,010 20,310 4,449 3,667 42 Contribution 434,850 64,020 70,500 30,830 3,700 5,980 9,860 3,660 43 Contribution % 100% 15% 16% 7% 1% 1% 2% 1% 26
  • 27.
    27 Why use the CigarBox Method? Argument 2: Allocating fixed costs leads to wrong business decisions.
  • 28.
    28 Cost price formula Total cost = Variable costs + Fixed costs  Cost price per unit = TC / q  Formula: TC/q = VC + FC/q Is the cost price a constant figure? Answer: no, it fluctuates with q, the quantity sold! In the cost price, the variable costs are fixed and the fixed costs are variable…!
  • 29.
    Allocating fixed coststo SKU’s 29 CB2 Krajina Klas, Bakery, Banja Luka, Bosnia 2012 Bosnian Mark BAM 1 2 3 4 5 50 1 Category Baked Baked Baked Frozen Frozen Baked 2 Product Details Per Year Hljeb posavac Domaci hljeb 600 g Pogaca ispod saca Mini francuz tijesto 250 gr Mini francuz tijesto pp Hljeb casteggio 4 Unit weight in gram 600 600 720 200 200 600 5 Price point of unit in Mark 0.96 1.04 1.11 0.26 0.29 1.18 12 Price EXW per kg 1.23 1.51 1.46 1.16 1.35 1.85 15 VC1 / kg 0.56 0.57 0.57 0.73 0.73 0.64 20 VC2 / kg 0.15 0.15 0.15 0.28 0.28 0.15 26 VC3 / kg 0.03 0.03 0.02 0.01 0.03 0.01 28 Returned goods % 7.0% 7.0% 7.0% 1.0% 1.0% 7.0% 29 VC 0.80 0.80 0.79 1.03 1.06 0.85 30 Margin per kg 0.44 0.71 0.66 0.13 0.29 1.00 31 Margin % 44% 36% 47% 45% 11% 22% 54% 32 FC per kg 358,284 0.65 0.65 0.65 0.65 0.65 0.65 33 TC (EXW) per kg 1.45 1.46 1.45 1.68 1.71 1.51 35 Profit (loss) per kg -0.22 0.06 0.01 -0.52 -0.36 0.34 36 Profit (loss) % 8% -17% 4% 1% -45% -27% 19% 37 Break-even price per unit 38 Production per year in units 1,552,496 243,450 165,438 64,611 140,052 101,550 6,112 41 Production per year in kg 547,622 146,070 99,263 46,520 28,010 20,310 3,667 42 Contribution 434,850 64,020 70,500 30,830 3,700 5,980 3,660 43 Contribution % 100% 15% 16% 7% 1% 1% 1%
  • 30.
    30 Why use the CigarBox Method? Argument 3: Classic P&L is not actionable CB2 P&L helps with business decisions.
  • 31.
    Table 1 -P&L Cigar Box June 2013 - May 2014 Sales 4,318,000 VC4 distribution costs 379,984 9% Sales (EXW) 3,938,016 VC1 (Raw materials) 1,597,831 64% VC2 (Processing cost) 540,431 22% VC3 (Packing materials) 167,963 7% FG Losses, Returned goods 174,393 7% Total VC 2,480,618 100% Contribution 1,457,398 34% FC3 (Bakeries + HQ overhead) 425,322 10% FC4 (Shops overhead) 453,387 10% EBITDA 578,689 13% FC1 (Depreciation) 225,610 5% EBIT 353,079 8% FC2 (Interest + fin. cost) 45,989 1% Total FC 696,921 16% Taxes 603 PROFIT AFTER TAX 306,487 7% Cash flow 532,097 12% Table 1 - P&L Classic June 2013 - May 2014 Revenues from sales 4,318,000 Other revenues -174,393 Total revenues 4,143,607 96% COGS 2,473,565 Gross profit 1,670,041 39% G&A 634,552 15% Indirect taxes 3,414 0% Distribution 408,049 9% Marketing 45,339 1% EBITDA 578,689 13% D&A 225,610 5% EBIT 353,079 8% Interest + leasing 36,340 FX Loss/FX Gain 5,001 Provision recovery 1,460 Oth. Fin. expenses 827 Non-recurring costs 2,361 Profit before tax 307,090 7% Taxes 603 Net Income 306,487 7% Cash flow 532,097 12% Better understanding of P&L Direct costs Indirect costs Indirect costs Direct costs Indirect costs Classic P&L: 1 direct cost + 10 indirect costs CB2 P&L: 4 direct costs + 5 in indirect costs
  • 32.
    32 Why use the CigarBox Method? Argument 4: Daily KPI updates, not analysis after one month.
  • 33.
    CB3 – Operationalmonitoring  Keep track of costs & KPI on a daily basis  Benchmark costs & KPI’s  Take action on deviations  Continuous improvement 33
  • 34.
    How to applythe Cigar Box?  Stand alone in Excel  CB2: Adapt existing bookkeeping system  Add CB labels to chart of accounts  Add CB labels to articles lists  Design CB2 periodic report  CB3: Adapt existing ERP system  Add actual VC1, VC2, VC3 to production orders  Add non-financial KPI’s (kWh, liters, machine hours)  Design CB3 daily report 34
  • 35.
    Who can applythe Cigar Box?  Your local software supplier  In consultation with a certified Cigar Box specialist.  Quite easy really….  35
  • 36.
    36 How Can BakersMake Better Business Decisions? Use the Cigar Box® Method Thank you for your attention