Processes and technologies
•Download as DOC, PDF•
0 likes•264 views

Processes and technologies

Recommended
Recommended
More Related Content
Similar to Processes and technologies
Similar to Processes and technologies (20)
More from Jubayer Alam Shoikat
More from Jubayer Alam Shoikat (20)
Recently uploaded
Recently uploaded (20)
Processes and technologies
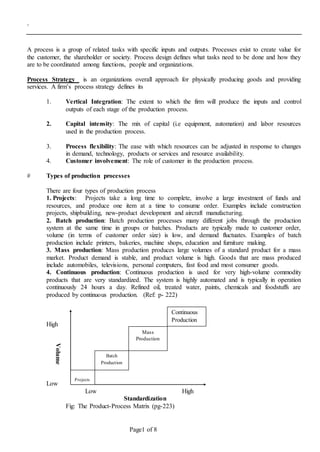
- 1. . Page1 of 8 A process is a group of related tasks with specific inputs and outputs. Processes exist to create value for the customer, the shareholder or society. Process design defines what tasks need to be done and how they are to be coordinated among functions, people and organizations. Process Strategy is an organizations overall approach for physically producing goods and providing services. A firm’s process strategy defines its 1. Vertical Integration: The extent to which the firm will produce the inputs and control outputs of each stage of the production process. 2. Capital intensity: The mix of capital (i.e equipment, automation) and labor resources used in the production process. 3. Process flexibility: The ease with which resources can be adjusted in response to changes in demand, technology, products or services and resource availability. 4. Customer involvement: The role of customer in the production process. # Types of production processes There are four types of production process 1. Projects: Projects take a long time to complete, involve a large investment of funds and resources, and produce one item at a time to consume order. Examples include construction projects, shipbuilding, new-product development and aircraft manufacturing. 2. Batch production: Batch production processes many different jobs through the production system at the same time in groups or batches. Products are typically made to customer order, volume (in terms of customer order size) is low, and demand fluctuates. Examples of batch production include printers, bakeries, machine shops, education and furniture making. 3. Mass production: Mass production produces large volumes of a standard product for a mass market. Product demand is stable, and product volume is high. Goods that are mass produced include automobiles, televisions, personal computers, fast food and most consumer goods. 4. Continuous production: Continuous production is used for very high-volume commodity products that are very standardized. The system is highly automated and is typically in operation continuously 24 hours a day. Refined oil, treated water, paints, chemicals and foodstuffs are produced by continuous production. (Ref: p- 222) High Low Low High Standardization Fig: The Product-Process Matrix (pg-223) Volume Projects Batch Production Mass Production Continuous Production
- 2. . Page2 of 8 # Process selectionwith Break-Even Analysis There are several quantitative techniques available for selecting a process. One that bases its decision on the cost trade –offs associated with demand volume is break-even analysis. The components of break-even analysis are volume, cost, revenue and profit. Volume is the level of production, usually expressed as the number of units produced and sold. We assume that the number of units produced can be sold. Cost is divided into two categories, fixed and variable. Fixed costs remain constant regardless of the number of units produced, such as plant and equipment and other elements of overhead. Variable costs vary with the volume of units produced, such as labor and material. Thus Total cost= Fixed cost + Variable cost Revenue on a per unit basis is simply the price at which an item is sold. Total revenue is price times volume sold. Total revenue = Volume X Price Profit = Total revenue – total cost By equating total revenue with total cost and solving for v, we can find the volume at which profit is zero. This is called break-even point. Profit = Revenue – Expenses Profit = ( Price per unit)(Number of units sold) – ( Variable cost per unit) (number of units) – Fixed Cost. i.e. P = Pq- Vq –F, now If P = 10, V = 5, F = 1000 Then P = 10q – 5q -1000 = 5q -1000 Ex: If sales i.e q = 0 , Then P= -1000 (loss 1000) If sales, i.e, q =1000, Then P = 4000 At BEP, P = 0, which implies, 0 = 5q – 1000 q = 200 units, which is called Break Even Quantity. Example: 6.1 (p-225) Travis and Jeff own an adventure company called Whitewater Rafting. Due to quality and availability problems, the two entrepreneurs have decided to produce their own rubber rafts. The initial investment in plant and equipment is estimated to be $2000. Labor and material cost is approximately $5 per raft. If the rafts can be sold at a price of $10 each, what volume of demand would be necessary to break even? Solution: Fixed cost F = $2000 Variable cost/ raft v = $5 Price/ raft p = $10 Then the break-even quantity is rafts vp F q 400 510 2000 Example: 6.2 (p-227) The owners of Whitewater Rafting believe demand for their product will far exceed the break-even point in example 6.1. They are now contemplating a larger initial investment of $10,000 for more automated
- 3. . Page3 of 8 equipment that would reduce the variable cost of manufacture to $2 per raft. The labor cost of constructing and customizing a raft remains at $1 per raft. Compare the old manufacturing process described in Example 6.1 with the new process proposed here. For what volume of demand should each process be chosen? Solution: If we called the old process = A new process= B The point of indifference between A and B is Process A Process B $ 2000 + $5q $ 10,000 + $3q or 2q = $8000 i.e q = 4000, q = 4000 rafts If demand ≤4000 rafts, the alternative with the lowest fixed cost, process A should be chosen. If demand ≥ 4000, the alternative with the lowest variable cost, process B is preferred. As the rafts are sold for $10 a unit regardless ofwhich process is used to manufacture them, without revenue line the graph confirmed the following. 20000 15335 15000 10000 5000 Choose Choose Process A Process B 2000 2000 4000 6000 4000 Point of indifference = 4000 units. Total cost of Pro: B Total cost of Pro: A
- 4. . Page4 of 8 # Process Planning (Make –or – Buy decisions) Process planning determines how a product will be produced or a service provided. It decides which components will be made in house and which will be purchased from a supplier, selects processes and specific equipment and develops and documents the specification for manufacturer and delivery. Make-or- Buy decision: Companies that control the production of virtually all of their component parts including the source ofraw materials are said to be vertically integrated. For process planning we need to decide which items will be purchased from an outside supplier and which items will be produced in our own factories. This first cut sourcing decision is called make – or – buy, which depends on the following factors: a. Cost: Make or buy, which is cheaper? To perform the service in house or subcontract it out? Cost includes overhead and manufacturing. b. Capacity: Depends on the stability of demand and the capacity of the process, the company produce in –house those parts or products with steady demand that consume a set capacity, where as those whose demand patterns are uncertain or volatile are usually subcontracted. c. Quality: The capability to provide quality parts consistently is an important consideration. It is easy to control quality of items produced at home. However, standardization of parts, supplier certification and supplier involvement in design can improve the quality of supplied parts. d. Speed: Sometimes components are purchased because a supplier can provide goods sooner than the manufacturer. Speed is useful only if it is reliable. e. Reliability: Suppliers need to be reliable in both the quality and the timing of what they supply. Many companies today are requiring their suppliers to meet certain quality and delivery standards to be certified as an approved supplier. ISO is the European Community’s quality certification program. f. Expertise: Companies that are especially good atmaking or designing certain items may want to keep control over their production. # Evaluating Process: Let Fb = Fixed cost of buy option / year Fm = Fixed cost of make option /year Vb = Variable cost per unit of buy option Vm = Variable cost per unit of make option. Total costfor buy option= Fb + VbQ Total costfor make option = Fm + VmQ To find the break-even quantity, we settwo costfunctions equal and solve for Q Fb + VbQ = Fm + VmQ
- 5. . Page5 of 8 Which implies Q= mb b VV F mF The make option should be considered ignoring qualitative factors, only ifits variable costs are lowe r than those ofthe buy option. The reason is that the fixed costs for making the services or productare typically higher than the fixed costs for buying. Again buy option is bestifproduction volumes are less than the break-even quantity. Example:1 The manager of a fast food restaurant featuring hamburgers is adding salads to the menu. There are two options and the price to he customer will be the same for each. The make option is to install a salad bar stocked with vegetables, fruits and toppings and letthe customer assemble the salad. The salad bar would have to be leased and a part time employee hired. The manager estimates the fixed costs at $ 12000 and variable costs taking $ 1.50 per salad. The buy option is to have pre-assembled salads available for sale. They would be purchased from a local supplier at $ 2.00 per salad. Offering pre - assembled of additional refrigeration, with an annual fixed cost of $2400. The manager expects to sell 25000 salads per year. What is the break-even quantity? Solution: The formula for the break-even quantity yields Q= salads VV F mb b 19200 5.12 240012000Fm The make option is preferred as the 25000 salad sales forecast exceeds this amount. Cost (25000, 52400)- Cost of P:2 (25000, 49500) –Cost of P:1 40,800 Process 1 20 10 Process 2 5 2 19200 5 10 15 20 25 (In Thousand) (InThousand)
- 6. . Page6 of 8 Process: 1 Process: 2 Fixed cost: 12000 Fixed cost: 2400 V. cost /unit: 1.50 V. cost / unit: 2.00 Expected demand: 25000 Expected demand: 25000 Break – Even Quantity: 19,200 Decision: Process 1 should be selected. # Process Analysis: Process Analysis is the systematic examination ofall aspects of a process to improve its operation-to make it faster more efficient, less costly or more responsive to the customer. The basic tools of process analysis are process flowcharts, process diagrams and process maps. Process flowcharts look atthe manufacture ofa productor delivery ofa service from a broad perspective. The chart uses five standard symbols O- For operations - For transportation □ – For Inspection D- For delay ∆ - Storage (Ref: p-229) By incorporating non productive activities (inspection, transportation, delay, storage), as well as productive activities (operations) process flow charts may be used to analyze the efficiency ofa series ofprocess and to suggest improvements. Process diagram detail each step ofa process in simple graphic form. Decision points can be added as well as parallel process flows (more complex process diagram are often called process maps) (Ref:p-134) # Process Reengineering: ( is the total redesign ofa process) Processes are planned in response to new facilities new products, new technologies, new markets or new customer expectations. Processes should be analyzed for improvementon a continuous basis. When continual improvement efforts have been exhausted and performance expectations still cannotbe reached with an existing process, itis time to completely redesign or reengineer the process. Example:2 The owner ofa small manufacturing business has patented a new device for washing dishes and cleaning dirty kitchen sinks. Before trying to commercialize the device and add itto her existing productline, she wants reasonable assurance ofsuccess,variable costare estimated at$7 per unit produced and sold. Fixed cost $56000 per year. a. If the selling price is $25, find break-even Qty. Show graphically and algebraically. b. Forecastsales for the first year are 10,000 units if the price is reduced to $15, with this pricing strategy, what would be the product’s total contribution to profits in the first year? Solution: a. Break-even quantity is units vp F q 3111 725 56000 b. Total cost = VQ +F = 7Q + 56000 = 7 X 3111 + 56000 = 77,777
- 7. . Page7 of 8 Total Revenue = 25Q = 77,775 Total profit contribution = Total revenue- Total cost = PQ – (VQ + F) = 15(10000) – [ 56000 + 7(10000)] = $124000 Exercise: 1 OM explorer owner ofWilliams products estimates the variable costs ofeach unit produced and sold at $6 and the fixed costs per year at$ 60,000. a. If the selling price is setat$ 18 each, how many units must be produced and sold for Williams to break even? Draw the chart also. b. Williams forecasts sales of10,000 units for the first year if the selling price is setat$14 each. What would be the total contribution to profits from this new productduring the first year? c. If the selling price is setat$12.50, Williams forecasts that first year sales would increase to 15000 units. Which pricing strategy ( $14 or $12.5) would resultin the greater total contribution to profits? Exercise: 2 A productat the Jennings Company has enjoyed reasonable sales volumes,butits contribution to profits have been disappointing. Lastyear 17500 units were produced and sold. The selling price is $22 per unit, variable costper unit is $18 and fixed costis $80,000 a. Find BEQ b. Jennings is considering ways to either stimulate sales volume or decrease variable costs. Managementbelieves that sales can be increased by 30 percentor that v can be reduced to 85 percentofits current level. Which alternative leads to higher contributions to profit, assuming that each is equally costly to implement? Exercise: 3 An interactive television service thatcosts $10 per month to provide can sold on the information highway for $15 per clientper month. If a service area includes a potential of15000 customers, what is the mosta company could spend on annual fixed costs to acquire and maintain the equipment? Exercise: 4 A restaurant is considering adding fresh brook troutto its menu. Customers would have the choice of catching their own trout from a simulated mountain stream or simply asking the waiter to net the trout for them. Operating the stream would require $ 10,600 in fixed costper year. Variable costs are estimated to be $6.70 per trout. The firm wants to break even if800 trout dinners are sold per year. Whatshould be the price ofthe new item? Example:3 Gabriel manufacturing must implementa manufacturing process thatreduces the amount oftoxic by products. Two processes have been identified thatprovide the same level oftoxic by productreduction. The first process would incur $300,000 of fixed costand $600 per unit ofvariable cost. The second process has fixed costof 4120000 and variable costs of$900 per unit. a. What is BEQ beyond which the first process is more attractive? b. What is the difference in total costif the quantity produced is 800 units? Solution: First Process Second Process Fixed cost = $300000 Fixed cost = $120000 V. cost/ unit = $600 V. cost/ unit = $900 BE qty 300000 + 600q = 120000 + 900q Which implies q = 600 units c. If q = 800 units Total costfor P:1 = 300,000 + 600q = 300,000 + 600 (800)
- 8. . Page8 of 8 = 780,000 Total costfor P: 2 = 120, 000 + 900 (800) = 840,000 Hence difference is $ 60000 more if P:2 is selected. Example: ( p- 243) Exercise: ( p- 245, Taylor III, No. 6-3, 6-4, 6-6, 6-7, 6-8, 6-9, 6-10)