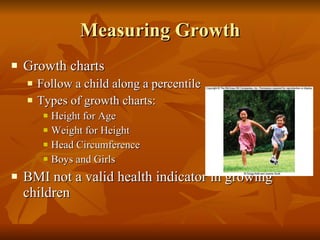
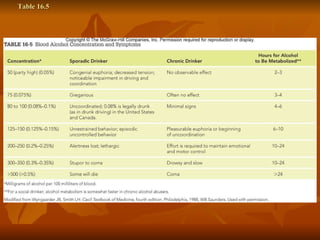
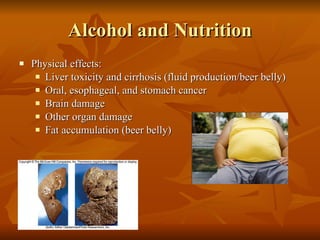
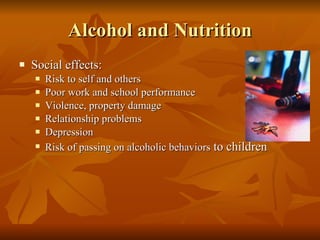
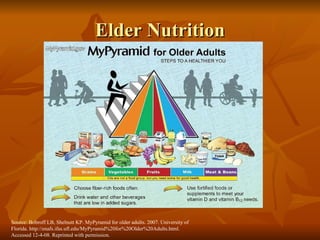
Lifecycle Nutrition Childhood, Adolescence and Elderly Nutrition
Measuring Growth Growth charts Follow a child along a percentile Types of growth charts: Height for Age Weight for Height Head Circumference Boys and Girls BMI not a valid health indicator in growing children
 
Nutrition Risks for Early Childhood Nutrients of concern: Protein – high need for essential amino acids, RDA = 0.95-1.10 grams/kg body weight Iron – stores depleted between 4 and 6 months of age Zinc – critical for body growth Vitamin D – difficult to obtain enough from food, seasonal variation in production ability via sunlight exposure
Early Childhood Eating Patterns Three main meals separated by snacks Parents or caregivers are primary role models Novel foods 12 exposures before a child no longer considers a food to be “new” anymore Satiety Tiredness, hunger, excitement, consistency Healthy eating patterns begin early
Source: U.S. Department of Agriculture. www.MyPyramid.gov
Nutrition Risks for Early Childhood Iron, vitamin deficiencies Food jags Excessive fluids Sweet, fat flavors Milk Constant snacking Choking
Adolescent Nutrition Generally low risk More peer influence, less parental influence Eating disorders Anorexia nervosa Bulimia nervosa
Alcohol and Nutrition Alcohol = ethanol Provides 7 kcal/gram One serving of alcohol depends on the alcohol content of the beverage (about 15 grams of ethanol per serving) Wine (4 oz) Beer (12 oz) Liquor (1.5 oz) Alcoholism – disease defined by the American Medical Association as impairment of physical and metal faculties due to chronic and excessive alcohol consumption Alcohol is the most commonly abused drug worldwide
Alcohol and Nutrition U.S. Dietary Guidelines If you consume alcohol, do so in moderation So what is moderate alcohol consumption? 2 or fewer drinks/day for men 1 or fewer drinks/day for women NO alcohol intake is recommended during pregnancy due to risk of fetal alcohol syndrome
Alcohol and Nutrition Metabolism of alcohol Absorbed rapidly through stomach and small intestine Crosses cell membranes readily, including brain cells Is released in urine, sweat, by lungs (BAC/breathalyzer) Rate of metabolism differs based on: Alcohol dehydrogenase and gender Body size Ethnicity Chronic use
Table 16.5
Alcohol and Nutrition Physical effects: Liver toxicity and cirrhosis (fluid production/beer belly) Oral, esophageal, and stomach cancer Brain damage Other organ damage Fat accumulation (beer belly)
Alcohol and Nutrition Social effects: Risk to self and others Poor work and school performance Violence, property damage Relationship problems Depression Risk of passing on alcoholic behaviors  to children
Elder Nutrition Source: Bobroff LB, Shelnutt KP. MyPyramid for older adults. 2007. University of Florida. http://enafs.ifas.ufl.edu/MyPyramid%20for%20Older%20Adults.html. Accessed 12-4-08. Reprinted with permission.
Elder Nutrition DETERMINE acronym D E T E R M I N E
Elder Nutrition Body composition changes Decreased lean body mass, increased body fat percentage    decrease in BMR Nutrition risk factors: Alcoholism Anorexia (poor appetite) Chronic disease Dysphagia Dentition Depression or dementia Decreased mobility, fine motor skills
Nutrition risk, cont.: Food procurement and preparation Diminished sense of smell and taste Long-term care facility Loss of spouse Polypharmacy Vision problems Financial hardship Surgery
Fig. 16.3.jpg
Nutrition Services in the Community Food Stamp Program Emergency Food Assistance Program Child and Adult Care Food Program (for daycare situations) Senior Nutrition Program Congregate Meals Program Home-Delivered Meals Program Senior Center Meals on Wheels

Childhood through elders ch17 18

  • 1.
    Lifecycle Nutrition Childhood,Adolescence and Elderly Nutrition
  • 2.
    Measuring Growth Growthcharts Follow a child along a percentile Types of growth charts: Height for Age Weight for Height Head Circumference Boys and Girls BMI not a valid health indicator in growing children
  • 3.
  • 4.
    Nutrition Risks forEarly Childhood Nutrients of concern: Protein – high need for essential amino acids, RDA = 0.95-1.10 grams/kg body weight Iron – stores depleted between 4 and 6 months of age Zinc – critical for body growth Vitamin D – difficult to obtain enough from food, seasonal variation in production ability via sunlight exposure
  • 5.
    Early Childhood EatingPatterns Three main meals separated by snacks Parents or caregivers are primary role models Novel foods 12 exposures before a child no longer considers a food to be “new” anymore Satiety Tiredness, hunger, excitement, consistency Healthy eating patterns begin early
  • 6.
    Source: U.S. Departmentof Agriculture. www.MyPyramid.gov
  • 7.
    Nutrition Risks forEarly Childhood Iron, vitamin deficiencies Food jags Excessive fluids Sweet, fat flavors Milk Constant snacking Choking
  • 8.
    Adolescent Nutrition Generallylow risk More peer influence, less parental influence Eating disorders Anorexia nervosa Bulimia nervosa
  • 9.
    Alcohol and NutritionAlcohol = ethanol Provides 7 kcal/gram One serving of alcohol depends on the alcohol content of the beverage (about 15 grams of ethanol per serving) Wine (4 oz) Beer (12 oz) Liquor (1.5 oz) Alcoholism – disease defined by the American Medical Association as impairment of physical and metal faculties due to chronic and excessive alcohol consumption Alcohol is the most commonly abused drug worldwide
  • 10.
    Alcohol and NutritionU.S. Dietary Guidelines If you consume alcohol, do so in moderation So what is moderate alcohol consumption? 2 or fewer drinks/day for men 1 or fewer drinks/day for women NO alcohol intake is recommended during pregnancy due to risk of fetal alcohol syndrome
  • 11.
    Alcohol and NutritionMetabolism of alcohol Absorbed rapidly through stomach and small intestine Crosses cell membranes readily, including brain cells Is released in urine, sweat, by lungs (BAC/breathalyzer) Rate of metabolism differs based on: Alcohol dehydrogenase and gender Body size Ethnicity Chronic use
  • 12.
  • 13.
    Alcohol and NutritionPhysical effects: Liver toxicity and cirrhosis (fluid production/beer belly) Oral, esophageal, and stomach cancer Brain damage Other organ damage Fat accumulation (beer belly)
  • 14.
    Alcohol and NutritionSocial effects: Risk to self and others Poor work and school performance Violence, property damage Relationship problems Depression Risk of passing on alcoholic behaviors to children
  • 15.
    Elder Nutrition Source:Bobroff LB, Shelnutt KP. MyPyramid for older adults. 2007. University of Florida. http://enafs.ifas.ufl.edu/MyPyramid%20for%20Older%20Adults.html. Accessed 12-4-08. Reprinted with permission.
  • 16.
    Elder Nutrition DETERMINEacronym D E T E R M I N E
  • 17.
    Elder Nutrition Bodycomposition changes Decreased lean body mass, increased body fat percentage  decrease in BMR Nutrition risk factors: Alcoholism Anorexia (poor appetite) Chronic disease Dysphagia Dentition Depression or dementia Decreased mobility, fine motor skills
  • 18.
    Nutrition risk, cont.:Food procurement and preparation Diminished sense of smell and taste Long-term care facility Loss of spouse Polypharmacy Vision problems Financial hardship Surgery
  • 19.
  • 20.
    Nutrition Services inthe Community Food Stamp Program Emergency Food Assistance Program Child and Adult Care Food Program (for daycare situations) Senior Nutrition Program Congregate Meals Program Home-Delivered Meals Program Senior Center Meals on Wheels