This document discusses fundamentals of chemical engineering related to single-phase systems and ideal gases. It includes:
1) Descriptions of liquid and solid densities, and how they are relatively independent of temperature and pressure changes.
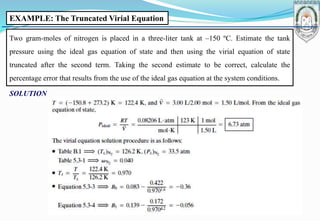
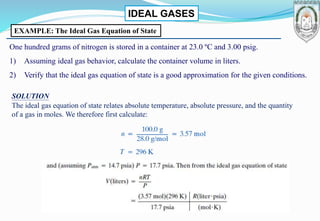
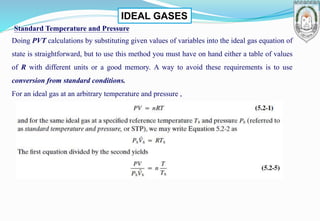
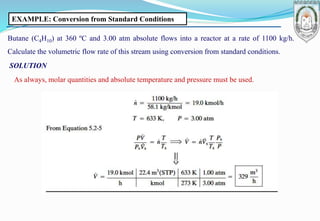
2) Derivation of the ideal gas equation of state from kinetic theory, and examples of using the equation to calculate properties like volume and molar flow rates.
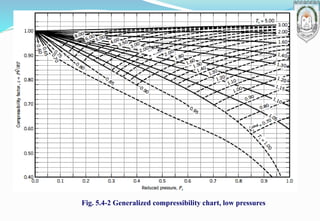
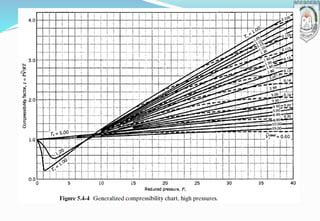
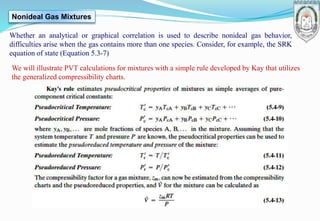
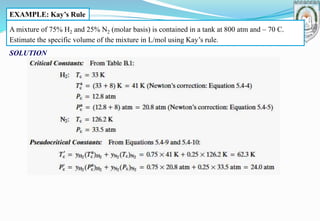
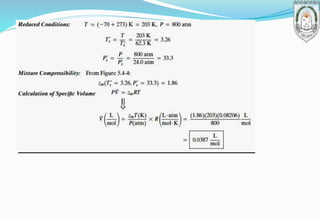
3) Introduction of the compressibility factor and using generalized compressibility charts to estimate non-ideal gas behavior based on reduced temperature and pressure.


![EXAMPLE: Standard and True Volumetric Flow Rates
The flow rate of a methane stream at 285 ºF and 1.30 atm is measured with an orifice meter.
The calibration chart for the meter indicates that the flow rate is 3.95×10 SCFH (standard
cubic feet per hour [ft3 (STP)/h]). Calculate the molar flow rate and the true volumetric flow
rate of the stream.
SOLUTION](https://image.slidesharecdn.com/1-230503031909-200aa989/85/1-Single-Phase-Systems-pptx-14-320.jpg)